Clarus CCPView has daily volume and open interest data published by each CCP, which is filtered, normalised and aggregated to allow meaningful comparisons of volumes.
Today we look at 2Q22 Volume and market share in IRD for:
- USD Swaps (LIBOR, OIS, SOFR)
- EUR Swaps (EURIBOR, OIS, €STR)
- GBP Swaps (LIBOR, SONIA)
- JPY Swaps (IBOR, TONA)
- AUD Swaps (BBSW, AONIA)
- CAD Swaps (IBOR, CORRA)
- EMEA Swaps
- AsiaPac Swaps
- LatAm Swaps
- Cross Currency Swaps
Onto the charts, data and details.
Volumes and Market Share
For major currencies and regions, vanilla swaps referencing IBORs and OIS Swaps referencing RFRs.
We use single-side gross notional and cleared volume over a period, either a Year, a Quarter or a Month.
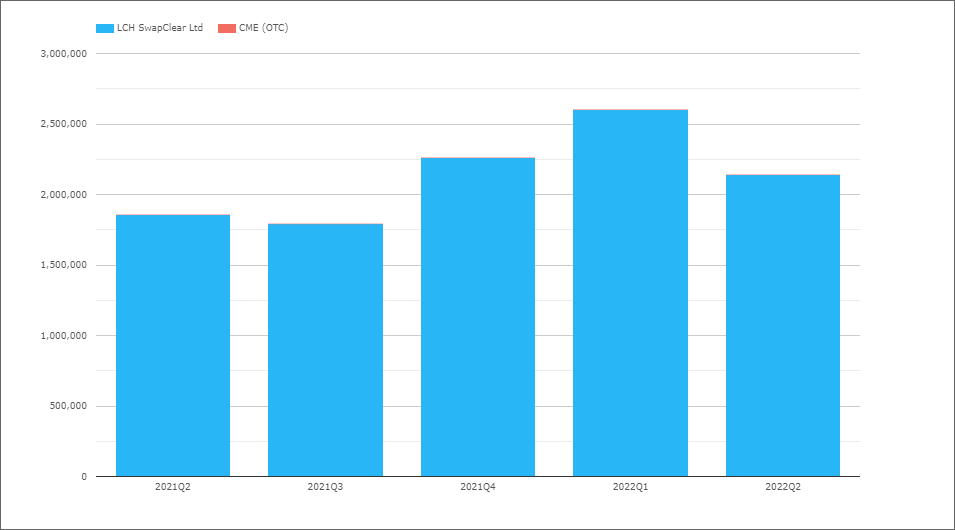
USD Swaps (Libor)
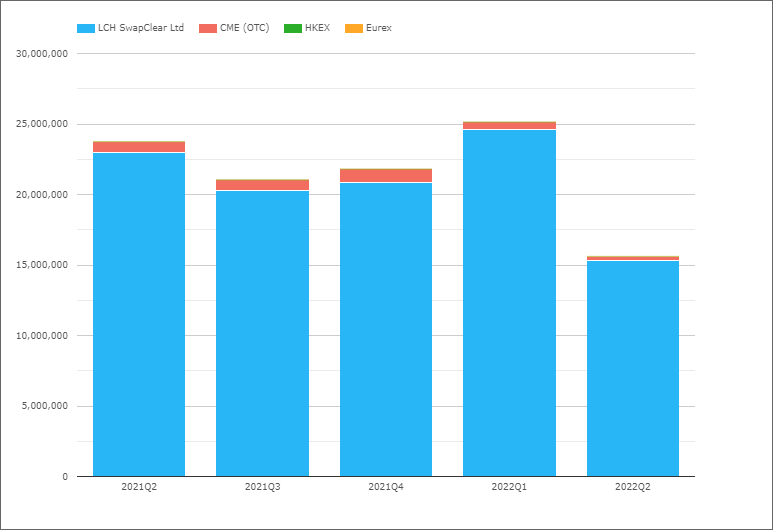
- 2022Q2 with $15.6 trillion compared to $23.8 trillion in 2021Q2
- Significantly down from each of the past 4 quarters, still surprisingly high given the move to SOFR, but we also need to look FRA volume that is now within IRS, (as executed as single-period swaps, SPS), see the next chart below, to draw a better comparison
- LCH SwapClear with $15.3 trillion in 2022Q2 and $23 trillion in 2021Q2
- CME OTC with $295 billion in 2022Q2 and $750 billion in 2021Q2
- 2022Q2 Share is LCH 98.1% and CME 1.9%, compared to 96.8% v 3.1% in 2021Q2, but not really an apples to apples comparison given the FRA issue noted above
A chart showing USD FRAs by quarter for the same period is illustrative.
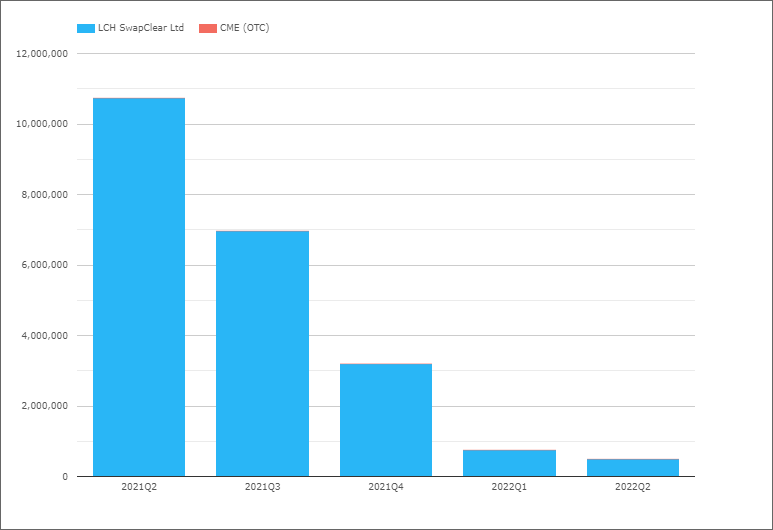
- 2022Q2 with just $0.5 trillion compared to $10.7 trillion in 2021Q2, a difference of $10.2 trillion
- Assuming that portfolio maintence activity for rate fixing risk is fairly constant , we can then assume that most of $10 trillion of FRA volume in 2021Q2 is now within the 2022Q2 IRS volumes
- So rather than the comparison above of $15.6 trillion in 2022Q2 with the $23.8 trillion in 2022Q1, we should adjust the 2022Q2 down by $10 trillion to leave $5.6 trillion for 2022Q2, a spectacular drop in Libor IRS indeed
USD OIS (All)
Referencing either Fed Funds or SOFR.
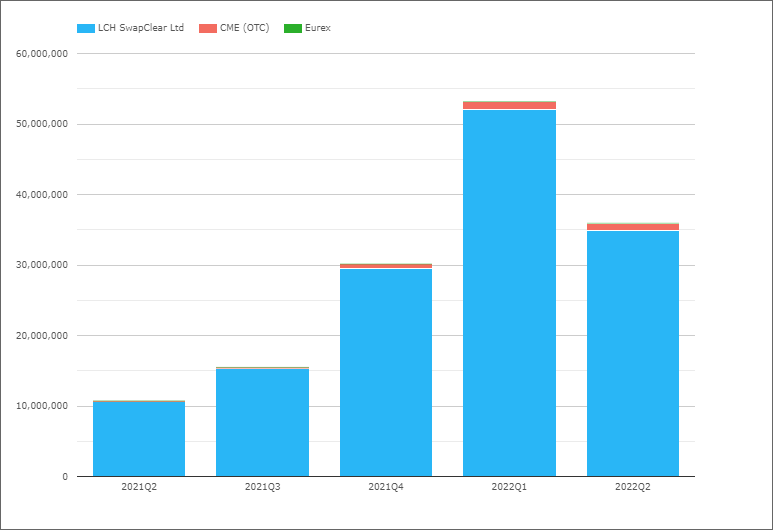
- 2022Q2 with $36 trillion compared to $10.8 trillion in 2021Q2 and $53 trillion in 2022Q1
- So significantly up from a year earlier but down from the highs in the prior quarter
- LCH SwapClear with $34.9 trillion in 2022Q2 and $10.6 trillion in 2021Q2
- CME OTC with $1 trillion in 2022Q2 and $0.2 trillion in 2021Q2
- 2022Q2 Share is LCH 97.1% and CME 2.9%, compared to 98.4% v 1.6% in 2021Q2
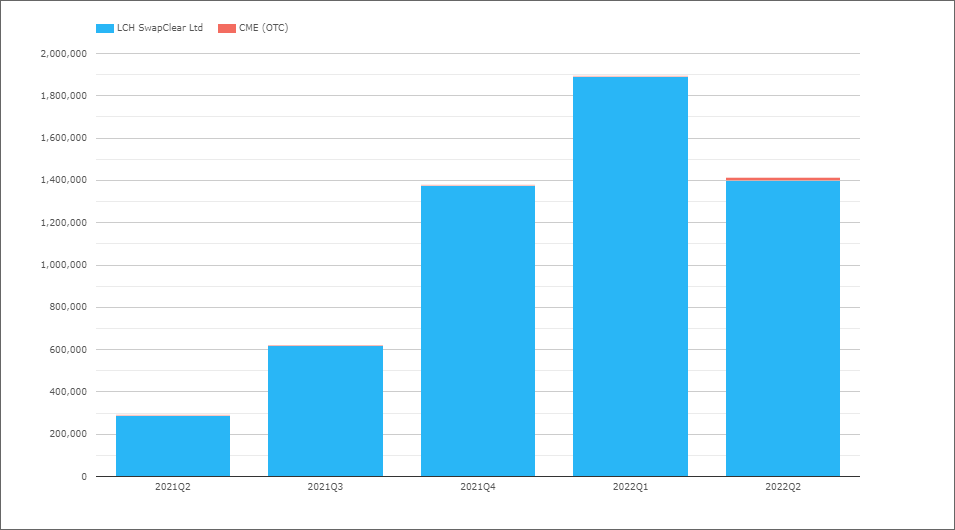
USD Swaps (SOFR)
Next isolating Swaps that reference SOFR, either OIS or Basis, volumes by month.
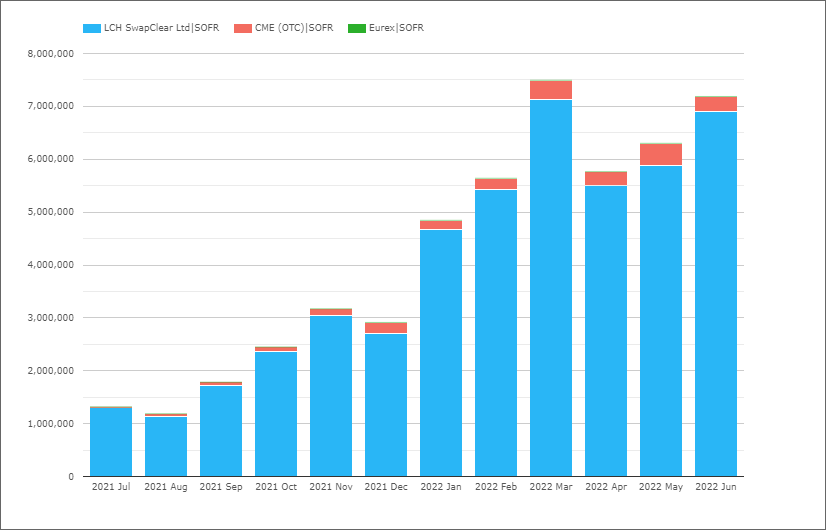
- June 2022 with $7.2 trillion is the second highest month
- 2022Q2 with $19.3 trillion, is up from $18 trillion in 2021Q1
- SOFR just over 50% of the OIS volume in the quarter
- Good increasing trends in monthly SOFR volumes
- 2022Q2 Share is LCH 94.8% and CME 5.2%, compared to 95.8% v 4.2% in 2022Q1
That’s all for USD for today.
EUR Swaps (Euribor)
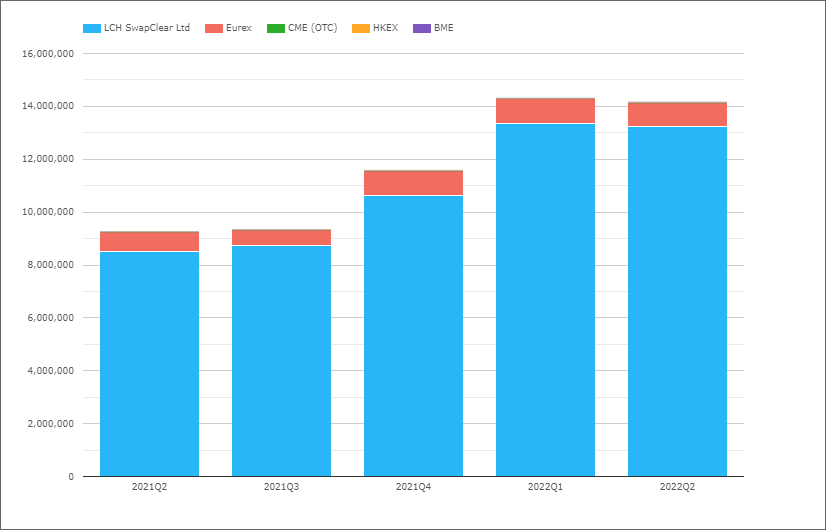
- 2022Q2 with €14.1 trillion compared to €9.2 trillion in 2021Q2
- LCH SwapClear with €13.2 trillion in 2022Q2 and €8.5 trillion in 2021Q2
- Eurex with €0.89 trillion in 2022Q2 and €0.73 trillion in 2021Q2
- 2022Q2 market share is LCH 93.7%, Eurex 6.3%
- While 2021Q2 share was 92.1% and 7.9% respectively
EUR OIS (All)
Referencing either EONIA or €STR, though in recent quarters all should be €STR.
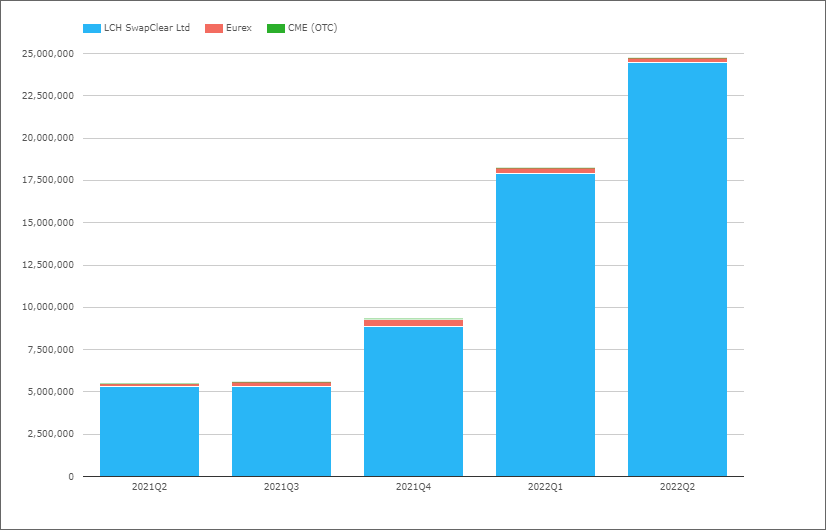
- 2022Q2 with €24.7 trillion compared to €5.5 trillion in 2021Q2
- A spectacular increase, even higher proportionally than that in USD OIS (above)
- LCH SwapClear with €24.5 trillion in 2022Q2 and €5.3 trillion in 2021Q2
- Eurex with €0.28 trillion in 2022Q2 and €0.18 trillion in 2021Q2
- 2022Q2 market share is LCH 98.9%, Eurex 1.1%
- While 2021Q2 share was 94.9% and 5.1% respectively
EUR Swaps (€STR)
Next isolating Swaps that reference €STR, either OIS or Basis.
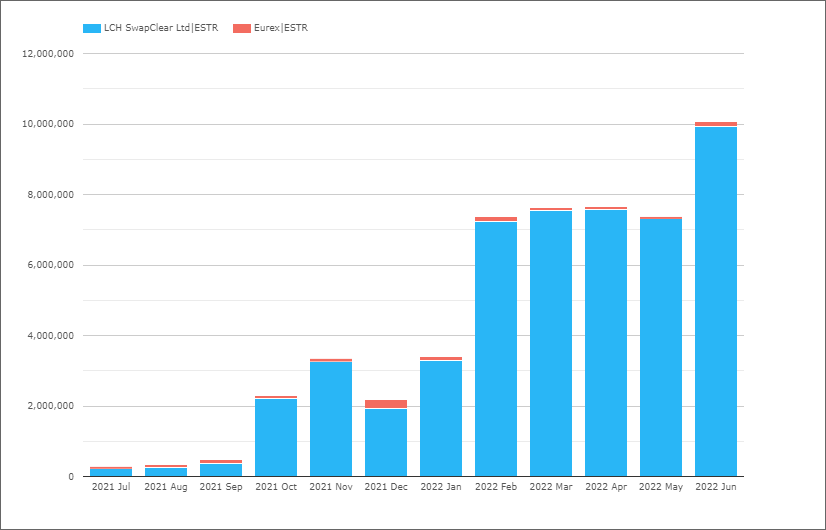
- June a record month with €10.1 trillion, up from €7.4 trillion in May
- Volumes from Feb 2022 onwards > €7 trillion each month
- 2022Q2 with €25.1 trillion, up from €18.4 trillion in 2022Q1
- €STR volumes now higher than SOFR swap volumes in each month from Feb 2022 onwards
- 2022Q2 Share is LCH 98.8% and Eurex 1.2%, compared to 98.1% v 1.9% in 2022Q1
GBP Swaps (Libor)
- A nice chart showing the end GBP Libor (after 30+ years of swaps trading)
- A tiny amount of £3.7 billion in 2022Q2, down from £17 billion and £1.2 trillion in prior quarters
And there is no GBP FRA or Basis volume since 2021Q4.
Let’s move onto the replacement rate, SONIA.
GBP OIS (SONIA)
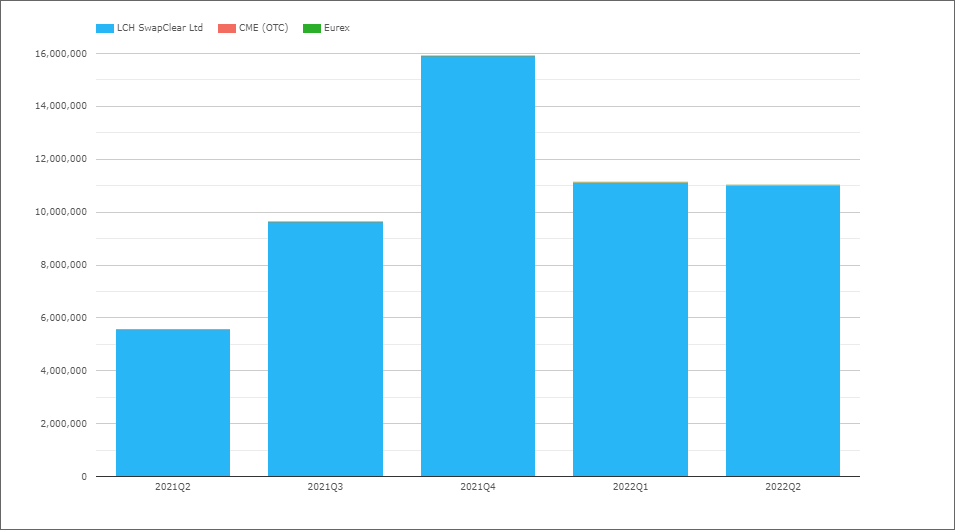
- 2021Q4 with £16 trillion, the highest quarter since 2020Q1 (not shown) with £18 trillion
- 2022Q2 with £11 trillion, similar to 2022Q1 and up from £5.6 trillion in 2021Q2
- LCH SwapClear with 99.9% share
JPY Swaps (IBOR)
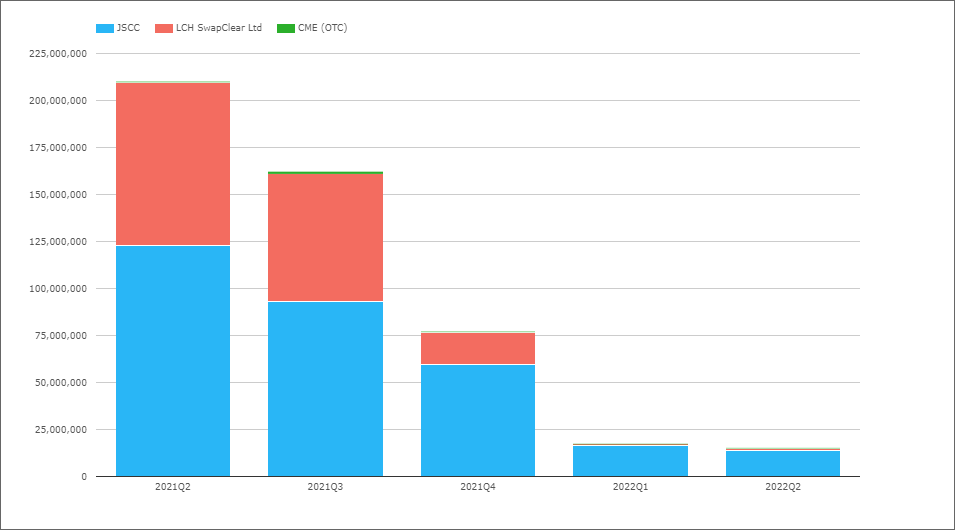
- Another nice chart showing the end JPY Libor (while Tibor remains at JSCC)
- A tiny amount of Y15 billion in 2022Q2, down from Y210 trillion in 2021Q2
Let’s move onto the replacement rate, TONA.
JPY OIS (TONA)
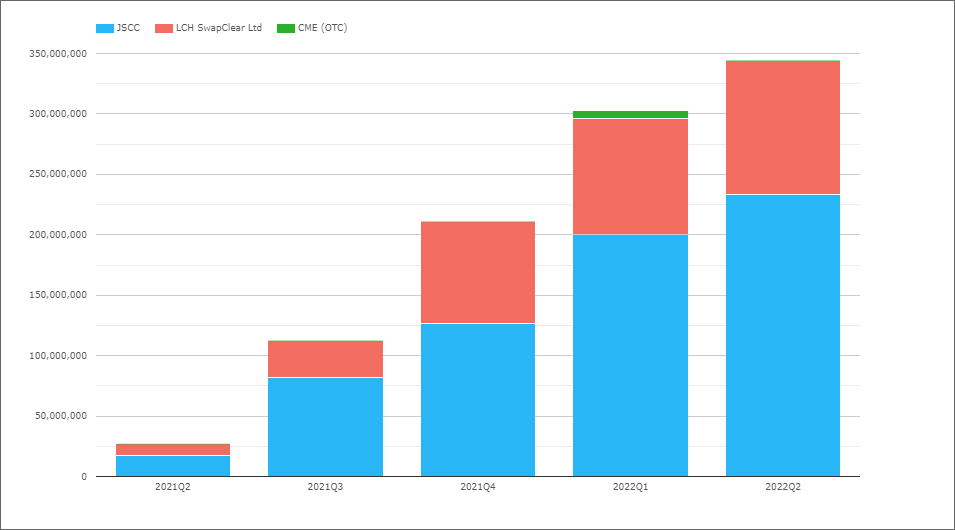
- 2022Q2 with Y344 trillion compared to Y303 trillion in 2022Q1 and Y27 trillion in 2021Q2
- A spectacular increase, driven by the end of JPY Libor and move to the RFR TONA
- JSCC with Y233 trillion in 2022Q2, compared to Y17 trillion in 2021Q2
- LCH SwapClear with Y11 trillion in 2022Q2, compared to Y10 trillion in 2021Q2
- CME OTC with Y31 billion in 2022Q2
- 2022Q2 Share is JSCC 67.7%, LCH 32.3%, compared to 63.7% and 36.1% in 2021Q2
AUD Swaps
As Australia is a multi-rate jurisdiction with both AONIA and BBSW, we will chart both OIS and IRS products togather.
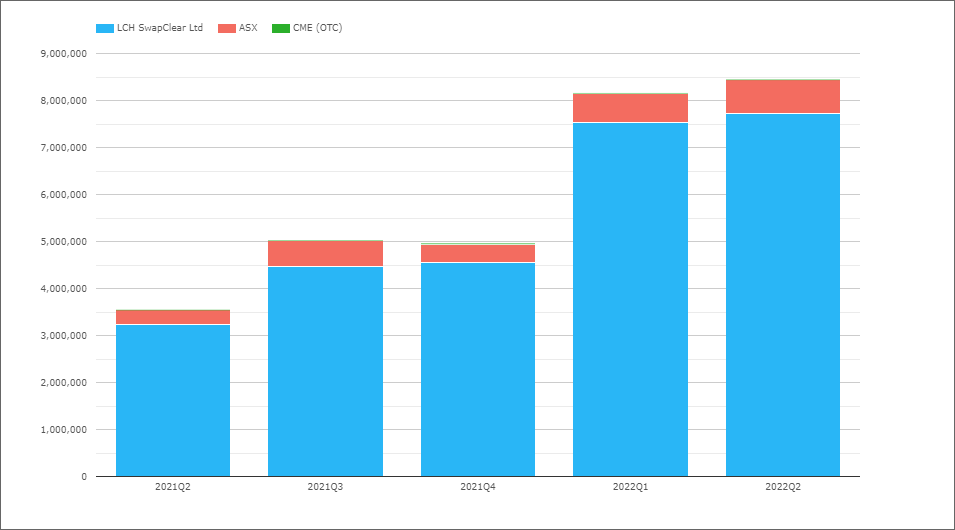
- 2022Q2 with A$8.45 trillion, compared to A$3.5 trillion in 2021Q2
- LCH SwapClear with A$7.7 trillion in 2022Q2 and A$3.2 trillion in 2021Q2
- ASX with A$0.73 trillion in 2022Q2 and A$0.3 trillion in 2021Q2
- 2022Q2 Share is LCH 91.3% and ASX 8.7%, the same as in 2021Q2
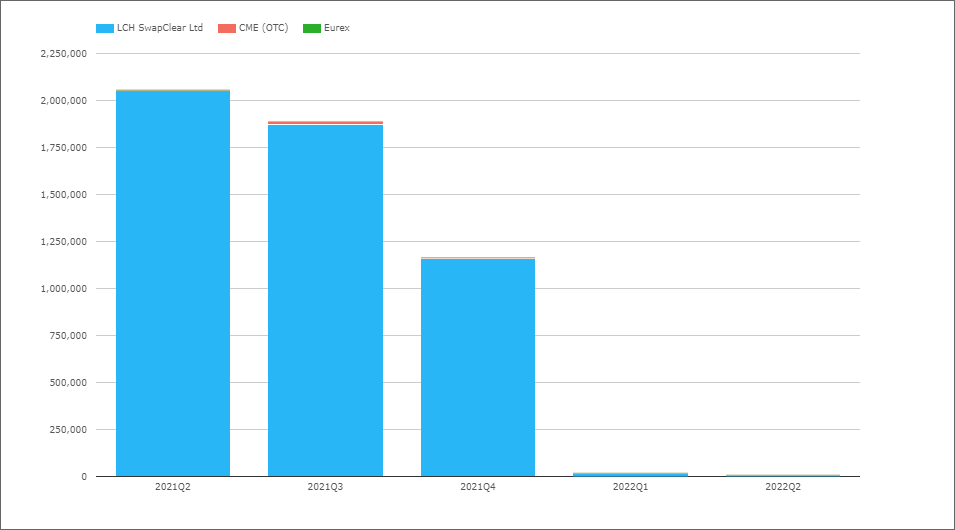
CAD Swaps (IBOR)
- 2022Q2 with C$2.1 trillion, compared to C$1.9 trillion in 2021Q2
- LCH SwapClear with 99.9% of the volume
CAD OIS (CORRA)
- 2022Q2 with C$1.4 trillion, compared to C$1.9 trillion and C$1,4 trillion in prior quarters
- Though still well below the record high of C$4.5 trillion in 2020Q1
- LCH SwapClear with 98.9% of the volume in the recent quarter
EMEA Swaps
Now let’s switch to EMEA Swaps (all types) and volumes by currency.
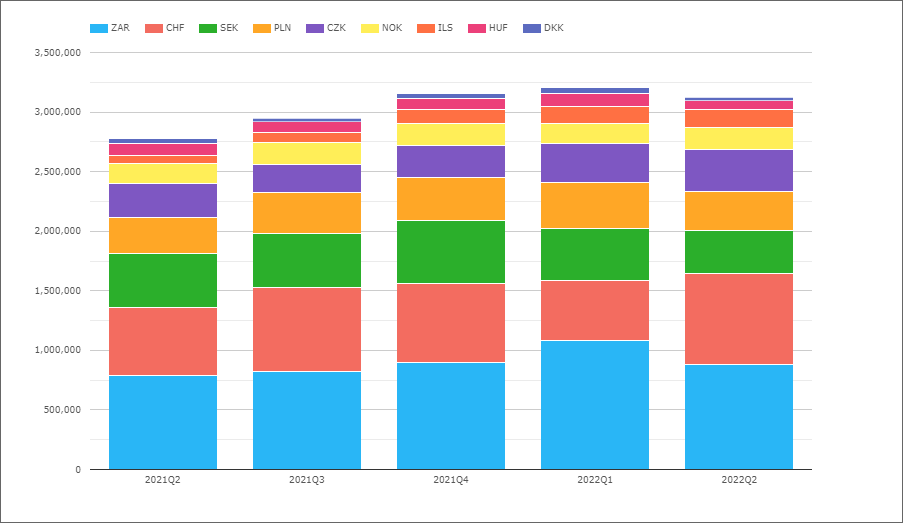
- Each quarter with a consistently approximate volume of $3 trillion
- ZAR the largest in 2022Q2 with $880 billion
- CHF next with $770 billion and significantly up from the prior quarter
- SEK with $356 billion is down
- CZK with $352 billion
- PLN with $330 billion
- NOK with $185 billion
- ILS with $148 billion
- HUF with $80 billion
- DKK with $26 billion
Not shown in the chart is market share by CCP, where LCH has >99% share for the whole period in every currency except for:
- PLN, LCH with 93.8%, KDPW 3.8%, CME 2.4%
- SEK, LCH with 95.7%, Nasdaq OMX with 4.3%
- HUF, LCH with 96.8%, CME with 3.2%
- CZK, LCH with 98.5%, CME with 1.5%
AsiaPac Swaps
Now let’s switch to AsiaPac Swaps (all types) and volumes by currency.
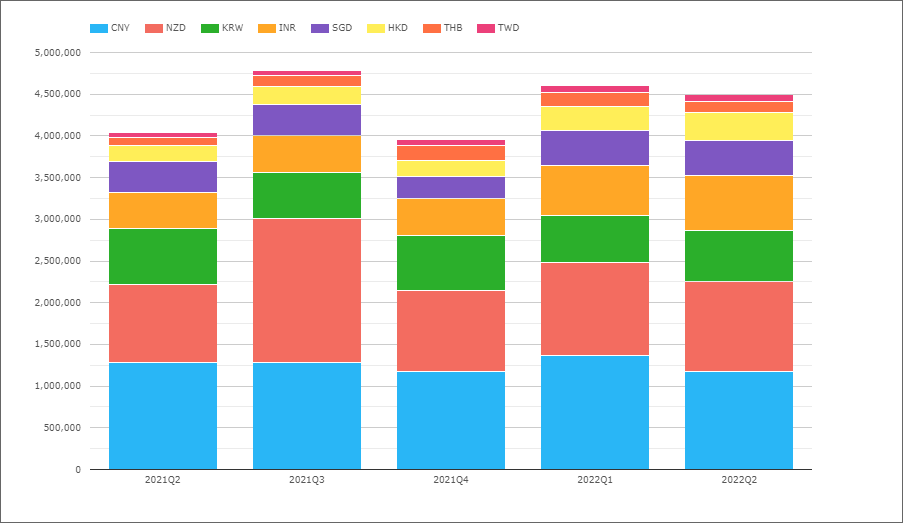
- Each quarter in the $4 trillion to $5 trillion range
- So materially larger than the $3 trillion for EMEA
- CNY the largest in 2022Q2 with $1.17 trillion
- NZD next with $1.1 trillion
- INR with $652 billion
- KRW with $612 billion
- SGD with $417 billion
- HKD with $335 billion
- THB with $135 billion
- TWD with $91 billion
Not shown in the chart is market share by CCP, where LCH has 100% share for the whole period in every currency except for:
- CNY, Shanghai with 57.9%, LCH with 41.9%, HKEX 0.2%
- INR, LCH with 64.8%, CCIL with 35.2%
- HKD, LCH with 97.7%, HKEX with 1.5%, CME with 0.8%
- SGD, LCH with 99.8%, CME with 0.2%
LatAm Swaps
And last but not least, lets look at LatAm Swaps.
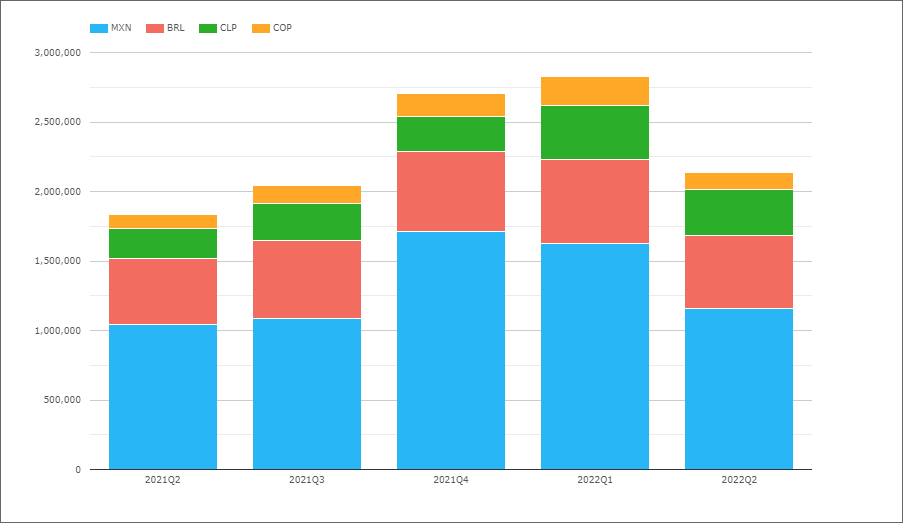
- Each quarter in the $1.8 trillion to $2.8 trillion range
- So lower than both EMEA or LatAm
- But then only 4 countries represented compared to 9 and 8
- MXN the largest in 2022Q2 with $1.2 trillion
- BRL next with $530 billion
- CLP with $320 billion
- COP with $120 billion
Not shown in the chart is market share by CCP, where for the whole period the share is:
- MXN, CME with 90.7%, Asigna/Mexder 7.2%, LCH 2.0%
- BRL, CME 99.2%, LCH 0.8%
- CLP, CME 98.6%, LCH 1.4%
- COP, CME 98.3%, LCH 1.7%
Cross Currency Swaps
HKEX the only CCP with cleared Cross Currency Swap volumes.
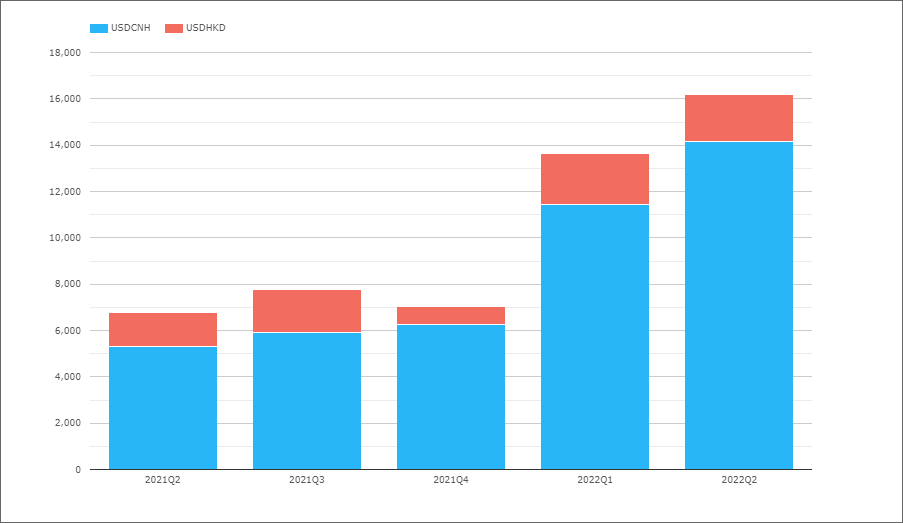
- 2022Q2 with $16 billion, up from $6.8 billion in 2021Q2
- Most volume in USDCNH and some in USDHKD
LCH SwapAgent offers processing, margining and settlement of bi-lateral XCCY Swaps, but does not regularily disclose volumes, though we know from a press release that it processed 10,186 trades in 2021, a 489% year-on-year increase.
That’s It
18 Charts for an overview.
Still a lot more data to look at
Volume, DV01 and Open Interest by currency.
IR Futures in all the major currencies and US Treasury volumes.
Credit Derivatives and FX Derivatives.
For more details, please contact us for a CCPView demonstration.