A review of Credit Derivatives (CRD) volumes and market share at Clearing Houses (CCPs) in 3Q 2022.
- Index, Single-name and Swaptions
- Volumes in 3Q slightly up on 2Q and significantly up on a year earlier
- USD CRD volumes up 36% in 3Q 2022 compared to 3Q 2021
- EUR CRD volumes up 58% in 3Q 2022 compared to 3Q 2021
- EUR iTraxx volumes up 57% and EUR CDS up 77%
- EUR iTraxx share is ICE Clear Credit 64.6%, ICE Clear Europe 21.8%, LCH CDS Clear 13.5%
- EUR CDS share is ICE Clear Credit 45.8%, ICE Clear Europe 22.2%, LCH CDS Clear 32%
- Swaptions volume in both EUR & USD
All the charts and detail from CCPView.
CRD by Currency
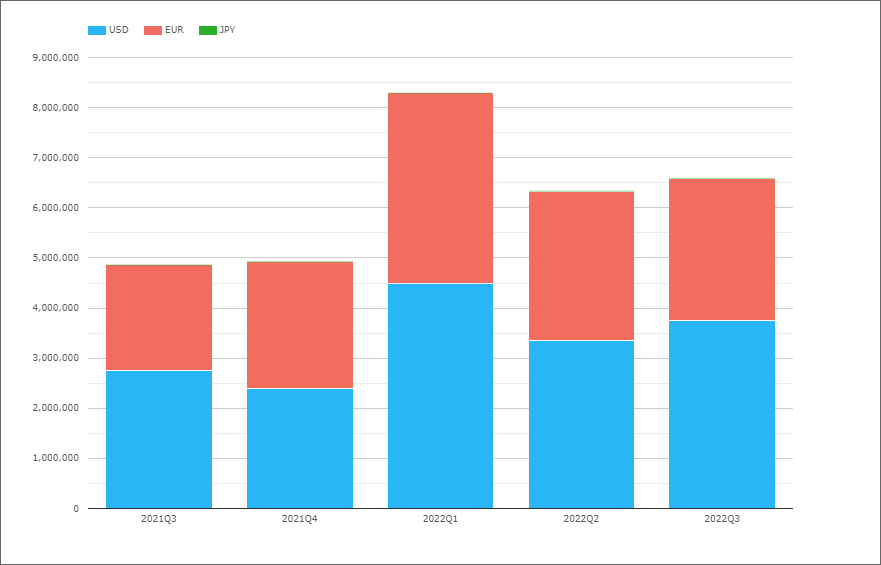
- USD CRD 2022Q3 volume of $3.75 trillion, is up 36% from $2.75 trillion in 2021Q3
- EUR CRD 2022Q3 volume of $2.8 trillion, is up 35% from $2.1 trillion in 2021Q3, while in EUR terms the increase is 58%, from €1.8 trillion to €2.8 trillion as EUR/USD is now at parity
- JPY CRD 2022Q3 volume of $1.5 billion, is the same as 2021Q3
So significant increases in both USD and EUR from a year earlier, slightly up on Q2 and down from Q1 highs.
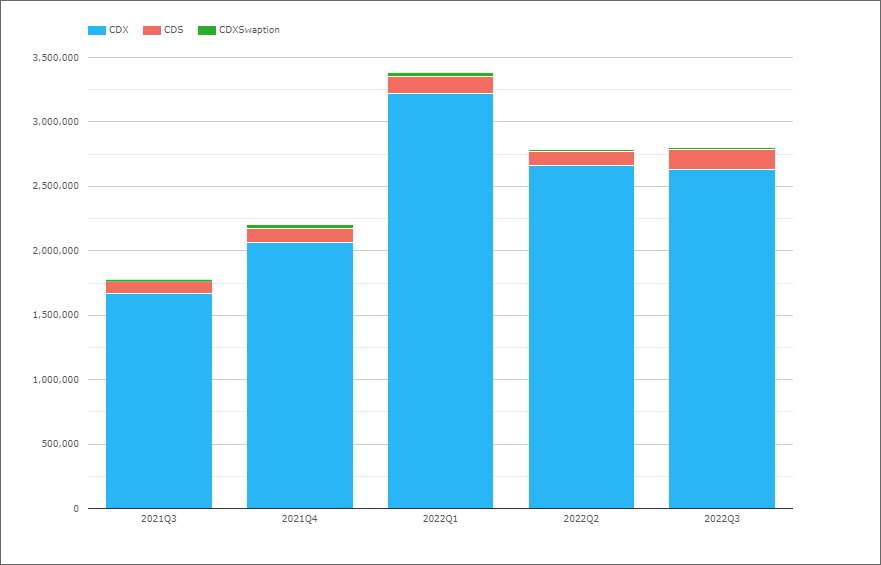
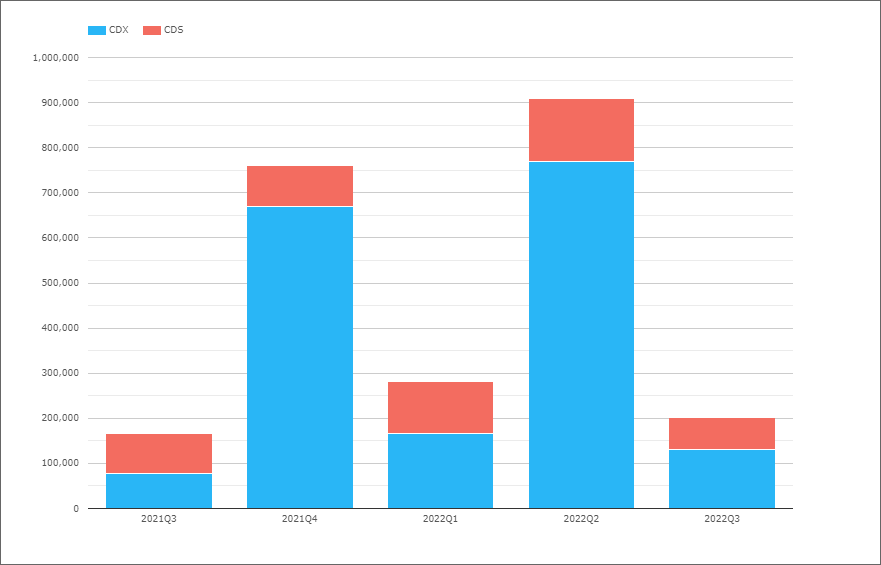
USD CDX, CDS and Swaptions
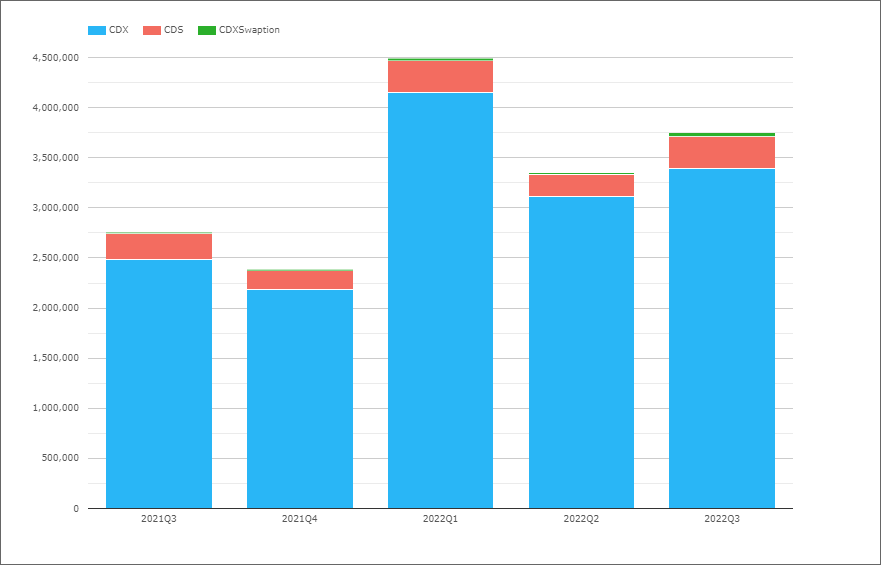
- USD CDX 2022Q3 volume of $3.4 trillion, up from $2.5 trillion in 2021Q3
- USD CDS 2022Q3 volume of $320 billion, up from $260 billion in 2021Q3
- USD CDXSwaptions 2022Q3 volume of $39 billion, up from $8 billion
CDX volumes in 2022Q3 were 90% of USD volume, single-name 9% and CDXSwaptions 1%, which is a slightly lower in CDX than the prior quarters 93%, 6.5% and 0.5%.
USD CRD Index Series
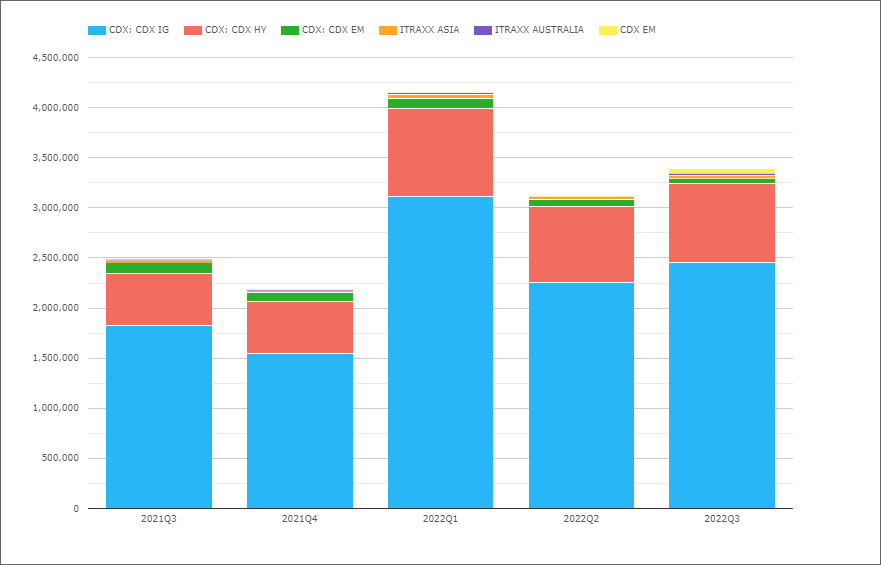
- USD CDX.IG 2022Q3 volume of $2.5 trillion, up 35% from $1.8 trillion in 2021Q3
- USD CDX.HY 2022Q3 volume of $0.78 trillion, up 49% from $0.52 trillion in 2021Q3
- USD CDX.EM 2022Q3 volume of $102 billion, is similar to 2021Q3
- USD iTraxx.Asia 2022Q3 volume of $33 billion, up from $25 billion
- USD iTraxx.Australia 2022Q3 volume of $16.8 billion, up from $10.5 billion
CDX.IG volumes representing 72% of USD Index volumes.
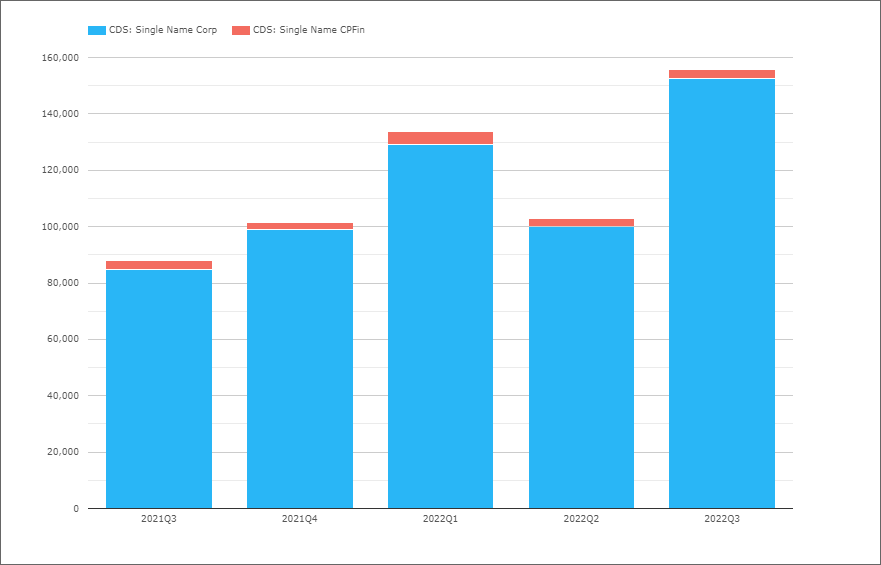
USD Single-name CDS
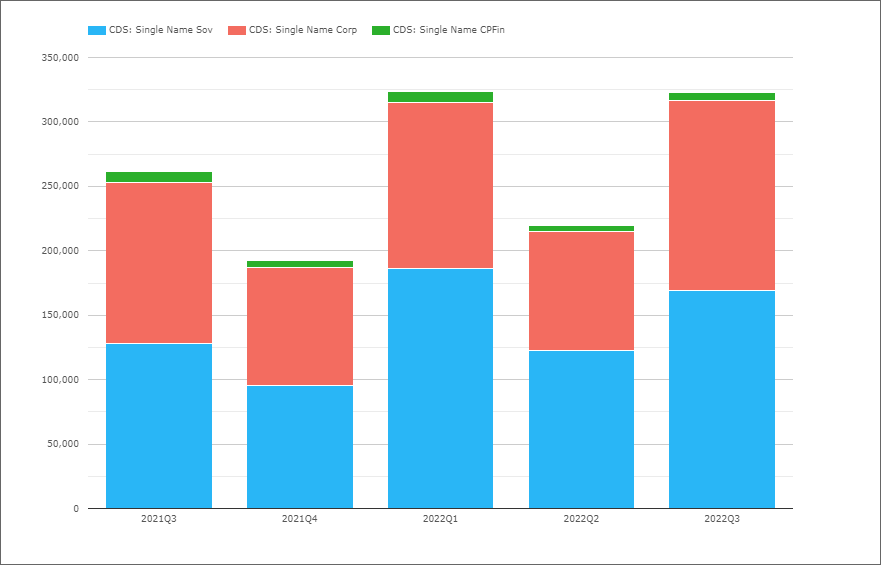
- Single-name Sovereign volume of $169 billion, up 32% from $128 billion in 2021Q3
- Single-name Corporate volume of $148 billion, up 18% from $125 billion in 2021Q3
- Single-name CP Financials volume of $6.5 billion, similar to $8.3 billion in 2021Q3
CDS Sovereign volume represents 52% of total USD single-name volume in the quarter.
USD Market Share by CCP
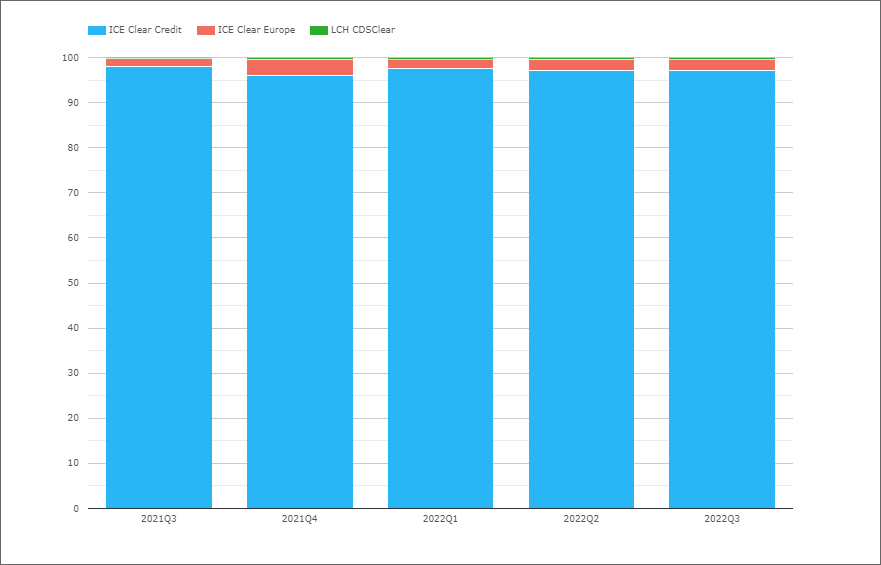
- ICE Clear Credit with 97.1% in 2022Q3, down a touch from 97.9% in 2021Q3
- ICE Clear Europe with 2.5% in 2022Q3, up a touch from 2% in 2021Q3
- LCH CDSClear with 0.4% in 2022Q3, up from 0.1% in 2021Q3 and same as Q2 and Q1
ICE Clear Credit share in single-name is slightly higher in single names and it is the only CCP with USD CDXSwaption volume.
EUR CRD Index, CDS and Swaptions
- EUR iTraxx 2022Q3 volume of €2.6 trillion, up 57% from €1.67 trillion in 2021Q3
- EUR CDS 2022Q3 volume of €156 billion, up 77% from €88 billion in 2021Q3
- EUR iTraxxSwaptions 2022Q3 volume of €17.7 billion, similar to €18.3 billion in 2021Q3
EUR iTraxx volumes representing 94% of EUR volume.
EUR iTraxx
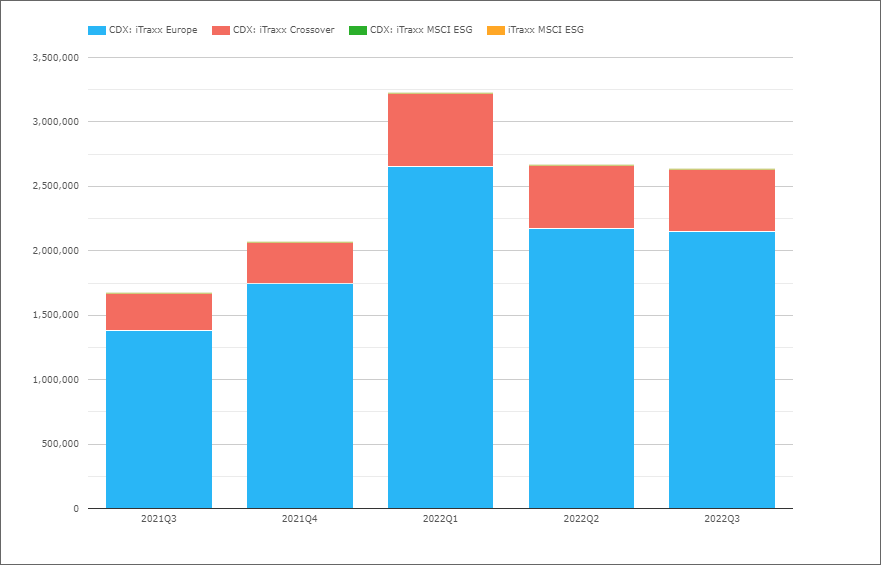
- iTraxx Europe 2022Q3 volume of €2.15 trillion, up 55% from €1.4 trillion in 2021Q3
- iTraxx Crossover 2022Q3 volume of €477 billion, up 65% from €289 billion in 2021Q3
- iTaxx MSCI ESG with no volume in the quarter
iTraxx Europe volumes in 2022Q3 representing 82% of EUR Index volumes.
Market Share of EUR iTraxx
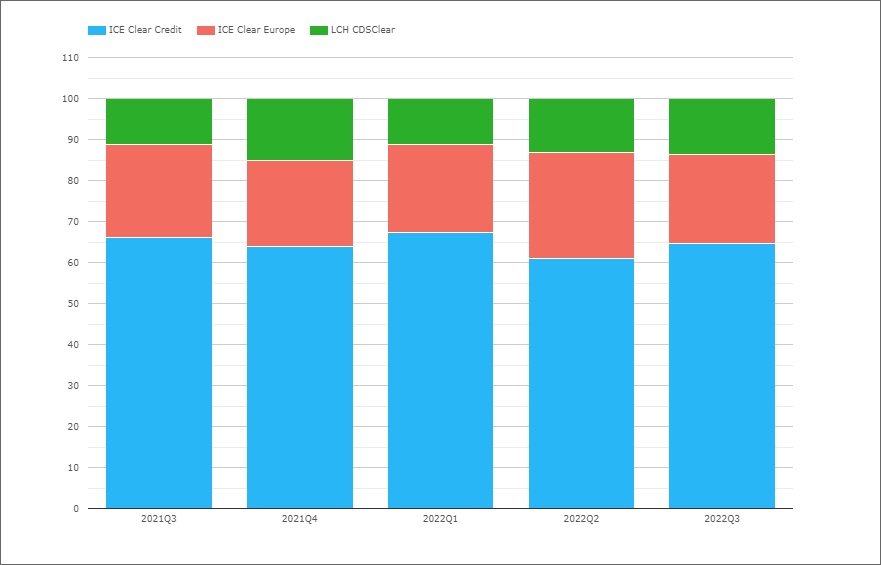
- ICE Clear Credit with 64.6% in 2022Q3, down from 66% in 2021Q3
- ICE Clear Europe with 21.8% in 2022Q3, down from 22.9% in 2021Q3
- LCH CDSClear with 13.5% in 2022Q3, up from 11.1% in 2021Q3
As recently reported, ICE will stop CDS clearing fom March 2023 in London based ICE Clear Europe and consolidate into Chicago based ICE Clear Credit. One to watch in subsequent quarters to see when volume moves and how much moves to ICE Clear Credit and how much to LCH CDSClear.
EUR Single-name CDS
- Single-name Corporate volume of €153 billion, up 80% from €85 billion in 2021Q3
- Single-name CPFinancial volume of €3.3 billion, same as in 2021Q3
Market Share of EUR Single-name CDS
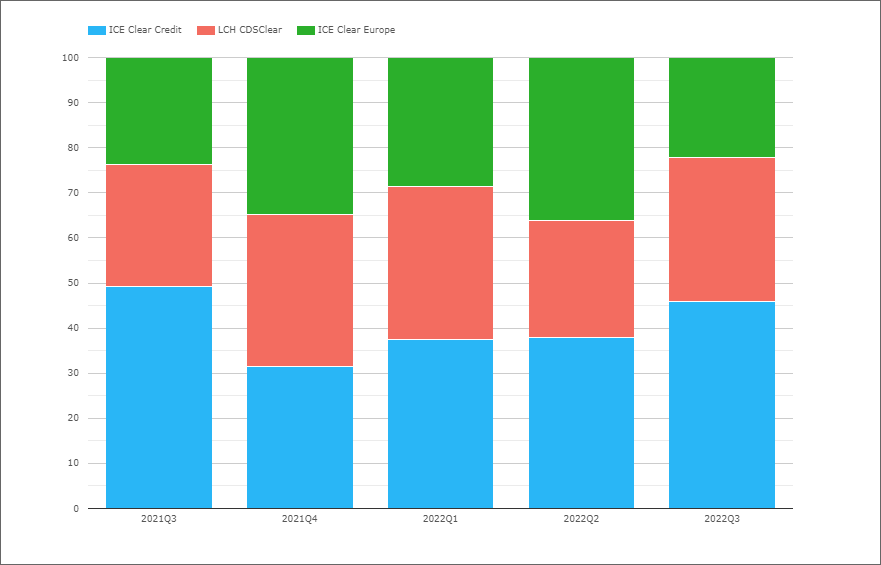
- ICE Clear Credit with 45.8% in 2022Q3, up from 37.9% in 2022Q2, down from 49.1% in 2021Q3
- ICE Clear Europe with 22.2% in 2022Q3, down from 36.1% in 2022Q2 and 23.8% in 2021Q3
- LCH CDSClear with 32% in 2022Q3, up from 26% in 2022Q2 and 27.1% in 2021Q3
ICE Cleare Europe down in the quarter, with both ICE Clear Credit and LCH CDSClear gaining.
EUR iTraxxSwaptions volume of €17.7 billion in 2022Q3, is from LCH CDSClear with €17.4 billion and for the second quarter volume at ICE Clear Credit with €293 million.
JPY CDX and CDS
And for our final chart, JPY CDX and CDS volumes.
- A lumpy chart to say the least
- JPY CDX volume in 2022Q3 was Y131 billion, up from Y78 billion in 2021Q3
- JPY CDS volume in 2022Q3 was Y71 billion, down from Y88 billion 2021Q3
- Overall volumes in the quarter at Y202 billion, up from a year earlier
- While Q2 and Q4 have much higher volumes
All the volume is at JSCC.
That’s It
11 charts to cover CRD.
There is a lot more data in CCPView.
Daily, weekly, monthly, quarterly or annual.
Volume, ADV, Open Interest, OI Change.
More granular data at name level.
Please contact us if you are interested in a subscription.