Clarus CCPView has daily volume and open interest data published by each CCP, which is filtered, normalised and aggregated to allow meaningful comparisons of volumes.
Today we look at 3Q23 volume and market share in IRD for:
- USD Swaps (SOFR, FF)
- EUR Swaps (EURIBOR, €STR)
- GBP Swaps (SONIA)
- JPY Swaps (TONA)
- AUD Swaps (BBSW, AONIA)
- CAD Swaps (CDOR, CORRA)
- EMEA Swaps
- AsiaPac Swaps
- LatAm Swaps
- Cross Currency Swaps
Onto the charts, data and details.
Volumes and Market Share
For major currencies and regions, vanilla swaps referencing IBORs and OIS Swaps referencing RFRs, using single-sided gross notional volume over a period; either a month, quarter or year.
USD OIS
Swaps referencing either Fed Funds or SOFR indices.
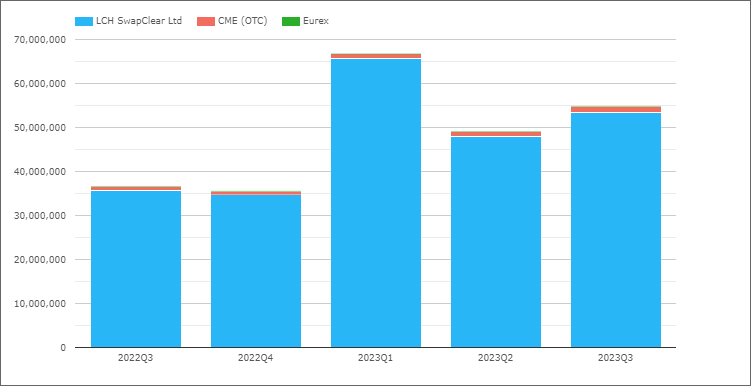
- 2023Q3 with $54.8 trillion is up 49%, compared to $36.7 trillion in 2022Q3
- Up from the $49.1 trillion 2023Q2 but Down from the high of $66.8 trillion in 2023Q1
- LCH SwapClear with $53.5 trillion in 2023Q3 and $35.6 trillion in 2022Q3
- CME OTC with $1.4 trillion in 2023Q3 and $1.1 trillion in 2022Q3
- 2023Q3 Share is LCH 97.5% and CME 2.5%, compared to 97.1% v 2.9% in 2022Q3
EUR Swaps (Euribor)
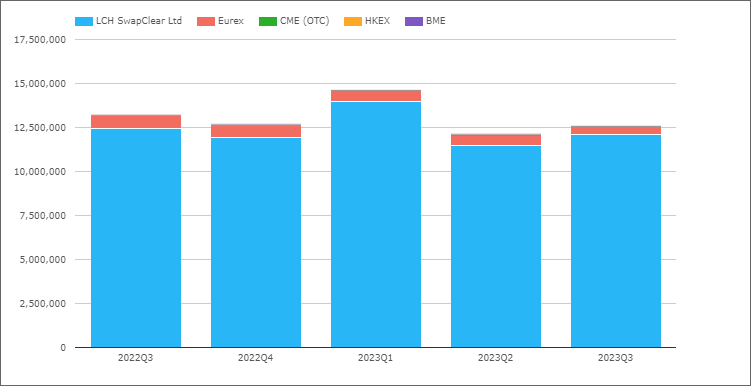
- 2023Q3 with €12.6 trillion is down 5% compared to €13.2 trillion in 2022Q3
- LCH SwapClear with €12.1 trillion in 2023Q3 and €12.4 trillion in 2022Q3
- Eurex with €0.46 trillion in 2023Q3 and €0.78 trillion in 2022Q3
- 2023Q3 market share is LCH 96.3%, Eurex 3.7%
- While 2022Q3 share was 94.1% and 5.9% respectively
EUR OIS
Referencing either EONIA or €STR, though in recent quarters all will be €STR.
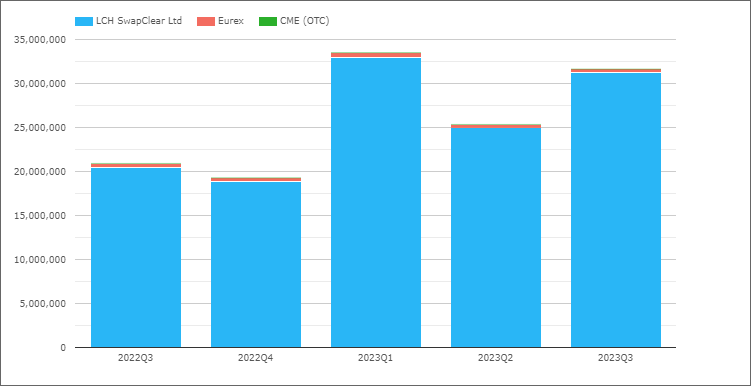
- 2023Q3 with €31.7 trillion is up 52%, compared to €20.9 trillion in 2022Q3
- LCH SwapClear with €31.3 trillion in 2023Q3 and €20.5 trillion in 2022Q3
- Eurex with €0.4 trillion in 2023Q3 and €0.44 trillion in 2022Q3
- 2023Q3 market share is LCH 98.7%, Eurex 1.3%
- While 2022Q3 share was 97.9% and 2.1% respectively
Combined share for EUR IRS and OIS, showing LCH SwapClear with 98% in 2023Q3 and Eurex with 1.9%, compared to the share in 2022Q3 of 96.4% and 3.6% respectively.
GBP OIS (SONIA)
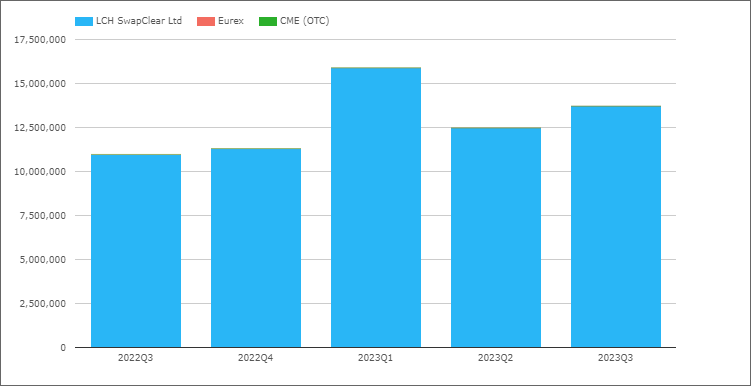
- 2023Q3 with £13.7 trillion is up 25% compared to £11 trillion in 2022Q3
- LCH SwapClear with 99.9% share
JPY OIS (TONA)
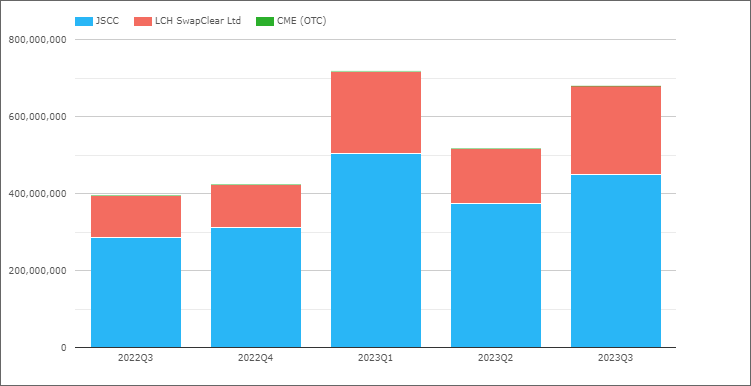
- 2023Q3 with Y680 trillion is up 72% compared to Y395 trillion in 2022Q3
- JSCC with Y450 trillion in 2023Q3, compared to Y286 trillion in 2022Q3
- LCH SwapClear with Y229 trillion in 2023Q3, compared to Y109 trillion in 2022Q3
- 2023Q3 Share is JSCC 66.2%, LCH 33.8%, compared to 72.3% and 27.6% in 2022Q3
AUD Swaps
Referencing either AONIA or BBSW, so both OIS and IRS.
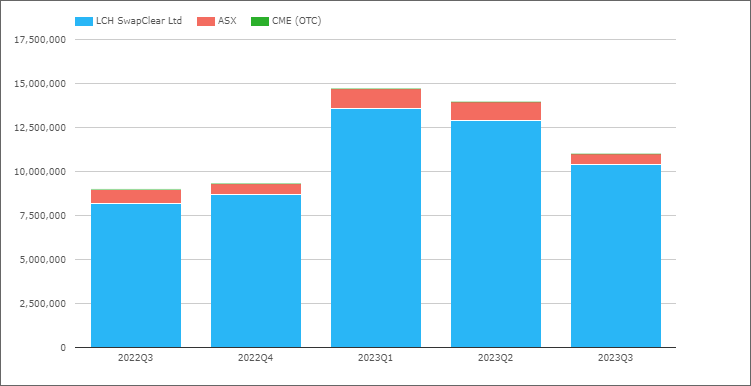
- 2023Q3 with A$11 trillion is up 22% compared to A$9 trillion in 2022Q3
- LCH SwapClear with A$10.4 trillion in 2023Q3 and A$8.2 trillion in 2022Q3
- ASX with A$0.6 trillion in 2023Q3 and A$0.79 trillion in 2022Q3
- 2023Q3 Share is LCH 94.5% and ASX 5.5%, compared to 91.3% and 8.7% in 2022Q3
CAD Swaps
Referencing either CORRA or CDOR, so both OIS and IRS.
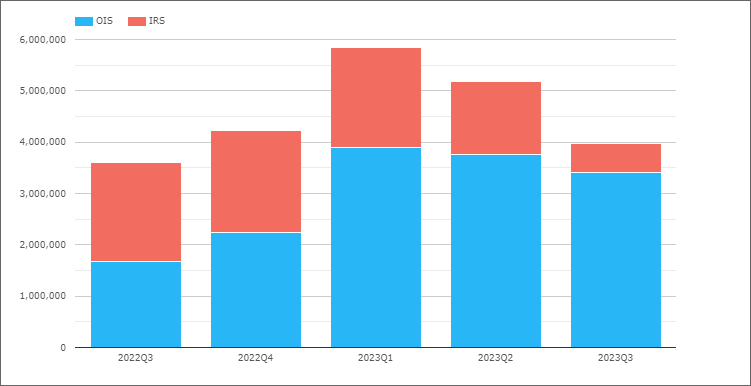
- 2023Q3 with C$4 trillion, compared to C$3.6 trillion in 2022Q3
- IRS down to C$555 billion from C$1.9 trillion, as the move to CORRA gathers pace
- LCH SwapClear with 99.9% of the volume
EMEA Swaps
Now let’s switch to EMEA Swaps (all types) and volumes by currency.
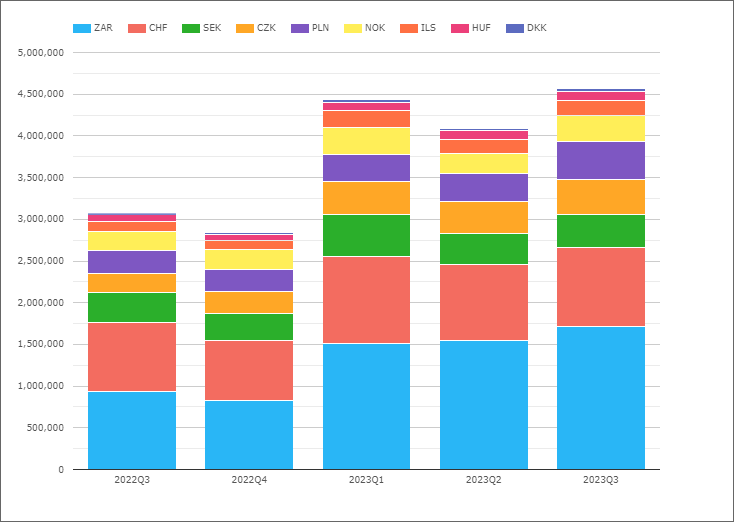
- 2023Q3 with $4.6 trillion is up 48% from $3.1 trillion in 2022Q3
- ZAR the largest in 2023Q3 with $1.7 trillion, up from $0.93 trillion in 2022Q3
- CHF next with $0.95 trillion, up from $0.82 trillion in 2022Q3
- PLN with $446 billion, up from $271 billion, is third when usually fifth in size
- CZK with $420 billion, up from $237 billion
- SEK with $399 billion, up from $360 billion
- NOK with $316 billion, up from $230 billion
- ILS with $180 billion, up from $120 billion
- HUF with $109 billion, up from $78 billion
- DKK with $33 billion, down from $21 billion
Volumes up in all currencies from a year earlier, in particular ZAR, PLN, CZK & NOK.
Not shown in the chart is market share by CCP, where LCH has >97.5% share for the whole period in every currency except for:
- PLN, LCH with 95.7%, KDPW 2.1%, CME 2.2%
- HUF, LCH with 95.6%, CME with 4.4%
AsiaPac Swaps
Now let’s switch to AsiaPac Swaps (all types) and volumes by currency.
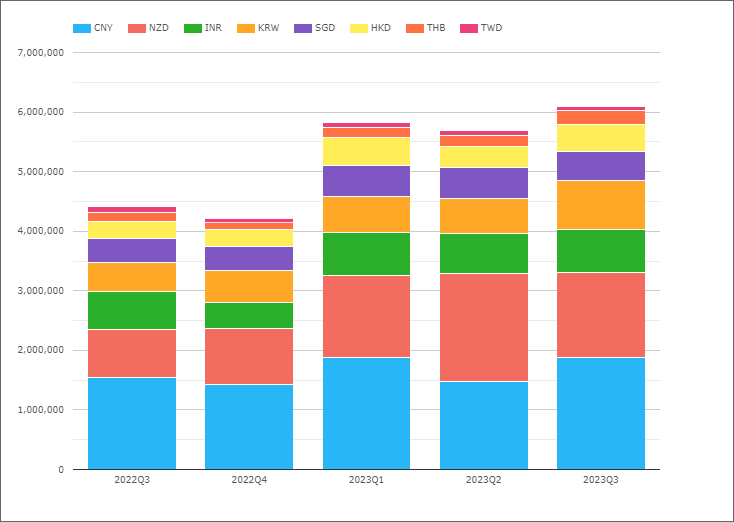
- 2023Q3 with $6.1 trillion is up 39% from the $4.4 trillon level in 2022Q3
- So materially larger than the $4.6 trillion for EMEA
- CNY the largest in 2023Q3 with $1.9 trillion, up from $1.54 trillion a year earlier
- NZD next with $1.4 trillion, up from $806 billion in 2022Q3
- KRW with $817 billion, down from $496 billion
- INR with $735 billion, up from $632 billion
- SGD with $481 billion, up from $391 billion
- HKD with $456 billion, up from $288 billion
- THB with $232 billion, up from $153 billion
- TWD with $75 billion, down from $100 billion
Except for TWD, every currency is higher than 2022Q3
Not shown in the chart is market share by CCP, where LCH has >99.7% share for the whole period in every currency except for:
- CNY, Shanghai with 62.7%, LCH with 37.1%, HKEX 0.2%
- INR, LCH with 65%, CCIL with 35%
- HKD, LCH with 98.2%, HKEX 1.4%, CME 0.4%
LatAm Swaps
Next lets look at LatAm Swaps.
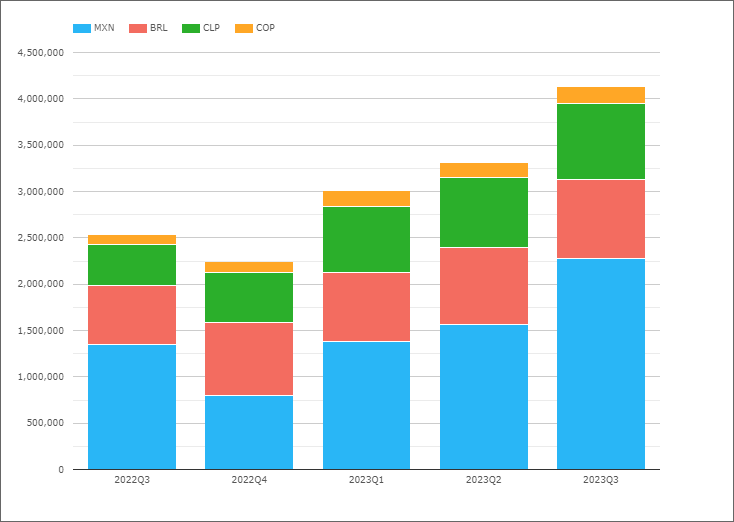
- 2023Q3 with $4.1 trillion is up 64% from $2.5 trillion in 2022Q3
- MXN the largest in 2023Q3 with $2.3 trillion, up from $1.35 trillion in 2022Q3
- BRL next with $855 billion, up from $629 billion
- CLP with $820 billion, up from $448 billion
- COP with $180 billion, up from $105 billion
Not shown in the chart is market share by CCP, where CME has > 98.5% except for:
- MXN, CME with 87.9%, Asigna/Mexder 10.1%, LCH 2%
Cross Currency Swaps
HKEX the only CCP with cleared Cross Currency Swap volumes.
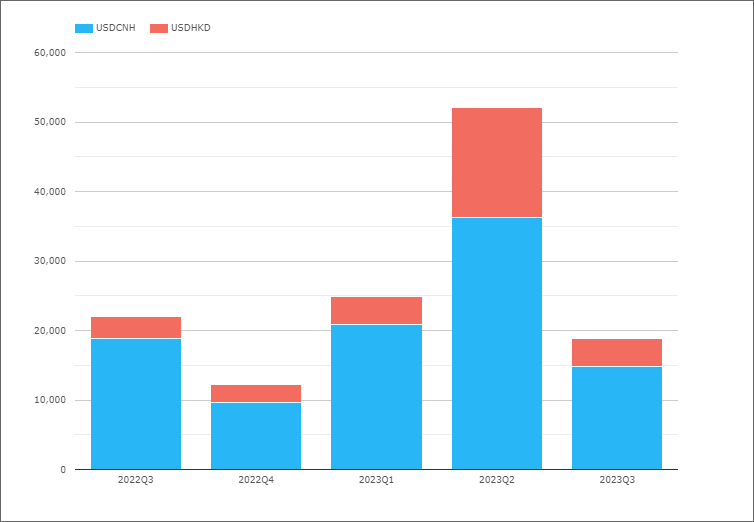
- 2023Q3 with $19 billion, down from the $22 billion in 2022Q3
- Most volume in USDCNH with $14.8 billion in the latest quarter
LCH SwapAgent does not clear XCCY Swaps, but offers processing, margining and settlement of bi-lateral trades for this product. Volumes are not available regularily, but we know from a LCH press release that SwapAgent registered record volumes of $2.7 trillion (double-sided) notional in 2022.
That’s It
11 Charts for an overview.
Still a lot more data to look at
Volume in DV01 terms and Open Interest by currency.
IR Futures in all the major currencies and US Treasury volumes.
Credit Derivatives and FX Derivatives. (Listen to the Podcast)
For more details, please contact us for a CCPView demonstration.