I last looked at Term SOFR and BSBY Volumes in May2023, so today I will look at the YTD 2023 data trends for these indices, and as before seperate Term SOFR (published by CME) from Average SOFR (NY Fed).
A one-sentence summary is that “Term SOFR Swap volumes are down, though still far higher than Average SOFR, while BSBY Swaps trading is coming to an end.”
Onto the charts and data.
Swap Volumes for Term SOFR
In SDRView, I can group USD FixedFloat Swaps by the Reference Index of the floating leg and export this data to create an Excel PivotChart, selecting only those that are Term SOFR. (Note: the long list of different names has now been cleaned up in the source data by reporting parties, which is good to see).
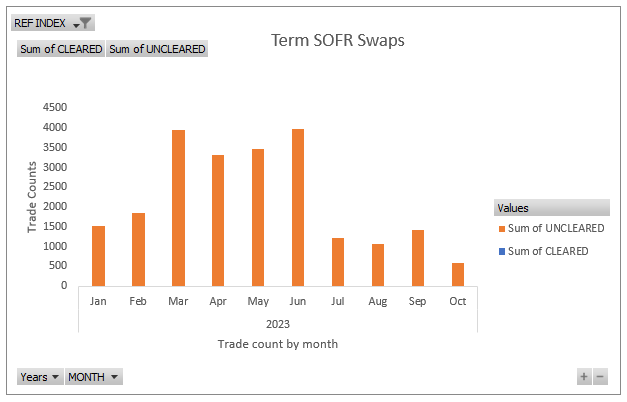
March, April, May and June each with > 3,000 trades, with a peak in June of close to 4,000.
Then a sharp drop:
- 1,226 trades in July
- 1,067 in August
- 1,411 in September
- 594 in October (up to the 20th).
Only 6 Cleared trades YTD out of a total of 22,400, the vast majority Uncleared.
So the trend we saw of higher volumes in Q2 has been replaced with lower volumes in Q3 and looking like continuing in Q4.
In gross notional terms, March was the peak with >$94 billion, while July, August and September each with just >$27 billion.
A mixed picture on Term SOFR Swap volumes.
Swap Volumes for Average SOFR
Let’s now repeat the above, but for the Average SOFR reference index.
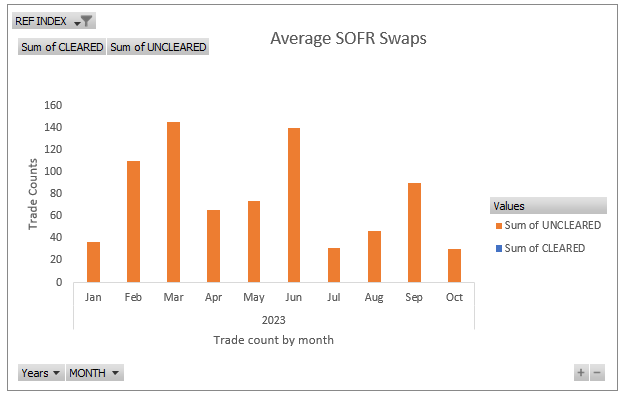
March with a high of 146 trades, June with 140, but then lower trade counts of 31, 47, 90 in the following 3 months with October (up to 20th) with only 30 trades.
In gross notional terms June with > $1.08 billion and September with $600 million, so far less than the Term SOFR volumes in the prior section.
Swap Volumes for BSBY
Let’s now repeat the above, but for reference indices that are BSBY.
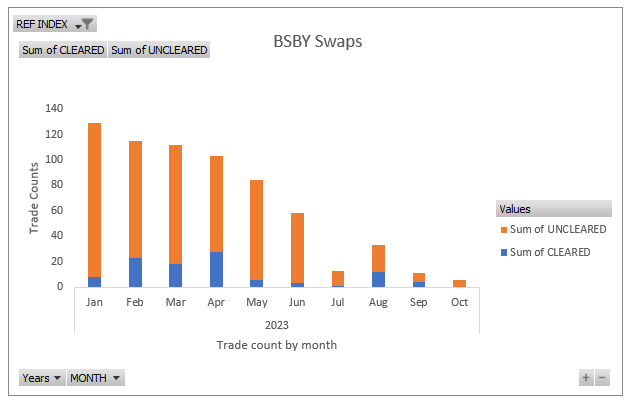
This time we see both Cleared and Uncleared trades, but low volumes and a sharp downward trend.
July with only 1 cleared trade and 12 uncleared, September with just 4 cleared trades and 7 uncleared, while October (up to the 20th) has no cleared trades at all.
Not surprising that on September 13th, Bloomberg announced a Consultation on the Proposed cessation of BSBY, which notes that market participants will be provided at least 12 months advnace notice on cessation. The consultation closed on October 13th, so we should shortly hear the feedback, which I expect will mean the end of the BSBY reference index.
Basis Swap Volumes – Term SOFR vs SOFR
Next Basis Swaps, primarily Term SOFR vs SOFR and a smaller number of Term SOFR vs Libor.
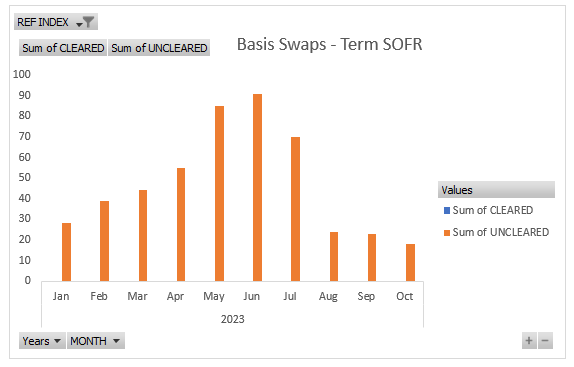
A peak of 91 trades in June, but August onwards only 20 or so trades per month and 18 so far in October.
CapFloor Volumes for Term SOFR
Finally let’s switch to CapsFloors that reference Term SOFR.
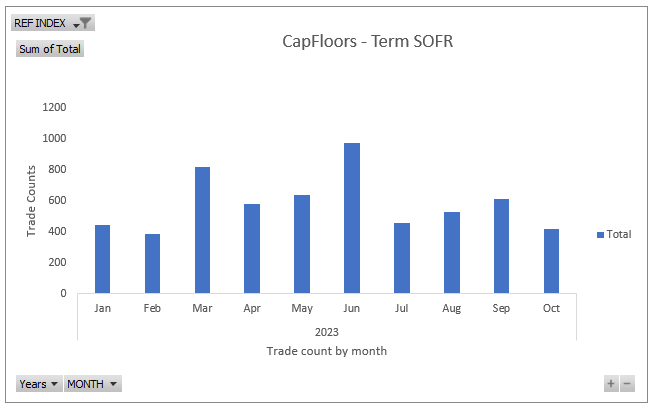
June with a high of 974 trades, while September has 613 and October (up to 20th) with 417 trades.
Gross notional (not shown) is in the $40 to $100 billion range each month, while September had $58 billion.
Average SOFR volumes (not shown) are between 25-90 trades a month ($1 to 3 billion a month).
CapsFloors on Overnight SOFR are between 300-500 trades a month ($100-$180 billion a month).
That’s all I have time for today.
If you are interested in this data, please contact us for an SDRView demo.
What will BSBY fallback to when it ceases? SOFR plus a spread I guess? The irony cannot be lost on our readers…..?
As Term SOFR isn’t currently clearable possibly any reported to the SDR as cleared are being misreported?
Good point, yes agreed.
Following Bloomberg’s November 15, 2023 announcement of the future cessation of BSBY, note that ISDA updated their guidance relating to the future cessation of BSBY here https://www.isda.org/a/vbqgE/Future-Cessation-of-the-Bloomberg-Short-Term-Bank-Yield-Index-Final.pdf