This blog looks at competition for trade volume in Q3 2025 between rates exchange-traded derivatives (ETD) exchanges and CCPs.
Key takeaways:
In Q3 2025, only two currency and product type combinations – EUR money-market (MM) futures and JPY MM futures – had material competition between CCPs.
- Comparing Q3 2025 with Q3 2024, Eurex took 7.0 percent of EUR MM futures from ICE and CME – helped by volumes shifting from Euribor to ESTR futures.
- Comparing Q3 2025 with Q2 2024, TFX gave up 12.1 percent of TONA futures to JPX which took 1.9 percent, and to a recent new entrant, SGX, which took 10.2 percent from a standing start.
- While CME continued to dominate USD MM and bond futures, FMX, a start-up futures exchange which began executing USD rates futures cleared at LCH in September 2024, reached a 0.25 percent share of USD SOFR futures in Q3 2025.
Read on for more details.
Competition overview
CCPView gives you exchange / CCP market shares across all currencies in a single query. I downloaded notional volumes and percentages to a spreadsheet to highlight the degree of competitiveness.
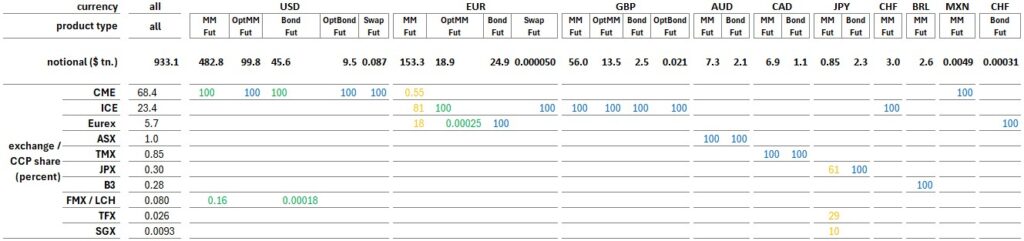
Table 1: rates ETD Q3 2025 trade volumes and CCP share by product type and currency (percentage of USD notional). Source: CCPView, author analysis.
Each column in Table 1 shows Q3 2025 USD notional volume and CCP shares for one combination of currency and product type. It shows that:
- Two combinations (highlighted orange) have more than one material CCP market share: EUR MM futures (MMFut) and JPY MM futures.
- Three combinations (highlighted green) have small non-zero shares at a second CCP: USD MM futures, USD bond futures (BondFut), and EUR options on MM futures (OptMMFut).
- Each other product type in USD, EUR and JPY, and each remaining whole currency is only cleared by one CCP (highlighted blue).
Our recent blog on derivatives innovation covered the challenge to CME USD rates ETD dominance presented by FMX futures exchange, which began executing USD MM (SOFR) and bond (T-bond) futures in September 2024. FMX futures clear at LCH (ETD) and can be portfolio margined with swaps cleared at LCH SwapClear. In Q3 2025, FMX/LCH SOFR futures reached 0.25 percent of all SOFR futures volumes, and 0.16 percent of USD MM futures overall, which also include FedFunds futures. We will update on progress in future editions of this blog.
The remainder of this blog focuses on EUR MM futures and options, and on JPY MM futures.
EUR MM futures and options
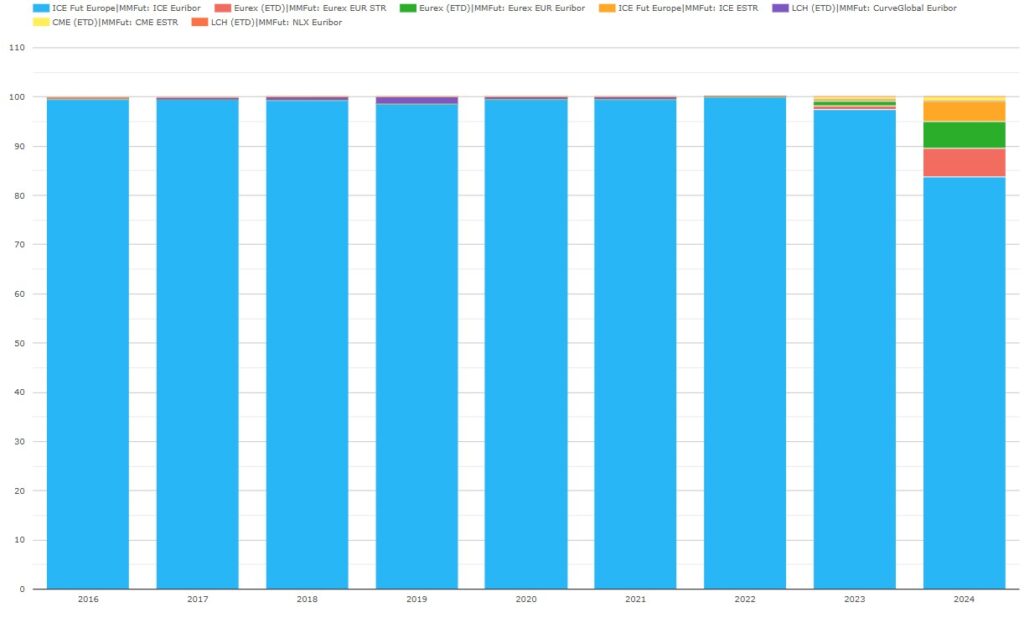
Chart 1: EUR MM futures volume share by CCP and product subtype (percentage of EUR notional). Source: CCPView.
Chart 1 shows that ICE Futures Europe in London (which was LIFFE before the ICE acquisition) dominated EUR MM futures from 2016 until 2022. The launch of ESTR futures in late 2022 heralded competition from CME and Eurex. To summarize the history:
- NLX (a NASDAQ Europe exchange clearing at LCH) reached a 0.2 percent share in 2016 before being retired in 2017.
- CurveGlobal (an LSEG exchange clearing at LCH) reached a 1.4 percent share in 2019 before stopping in 2022.
- ICE stayed above a 98.5 percent share during those two competitive challenges, but its share dropped to 97.7 percent in 2023, and 87.8 percent in 2024.
- Eurex had non-zero volume throughout the period, exceeded one percent for the first time with 1.7 percent in 2023, and reached 11.3 percent in 2024.
- CME was the first to execute and clear ESTR futures in October 2022, reaching a 0.8 percent share in 2024.
Now we look more closely at EUR MM futures from 2023 onwards.
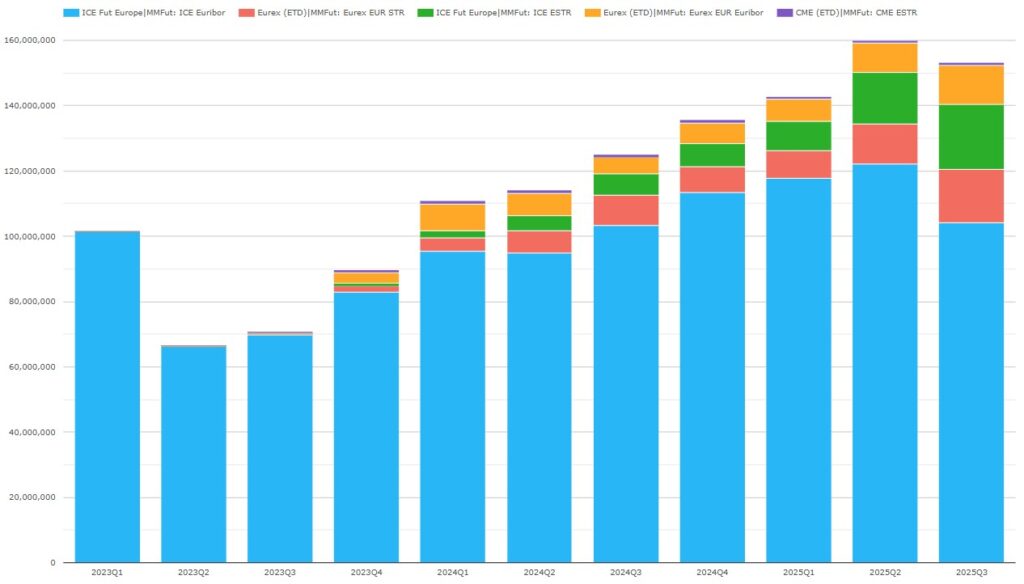
Chart 2: EUR MM futures volumes by CCP and product subtype (EUR notional millions). Source: CCPView.
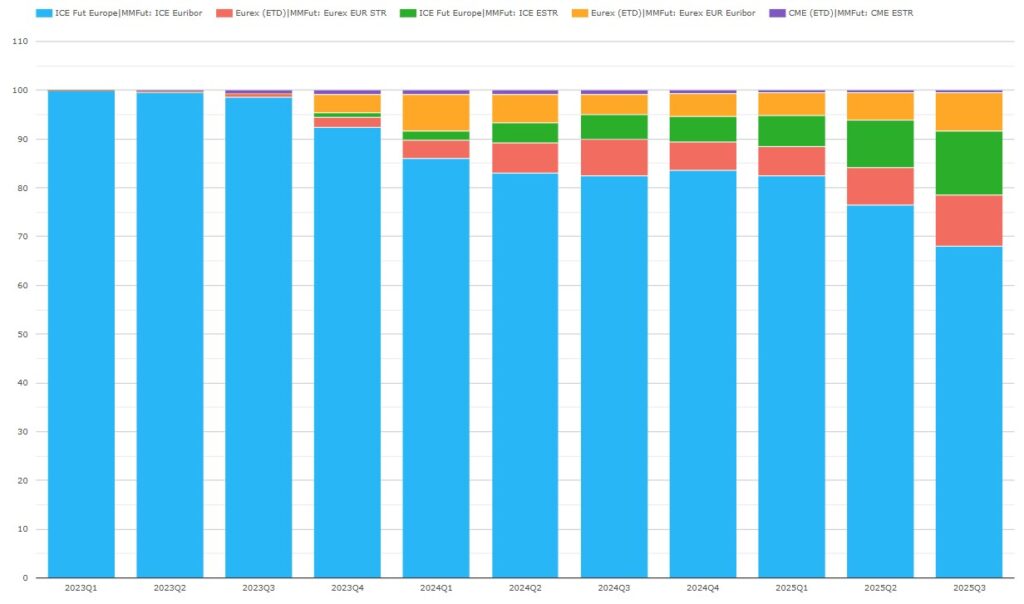
Chart 3: EUR MM futures volume share by CCP and product subtype (percentage of EUR notional). Source: CCPView.
Charts 2 and 3 illustrate the impact of the introduction of ESTR futures in 2022 and 2023 on the competitive landscape, while EUR MM quarterly volumes roughly doubled.
- The three exchanges initially cleared ESTR futures in October 2022 (CME), January 2023 (Eurex), and October 2023 (ICE).
- During 2024, ESTR futures was a close two-horse race between Eurex (red) and ICE (green). Eurex led ICE by two percent for most of 2024, but the lead came down to 0.7 percent in Q4 2024.
- In Q3 2025, Euribor futures was the highest-volume product with 75.8 percent of EUR MM futures volumes – down YoY from 86.6 percent. ICE (blue) led with 68.0 percent – down YoY from 82.5 percent from Q3 2024, while Eurex Euribor (orange) had 7.8 percent – up YoY from 4.1 percent.
- In Q3 2025, ESTR futures were 24.2 percent of EUR MM futures volumes – up YoY from 13.4 percent. ICE (green) led with 13.0 percent – up YoY from 5.2 percent, while Eurex (red) had 10.6 percent – up YoY from 7.4 percent.
- ICE’s Q3 2025 share of EUR MM futures volumes overall was 81.0 percent – down YoY from 87.7 percent.
- Eurex’s Q3 2025 share of EUR MM futures volumes overall was 18.5 percent – up YoY from 11.5 percent.
- CME’s Q3 2025 share of EUR MM futures volumes was 0.55 percent (all ESTR) – down YoY from 0.82 percent, after peaking at 0.94 percent in Q4 2023.
Overall, Eurex took 7.0 percent of EUR MM futures volumes from ICE and CME – helped by volumes shifting from Euribor to ESTR futures.
To briefly cover EUR options on MM futures, we examine the Eurex activity comprising the 0.00025 percent share in Table 1.
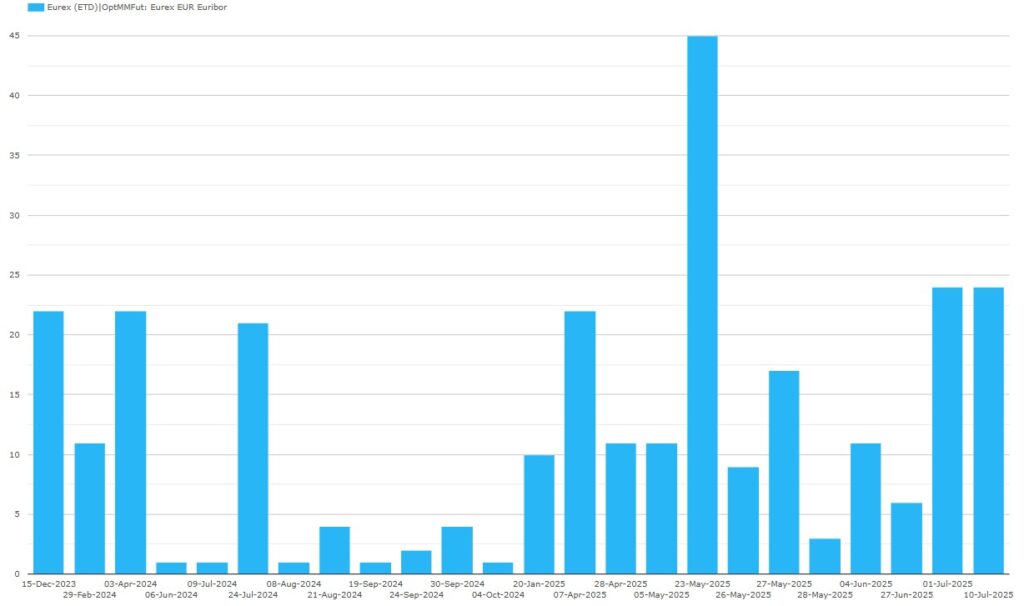
Chart 4: day-by-day volumes of Eurex options on Euribor futures until end November 2025 (USD notional millions). Source: CCPView.
Note that Chart 4 shows only days with non-zero Eurex volume in options on Euribor futures, of which there were 24 from 15 December 2023 to 10 July 2025. In Q3 2025, its 0.00025 percent share shown in Table 1 was made up of activity on two days – 1 and 10 July, totaling $47 million notional.
We will see the full year 2025 market shares of EUR MM futures and options in the next edition of this blog.
JPY MM futures
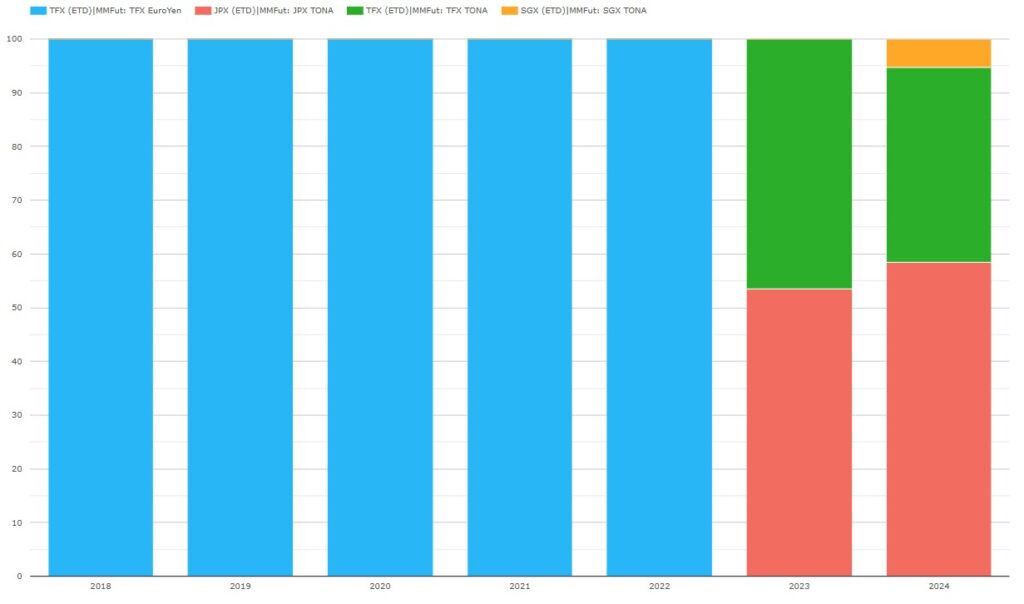
Chart 5: JPY MM futures volume share by CCP and product subtype (percentage of JPY notional). Source: CCPView.
Chart 5 shows the shift from EuroYen futures to TONA futures after JPY LIBOR cessation at the end of 2021.
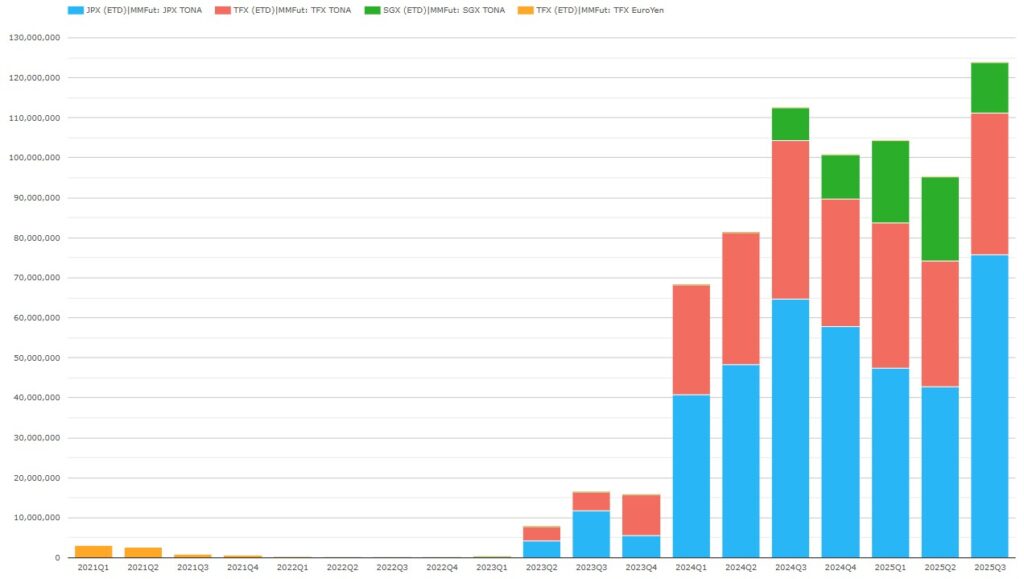
Chart 6: JPY MM futures volumes by CCP and product subtype (million JPY notional). Source: CCPView.
Chart 6 shows the dramatic effect on JPY MM futures of the JPY LIBOR cessation at the end of 2021.
- After JPY LIBOR cessation at the end of 2021, TFX EuroYen (JPY LIBOR) futures continued with very small volumes for another year or so. This would have required manual workaround procedures by TFX and clearing participants to overcome the lack of daily LIBOR rates.
- The introduction of TONA MM futures, about 14 months after LIBOR cessation, led to volumes of JPY MM futures out of all proportion to those for EuroYen futures before LIBOR transition. This suggests that TONA futures play a more important market role today than EuroYen futures did in the past.
- JPX began executing and clearing TONA futures in May 2023, and SGX began in July 2024.
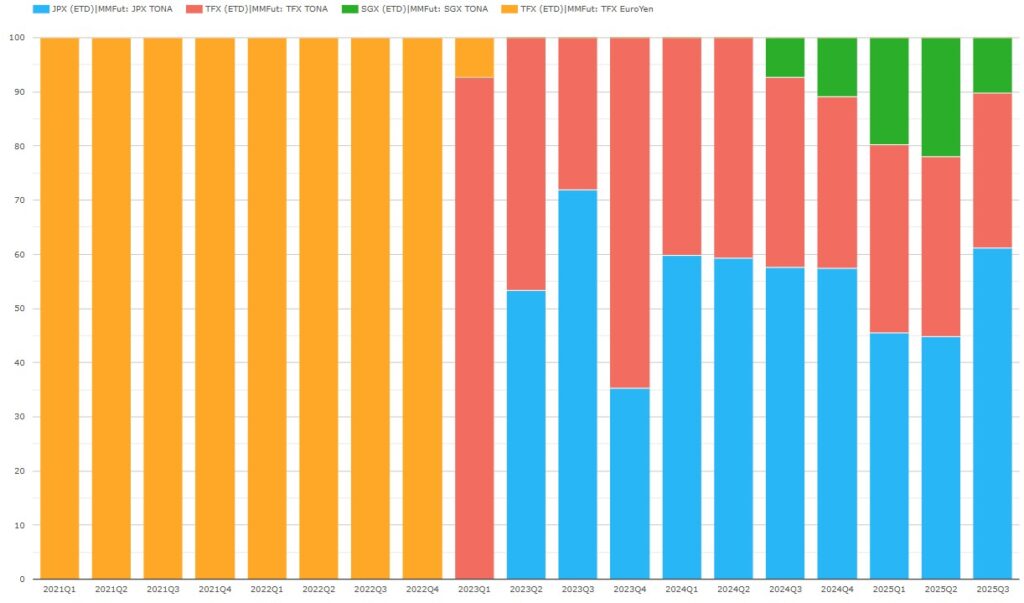
Chart 7: JPY MM futures volume share by CCP and product subtype (percentage of JPY notional). Source: CCPView.
Chart 7 shows that TONA futures are much more competitive than EuroYen futures were before LIBOR transition. Note that volumes in 2022 and Q1 2023 were negligible so market shares were meaningless in that period. We compare Q3 2025 shares with Q2 2024 – the last quarter before SGX started clearing.
- In Q3 2025, JPX led with a 61.2 percent share – up from 59.2 percent in Q2 2024, recouping its market share losses in Q1 and Q2 2025.
- TFX’s share was 28.7 percent – down YoY from 40.7 percent, after its share peaked at 64.7 percent in Q4 2023.
- SGX’s Q3 2025 share was 10.2 percent – up from zero, after peaking at 22.0 percent in Q2 2025.
In our recent blog, we were impressed with the TONA futures shares achieved by SGX, based in Singapore, from a standing start in Q3 2024.
We will see whether TONA futures market shares settle over the coming quarters.
That’s it
Flip back to the top to recap the takeaways.
The volumes in CCPView cover many more cleared instruments, metrics, and analysis parameters.
- Cleared instruments also include interest rate futures and options, other asset class futures and options, and cash US Treasuries.
- Volume metrics also include new trade count / DV01 / average daily volume (ADV), open interest (OI), OI change, and notional unwound/matured.
- Analysis parameters also include date / week / month / year, exchange, product subtype, tenor, and activity type (D2C or D2D trade).
For more details, please contact us for a CCPView demonstration.