In our quarterly blogs on cleared rates swap volumes, we review CCP market shares across all currencies. However, only a few currencies show meaningful competition between clearinghouses. This blog focuses on the competitive dynamic in those competitive currencies.
Key takeaways:
In Q3 2025, only four currencies – EUR, JPY, CNY, and INR had more than one CCP with over 6 percent market share of that currency’s cleared rates swaps activity.
Comparing Q3 2025 market shares with Q3 2024:
- Eurex took 5.1 percent of EUR from LCH SwapClear – helped by the June 2025 go-live of ESMA’s Active Account Requirement (AAR).
- LCH SwapClear took 5.6 percent of JPY from JSCC – helped by a surge in US buy-side interest in JPY swaps.
- Shanghai Clearinghouse (SHCH) took 13.5 percent of CNY from LCH SwapClear – helped by the September 2024 go-live of SwapConnect in partnership with HKEx.
- LCH SwapClear took 1.1 percent of cleared INR from CCIL, after losing 6 or 7 percent YoY in Q1 and Q2 2025. India’s Uncleared Margin Rules (UMR), which went live 1 April 2025, may lead to a consistent future shift in market share to CCIL.
Read on for more details.
Cleared swaps competitiveness
CCPView can give you a guide on this with a single query. To highlight competitiveness more clearly, I downloaded, sorted, and reformatted the percentages it produced as follows.
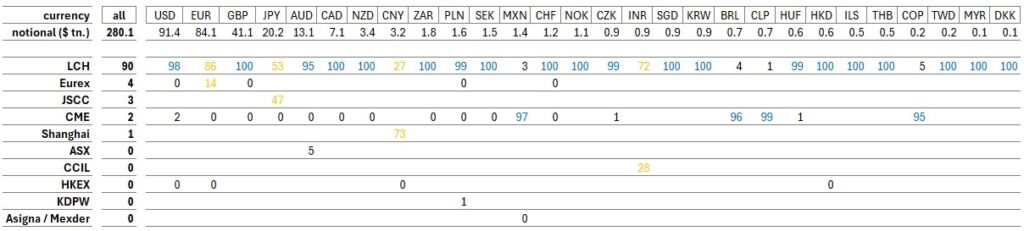
Table 1: cleared OTC IRD Q3 2025 volumes and CCP share by currency (percentage of USD notional). Source: CCPView.
Note that zeros indicate non-zero amounts below 0.5. Table 1 shows that:
- LCH (SwapClear) dominates (in blue) USD, GBP, AUD, CAD, and 16 other currencies.
- CME dominates (in blue) MXN, BRL, CLP, and COP.
- Four currencies show serious competition (in yellow) – EUR, JPY, CNY, and INR. We explore these four currencies below.
Cleared EUR swaps
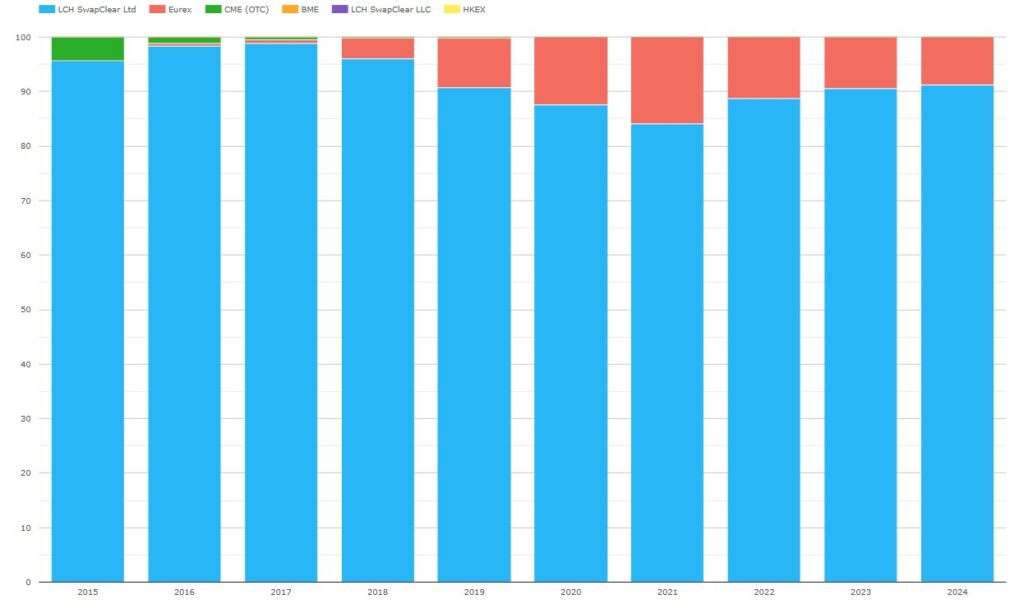
Chart 1: EUR swaps CCP share (percentage of EUR notional). Source: CCPView.
Chart 1 shows over the long-range that Eurex reached a 3.8 percent share in 2018, peaked at 15.8 percent in 2021, and declined to 8.8 percent in 2024.
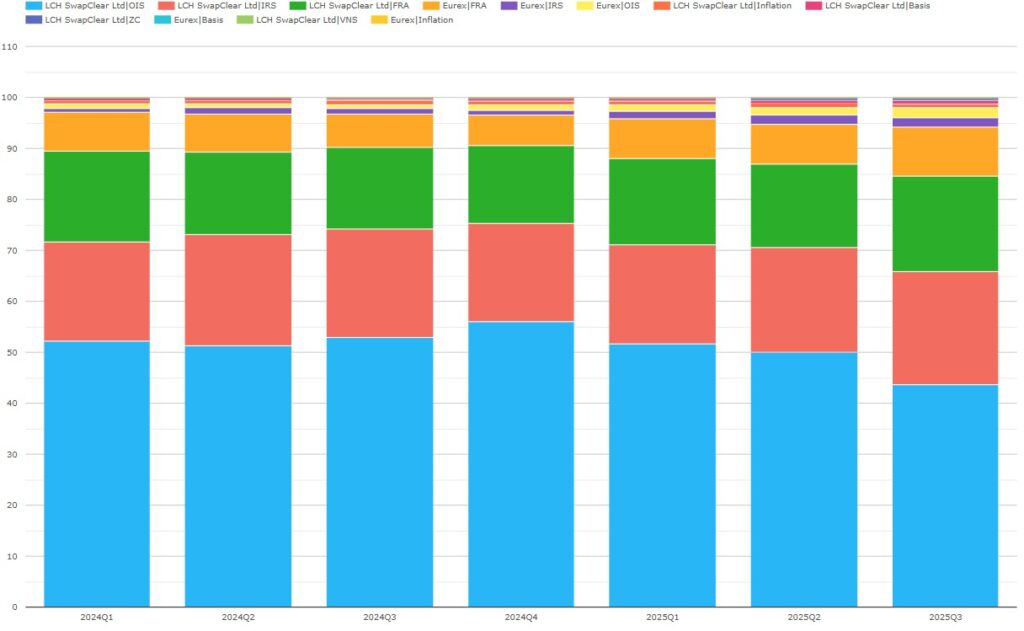
Chart 2: EUR swaps CCP and product share between LCH SwapClear and Eurex (percentage of EUR notional). Source: CCPView.
Chart 2 shows volumes in Q3 2025 at both CCPs were 98 percent OIS, IRS (fixed-float swaps), and FRA combined.
- Eurex increased share in Q3 2025 to 13.5 percent – up YoY from 8.4 percent. This comprised FRAs of 9.5 percent – up from 6.4 percent, OIS of 2.0 percent – up from 1.1 percent, and IRS of 1.9 percent – up from 0.8 percent.
- LCH SwapClear decreased share YoY to 86.5 percent – down from 91.6 percent. This comprised OIS of 43.6 percent – down from 52.9 percent, IRS of 22.3 percent – up from 21.3 percent, and LCH FRAs of 18.7 percent – up from 16.1 percent.
I have been curious to see how EUR swap CCP shares would be impacted by the ESMA Active Account Requirement (AAR), which went live on 24 June 2025 (see our February blog for more context). My takeaway from that blog was that a large bank needs to clear onshore (effectively, at Eurex) a minimum of three hundred trades per year each of EUR OIS, EUR FRA, and EUR IRS.
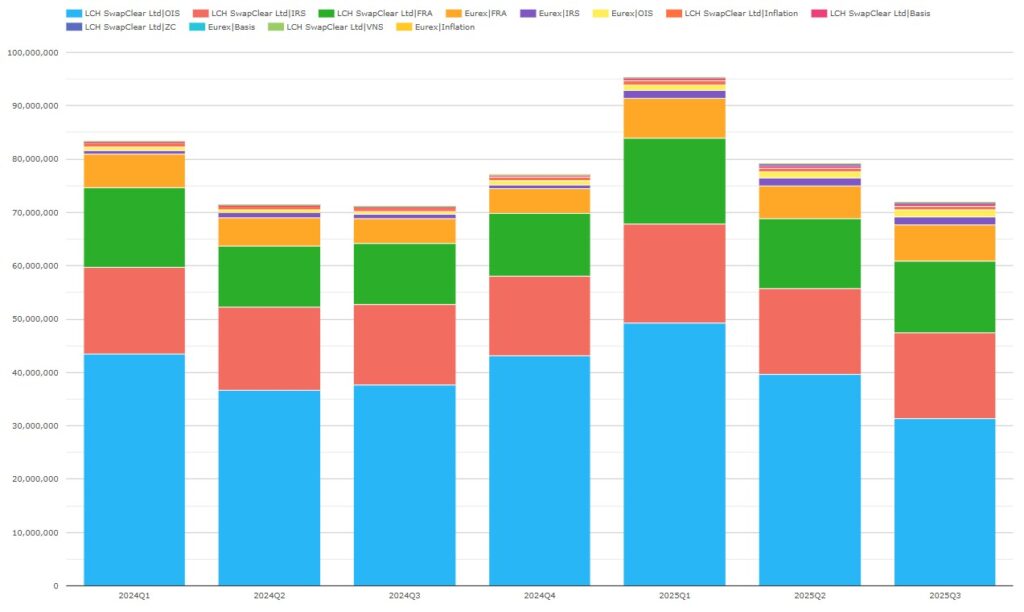
Chart 3: EUR swaps volumes at LCH SwapClear and Eurex by CCP and product (notional EUR millions). Source: CCPView.
Chart 3 shows Q3 2025 EUR swap volumes were flat YoY.
- For OIS, we see that Eurex volumes were similar in each quarter of 2025 – Q1 €1.12 trillion, Q2 €1.22 trillion, Q3 €1.40 trillion, while LCH volumes moved around much more between the quarters. Eurex OIS even remained steady QoQ when total cleared OIS dropped significantly at LCH. This suggests participants direct a minimum volume of EUR OIS to Eurex.
- For IRS, we see that Eurex IRS volumes were similar in each quarter of 2025 – Q1 €1.39 trillion, Q2 €1.35 trillion, Q3 €1.41 trillion, while LCH volumes moved around much more between the quarters. This suggests participants direct a minimum volume of EUR IRS to Eurex.
- For FRA we see that volumes varied quite a bit in 2025 at both CCPs. Eurex did remain consistent in its share of FRAs (not shown in the chart) – Q1 32 percent, Q2 32 percent, Q3 34 percent, while Q3 2024 was 29 percent. This suggests that participants directed OSTTRA Reset to send more of their EUR FRAs to Eurex.
All these observations a consistent with changes in participant behavior to meet AAR – likely a major contributor to the shift to Eurex.
Cleared JPY swaps

Chart 4: JPY swaps CCP share (percentage of JPY notional). Source: CCPView.
Chart 4 shows that JPY swaps clearing has been competitive since before CCPView records began. JSCC had grown its share from 41 percent in 2015 to 72 percent in 2022, but since fell back to 55 percent in 2024.
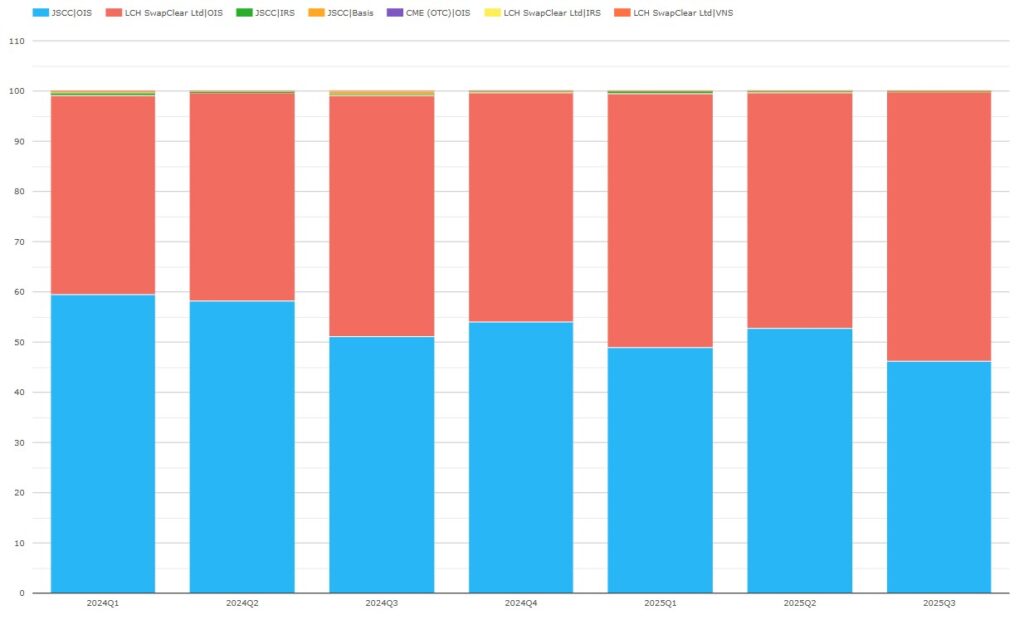
Chart 5: JPY swaps CCP and product share (percentage of JPY notional). Source: CCPView.
Chart 5 shows that, in Q3 2025, LCH SwapClear had a 53.6 percent share – up YoY from 48.0 percent.
We dug into JPY swap CCP shares in our September blog What’s new in JPY in 2025?. The blog noted that LCH share increases arose from disproportionate increases in short tenor trading, and from increasing buy-side interest in JPY swaps, particularly in the US.
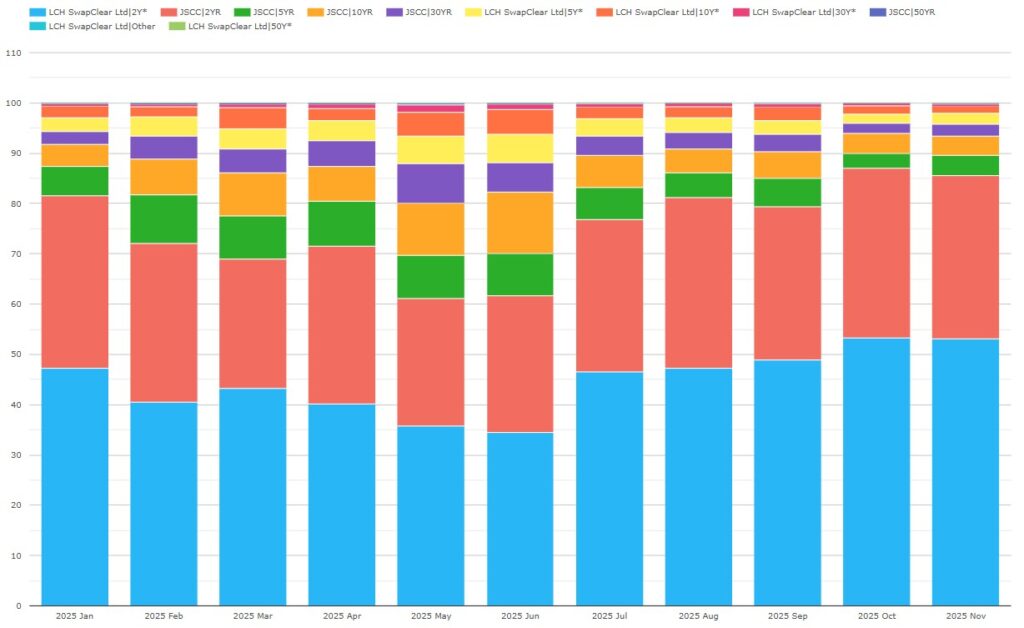
Chart 6: JPY OIS by CCP and tenor (percentage of JPY notional). Source: CCPView.
Chart 6 shows that OIS tenor shares continued to move towards two-years (2Y) at both LCH and JSCC from July to November. LCH 2Y swaps share moved from 46.5 to 53.0 percent, while JSCC 2Y swaps share moved from 30.3 to 32.5 percent.
We note that JSCC recently signed up Millennium as its first US buy-side client clearing participant. JSCC will be hoping to expand its share of future buy-side clearing volume.
Overall, it looks like 2025 full year shares will break to a majority for LCH.
Cleared CNY swaps

Chart 7: CNY swaps CCP share (percentage of CNY notional). Source: CCPView.
Chart 7 shows that Shanghai Clearing (SHCH) was the original clearer of onshore deliverable CNY Swaps. LCH SwapClear got into CNY non-deliverable swap clearing in 2018. It has held about a 40 percent share of cleared INR swaps since 2020.
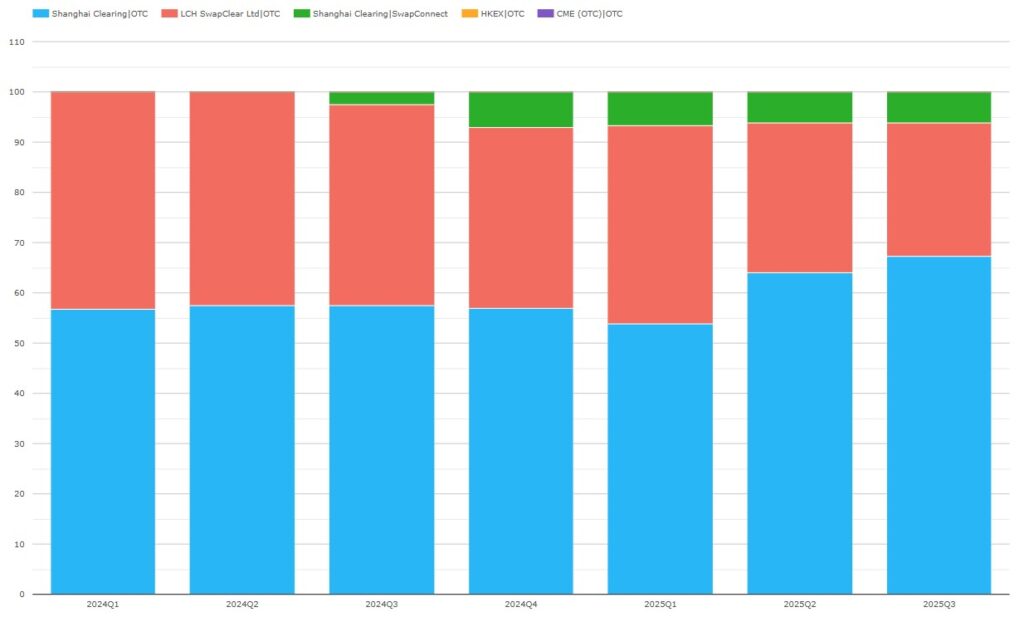
Chart 8: CNY swaps share by CCP and exchange (percentage of CNY notional). Source: CCPView.
Note that CCPView now includes SwapConnect volumes, which are broken out as a separate exchange within SHCH. SwapConnect enables an offshore party to trade deliverable CNY swaps on CFETS which clear at SHCH. HKEx’s OTCClear intermediates the side of a SwapConnect trade between the offshore party and SHCH, obviating the need for the offshore party to have a clearing account at SHCH.
Chart 8 shows that:
- SwapConnect CNY swaps activity began in Q3 2024 – subsequently contributing 6 to 7 percent of CNY swaps share in each of the last four quarters.
- SHCH’s combined CNY swaps share, including SwapConnect activity, was 73.3 percent for Q3 2025 – up YoY from 59.8 percent.
It looks like 2025 SHCH full year shares will be higher than those in 2024.
Cleared INR swaps
As background, I recommend our December 2024 blog – What’s new in INR Swaps?, and its accompanying podcast. The takeaways include:
- CCIL (The Clearing Corporation of India Limited), in Mumbai clears onshore deliverable INR swaps settling in INR.
- LCH SwapClear clears offshore non-deliverable INR swaps settling in USD.
- SDR-reported INR swaps were 97 percent non-deliverable based on only 3 percent of a sample showing INR as settlement currency.
- SDR-reported INR swaps were 90 percent cleared near the end of 2024. This may be due to SIMM IM and LCH IM cross-currency offsets.
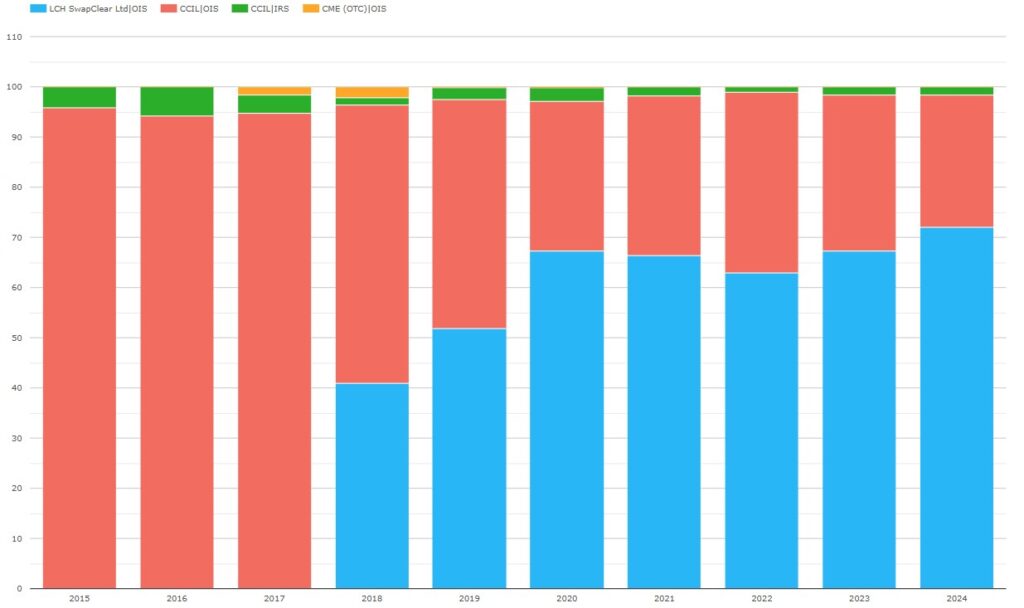
Chart 9: cleared INR swaps CCP share (percentage of INR notional). Source: CCPView.
Chart 9 illustrates that CCIL, in Mumbai, was the original CCP for Indian Rupee (INR) swaps. LCH SwapClear started clearing in 2018 with a 41 percent share, reached 67 percent in 2020, and fluctuated around that level since, taking 72 percent in 2024.
Market shares alone do not tell the growth story.
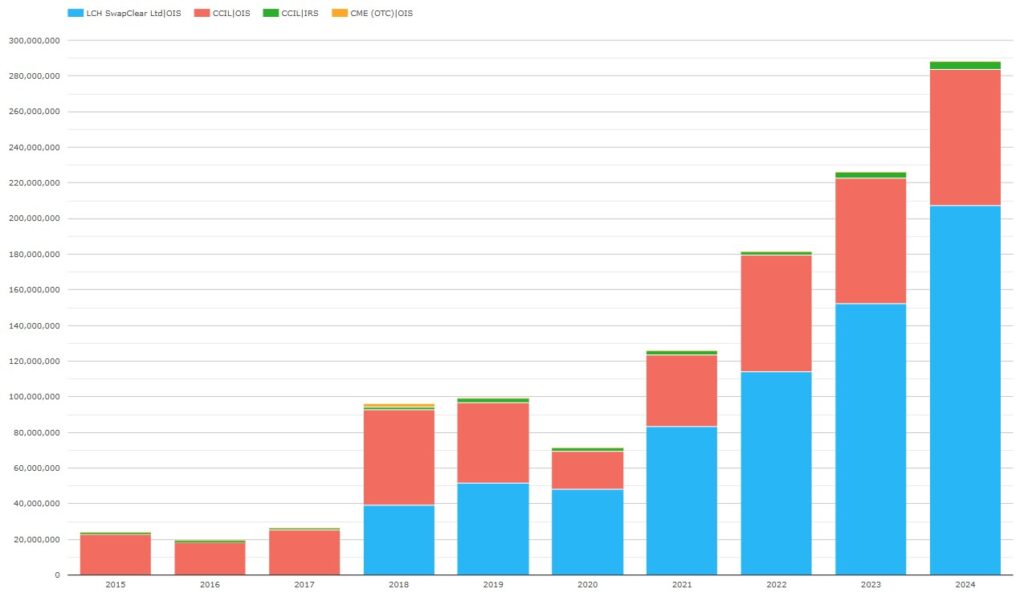
Chart 10: cleared INR swaps volume by CCP and product type (INR notional millions). Source: CCPView.
Chart 10 shows that CCIL-cleared deliverable INR swaps were INR 23.9 trillion in 2015. They then grew more than threefold to INR 80.8 trillion in 2024. LCH-cleared non-deliverable INR swaps began with INR 39.4 trillion in 2018. They then grew more than fivefold to INR 207 trillion (about $2.3 trillion) in 2024.
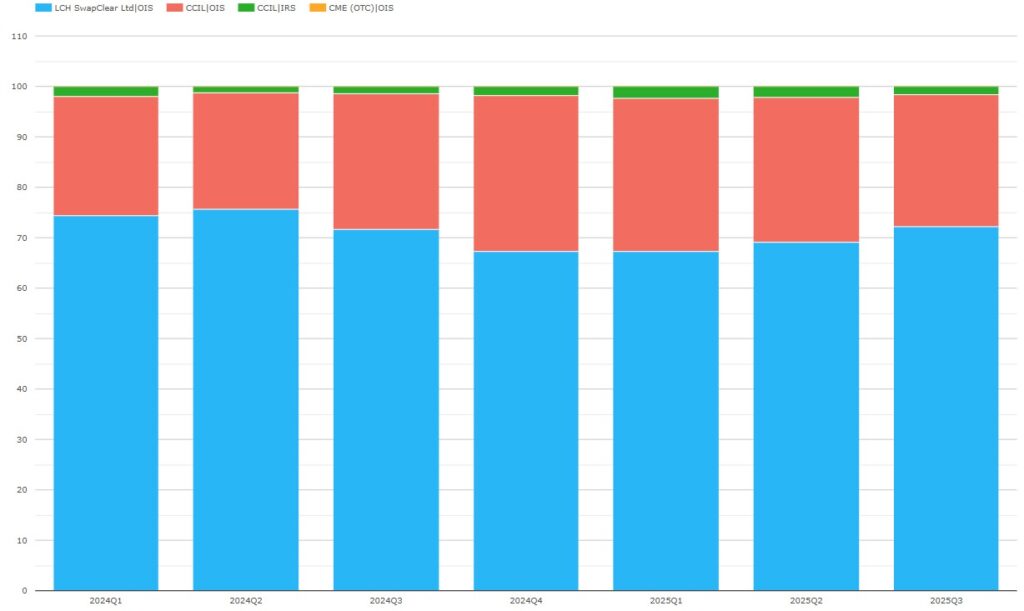
Chart 11: cleared INR swaps share by CCP and product type (percentage of INR notional). Source: CCPView.
Chart 11 shows that LCH INR swap clearing shares in the first two quarters of 2025 were 6 or 7 percent below the corresponding quarters of 2024. Q3 2025 however saw its share on par with that in Q3 2024.
India’s UMR went live 1 April 2025. We will need more quarters of volumes to solidly infer a consistent shift in market share to CCIL driven by onshore SIMM IM incentives.
LCH’s full-year 2025 share looks like being a couple of points down from 2024.
That’s it
Flip back to the top to recap the takeaways.
The volumes in CCPView cover many more cleared instruments, metrics, and analysis parameters.
- Cleared instruments also include interest rate futures and options, other asset class futures and options, and cash US Treasuries.
- Volume metrics also include new trade count / DV01 / average daily volume (ADV), open interest (OI), OI change, and notional unwound/matured.
- Analysis parameters also include date / week / month / year, exchange, product subtype, tenor, and activity type (D2C or D2D trade).
For more details, please contact us for a CCPView demonstration.