Week 6 of SEF trading is completed and we have some interesting statistics in this weeks edition.
LETS GET STARTED
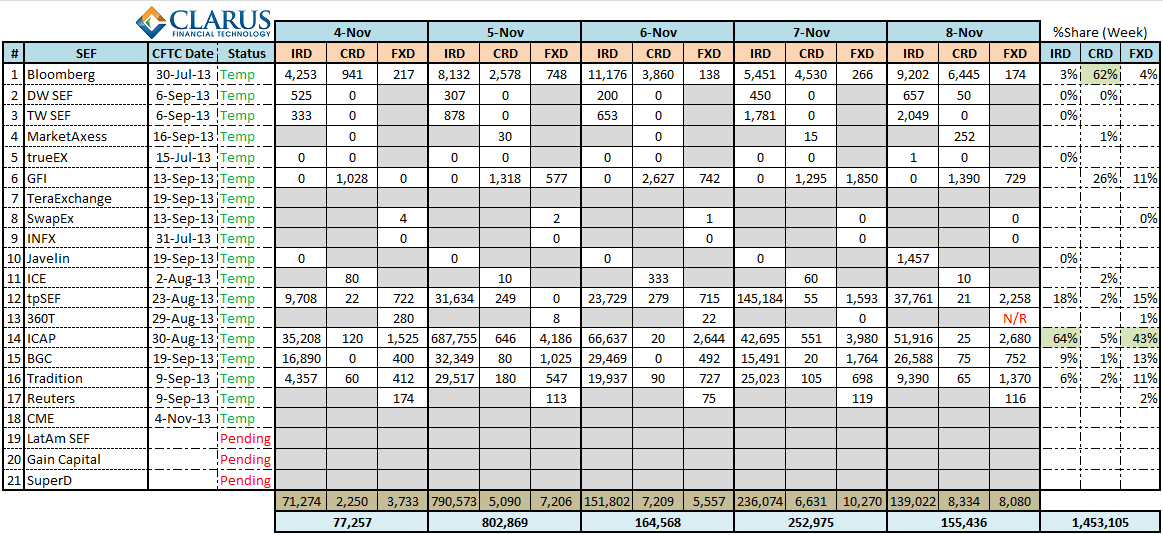
First, the headline numbers across the board. Remember everything I’ve quoted is in 1mm USD equivalents:
EX MARKS THE SPOT
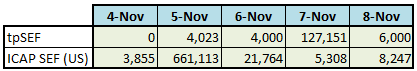
Similar to most weeks, there is quite a lot of activity in FRA’s. Assuming like we did last week that much of the FRA activity revolves around TPMatch and RESET, lets aim to remove that from the data. Daily activity in TP and ICAP for FRAs:
Removing these, we have a cleansed activity report (note that this removes over half of the volume!) :
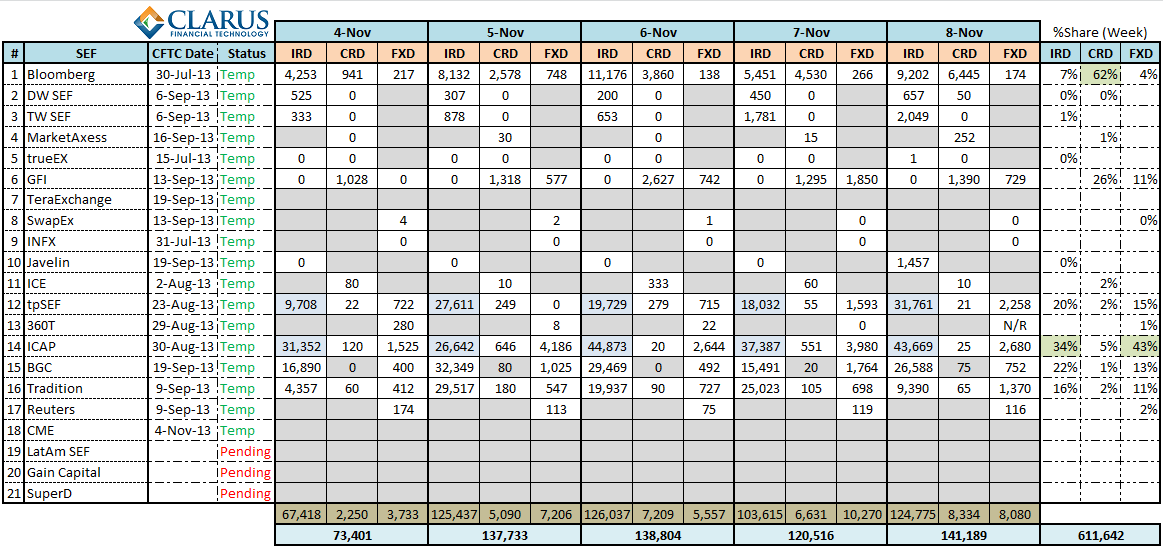
We’re seeing the same trend continue. In the dealer space, ICAP leading the field in rates and FX, and GFI the primary IDB in credit. In the client space, Bloomberg holding all 3 categories.
NOW A WORD FROM OUR SPONSOR
You’ll notice on the top-right of this webpage there is a link about “CHARM“. CHARM is our new product we launched that serves the clearing community. CHARM calculates intraday margins for clients, and we have packaged this as a solution for FCM’s and other utilities to use in order to provide clients the full use of their credit line. Check it out. In particular, if you email or call me, I’ll be giving you a CHARM quiz first!
Now back to your regularly scheduled program…
NO NO-ACTION (DOES THAT MEAN ACTION?)
November 1 marked the expiration of the no-action relief given to clients to utilize a SEF without the appropriate paperwork & onboarding having taken place. So this week commenced the first full week of SEF activity comprised of only fully on-boarded participants. Would this mean that we’d see a drop-off in activity? Lets look at the data.
The table below shows total USD activity (ex-FRA) between the two weeks, and the relative change in activity:
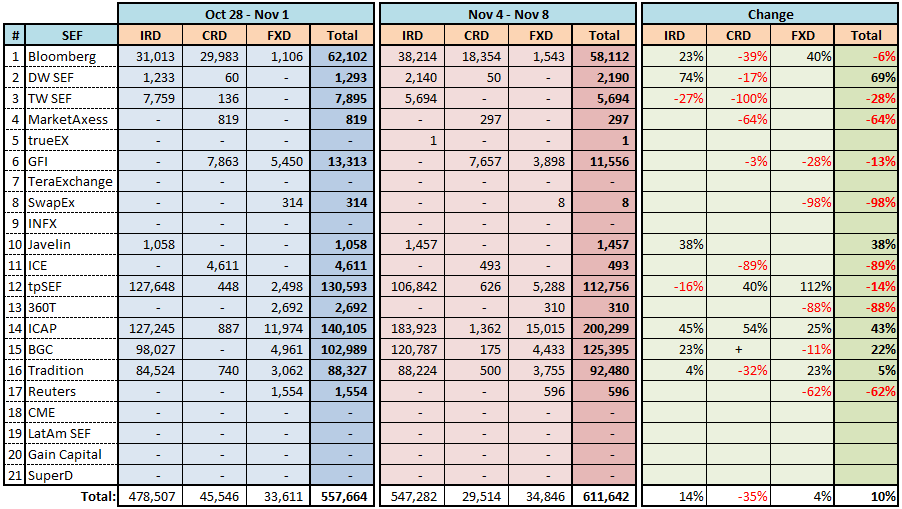
We can see the overall volumes have in fact increased by 10% for the week ending November 8. So much for the expiration of no-action relief. Or is it?
You can clearly see some significant changes both to the upside and downside. So I separated out the activity by D2C and D2D. I have made some assumptions here in doing so (I’d welcome feedback on these assumptions). In particular, I have assumed ICE to be all dealer volume, and Reuters to be the ex-FXAll client business. I could believe the lines are a bit more blurred than that. Regardless, the results are interesting:
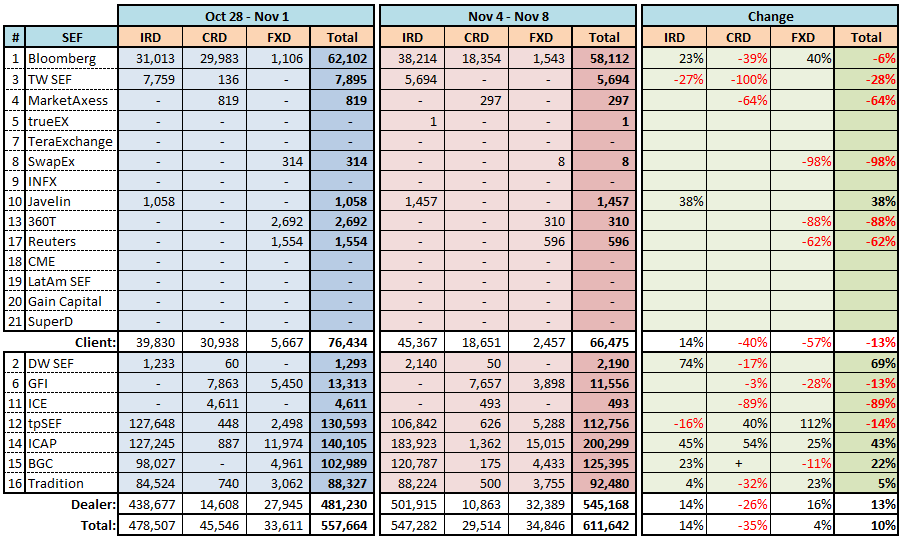
This more clearly shows the results that I expected to see. Client volumes off by 13% overall, and in fact total volumes are down for nearly every D2C SEF. The one exception is Javelin, which posted all of its weekly volume on Friday, presumably some client onboarding. Good to see a pickup there. There are some sharp drop-offs in a few of the D2C SEFs, which might corroborate the expectation that clients now need a ticket to ride the SEF bus.
The fact that ICE shows a drop of 89% makes me wonder if in fact I have categorized them incorrectly, perhaps they belong in the D2C category.
There are quite a few interesting observations that you can make with this data, however they are probably best saved for when we have more data in the weeks to come. Of course, I’ll have mine next week around this time. Please share any thoughts in the comments section below.
UPDATE
This weekly issue of SEF updates is not the most current. To see all SEF posts, including the most recent, please click through to the SEF Category.
Curious to see the comparison to a prior week since the last week of Oct would include month-end, which tends to distort data. I could see clients and dealers compressing/netting trades at the end of the month.
I think you’re right. End of month would be one of many variables that might impact the numbers. I’m planning to do it again for next week, so lets wait until then, although you could get a feel for the answer by going back over each week’s blog history.
Thank you for tracking all of the volumes. Regarding ICE Clear, since ICE acquired T-Zero maybe 5 years ago, which is now ICE Link, that is a D to C platform, therefore ICE Clear will also be D to C, and of course the creditex portion would be D to D. I don’t know how much the split is though.
Hi Tod – this data is extremely interesting – thanks for going to all the effort of finding it. Can I ask a very quick question (apologies if it’s clear in the data) – is the notional value traded single or double counted? Many thanks
I think Oliver and Co. are rightfully going to be saying “I told you so” …
http://www.risk.net/risk-magazine/news/2295886/acting-as-a-clearing-member-will-be-uneconomical-isda-panel
“Focusing on what the costs are for clearing – the default fund capital costs for default fund contributions, funding margin calls on behalf of clients, and the leverage ratio constraints – these costs were not anticipated by the regulators, and in each case, they independently disincentivise clearing versus bilateral trading. There is an awful lot of advocacy work to be done to explain what they are creating. It seems that either consciously or subconsciously, they fear central clearing perhaps,” said Oliver Frankel, a managing director at Goldman Sachs.
Good question and nearly a topic I’ve included in the blog the past few weeks. I’ve spot checked a few SEFs and have proven that for a 1mm trade done between party A and B, it gets reported to the SDR as 1mm and likewise the SEF report shows 1mm. So there is no double counting for each side.
Thanks. The feedback I’ve received from the SEFs are that ICE belongs best in the D2D camp for now. Like you say there is a split there though.