- Compression providers are now required to make data publicly available.
- $3.5trn of IRS notional was compressed last week according to European data.
- 38% of transactions submitted for compression were successfully modified.
- This data complements existing data from both Clarus CCPView and SDRView.
- A total of $4trn was compressed last week across both European and US venues.
MIFID II Data
One of the things that first jumped out at me when I saw the new APA websites was the tantalising prospect of “Compression Data” from two large APAs:
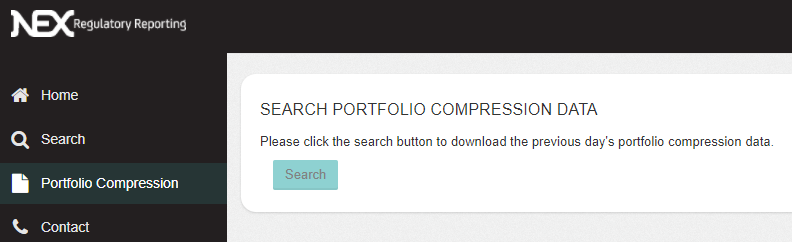
Thanks to NEX for calling me last week – they published their first Compression data! Importantly, we got even more data today (Monday 15th January).
We looked at Compression volumes for IRS last year. Multilateral compression offerings (that are not reported trade-by-trade into the US SDRs) compressed nearly $25trn in Q2 2017!
This new data from APAs therefore promises to capture data from the likes of TriOptima, providing transparency in this huge market. It also gives us a fighting chance of reproducing CCP “waterfalls” when we combine with our other CCP data – i.e. CCPView:
APA Data
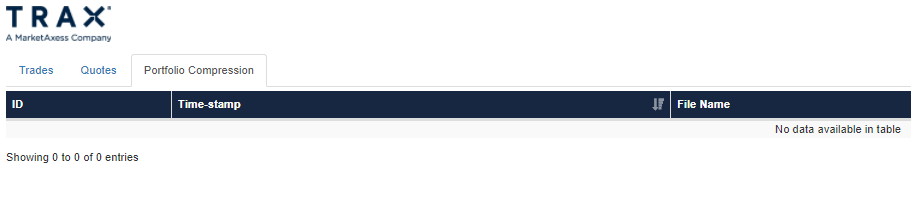
Today’s raw data looks like this:

- This data was published by NEX on a T+1 basis – i.e. the day after a Compression run.
- We know that this data was for Interest Rate Swaps in USD and MYR (“RATES SWAP” and “CURR” fields).
- Given the sheer number of USD trades, we assume that the USD line was a USD TriOptima run conducted at LCH SwapClear.
- MYR is interesting. The LCH SwapClear website doesn’t include this as a clearable currency.
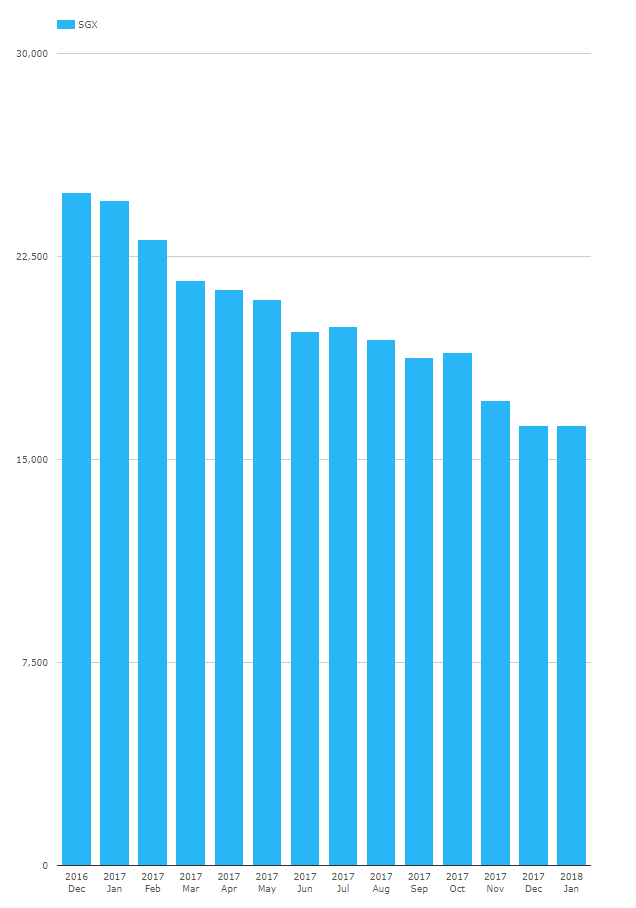
- This MYR data highlights an omission from the compression data – we would like it to state unequivocally whether the compression run was for Cleared or Uncleared derivatives (or a mixed run). CCPView data shows that only SGX offer clearing for MYR IRS:
Charts
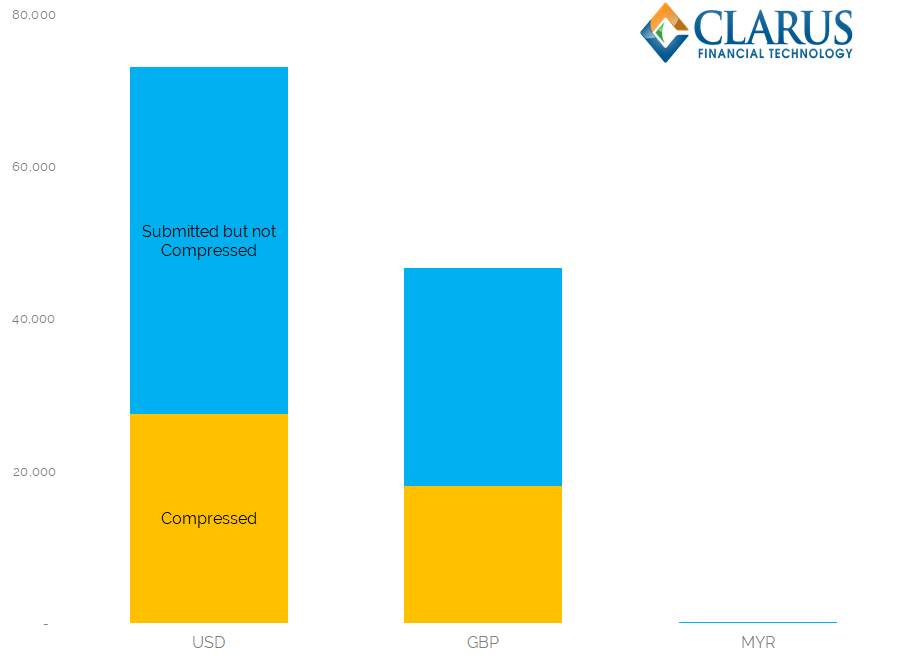
The numbers, across just three compression runs, are large:
Showing;
- In USD, over 73,000 trades were submitted for compression. By comparison, in the US SDRs we see less than 2,000 USD IRS reported each day.
- Over 27,000 trades were either terminated or had their notional changed. That means 38% of trades were modified in this run.
- The numbers are similar for GBP. 46,000 were submitted. Compare this with just 200 GBP trades reported daily to US SDRs…(we still have no usable MIFID II data to compare to. Not even a simple daily trade count for GBP swaps. Frustrating.)
- Over 18,000 trades were modified (39% of trades submitted).
- The chart highlights how small the MYR run was! Just 72 trades, of which 28 (39%) were modified.
- If we assume all three were done by the same compression provider (let’s assume TriOptima who are a member of the NEX group) then it is interesting to see that the process consistently modifies 38% of all trades submitted.
The Notional amounts changed are far more variable:
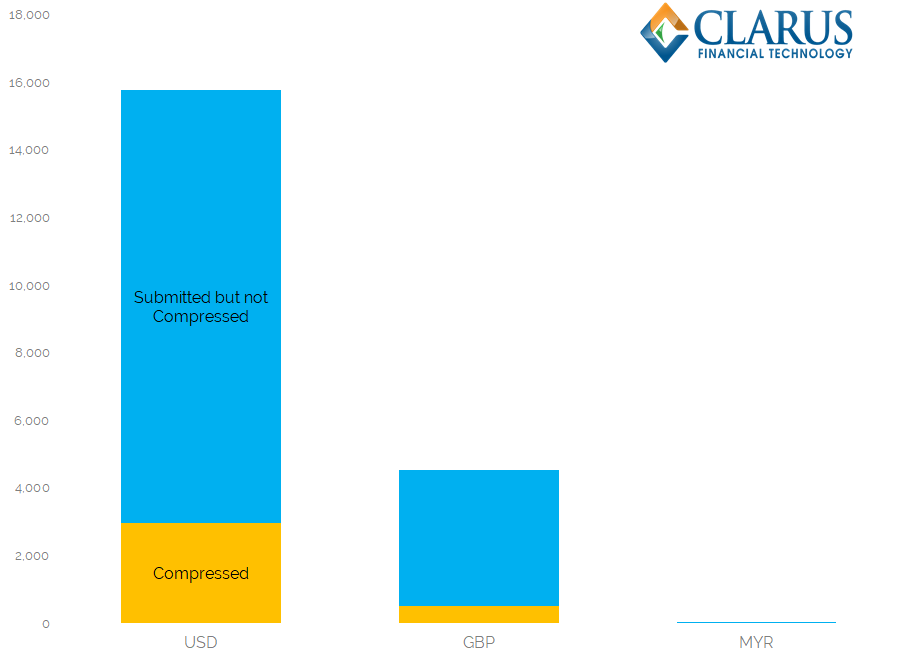
Showing;
- Gross Notional amounts submitted for Compression in each currency.
- We believe that NEX report the gross notional post-compression.
- In USD, it suggests that large termination runs are successful. 18.8% of notional ($3trn) was eliminated.
- GBP was less successful, but still managed to eliminate over £0.5trn. (Apologies for failing to convert all of the notionals in the chart above to USD…they are in native currency. Lack of time this week forces sub-par charts!).
- MYR is the real star of the show. 28% of notional was eliminated.
- This shows that even small compression runs can see large percentage reductions.
- We will follow the MYR data through our CCPView data update with interest. Will we see a reduction in Notional Outstanding at SGX for value date 12th January?
Compression in the SDRs
Compression across SEFs (e.g. TrueEx, Tradeweb and Bloomberg) also achieves notional reductions for Cleared swaps. Let’s therefore compare the new MIFID II data to what we saw for Compression across the US SDRs last week:
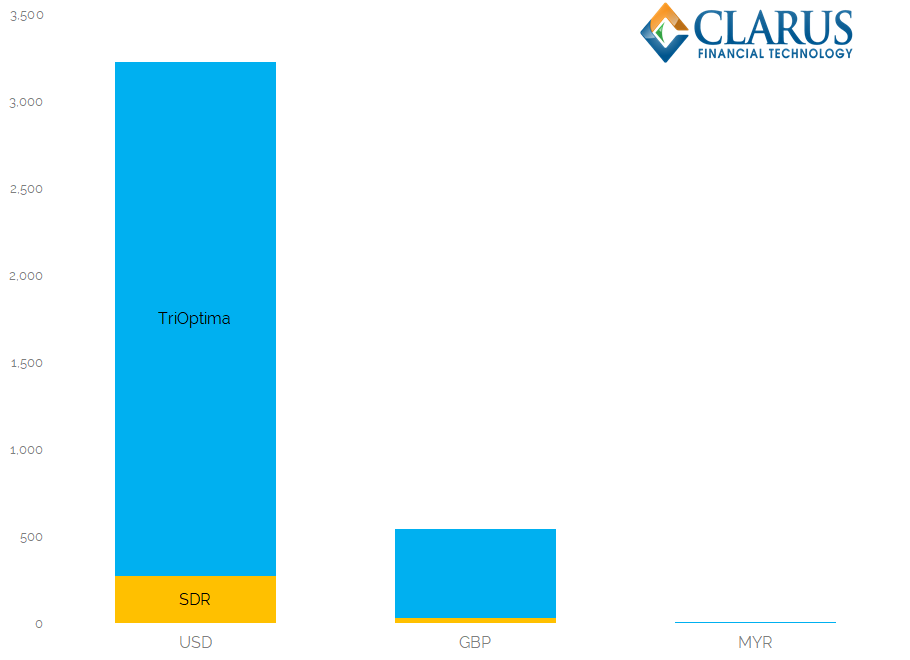
Showing;
- For simplicity of labelling, let’s assume that all compression reported to the NEX APA under the new MIFID II rules was done by TriOptima.
- The “SDR” compression in the charts could have been done by any venue. Subscribers to SDRView and SEFView can calculate the compression market shares per venue.
- There is no overlap between the TriOptima volumes and those reported to US SDRs. TriOptima is not a SEF.
- Multilateral providers such as TriOptima compressed 11 times more notional last week than was compressed in US SDRs (we imply SDR compression volumes from trade-level reports with matching time-stamps).
- Over the whole market, $4trn equivalent was compressed. That is a huge market.
In Summary
- We now have an insight into compression in Interest Rate Swaps thanks to new MIFID II data.
- The first European data shows that over $3.5trn was compressed in just three compression cycles.
- NEX have reported these volumes, therefore we assume these were transacted by TriOptima (part of the NEX group).
- Across European and US data, we saw $4trn compressed last week.
- There are interesting possibilities to combine this data with CCP and SDR data.