Amir took a look at CAD swaps when we first added the new Canadian DTCC data source at the beginning of this year. Now that we have more data and reporting has bedded down a bit, I thought it worthwhile to analyse the data to see if two sources are better than one.
Canadian reporting is all uncleared
For whatever reason, the majority of vanilla CAD IRS being reported by DTCC_CA is coming through as uncleared. To the extent that I find only 74 swaps reported as “Cleared” so far this year, versus 10,230 uncleared swaps! I do not believe this can be accurate, but it has been the same ever since reporting began, as Amir highlighted.
![]()
If anyone knows why this might be, please get in touch.
The amount of crossover between US and Canadian reporting is surprisingly small
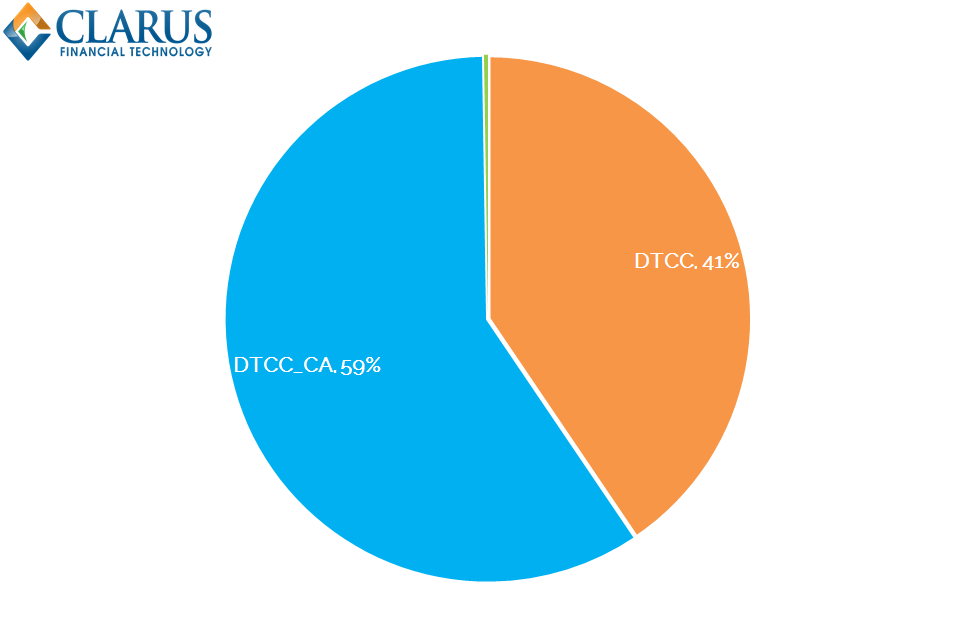
On a trade count basis, we find that only 1,179 vanilla CAD IRS trades have so far been “double-counted” – i.e. included in both the US and Canadian DTCC data feeds. By trade number we see the following;
- 18,500 trades have been reported so far this year. We need to remove one leg of duplicate trades that are reported to multiple SDRs.
- To do this, we first ignore the “Cleared” flag as a check (see above).
- The time-stamps are not always identical, but tend to be within a minute. We assume no other trades occur in CAD swaps in the time it takes to report to two SDRs!
- Start dates, end dates, size (below the caps), floating rate index, day counts and of course price are all checked for duplicate trades.
- Overall, we find 1,179 duplicate trades. This is only 6.8% of the real number of trades.
- DTCC_CA (Canadian DTCC) sees more trades reported to it than DTCC US. 10,000 versus 7,000 so far in 2017.
- Bloomberg SDR is very small, with only 43 trades so far this year.
The data quality is pretty poor.
There are over 1,800 swaps that have coupons off-market (typically zero with no adjustment to par). These trades are overwhelmingly in the Canadian SDR – over 91% of trades with a zero percent coupon have been reported to DTCC_CA in 2017.
As we saw with the US experience, this is fairly common in the early days of trade reporting as problems are ironed out. As market participants continue to consume the data, we expect this to improve over time.
The average size of trades is significantly different across SDRs
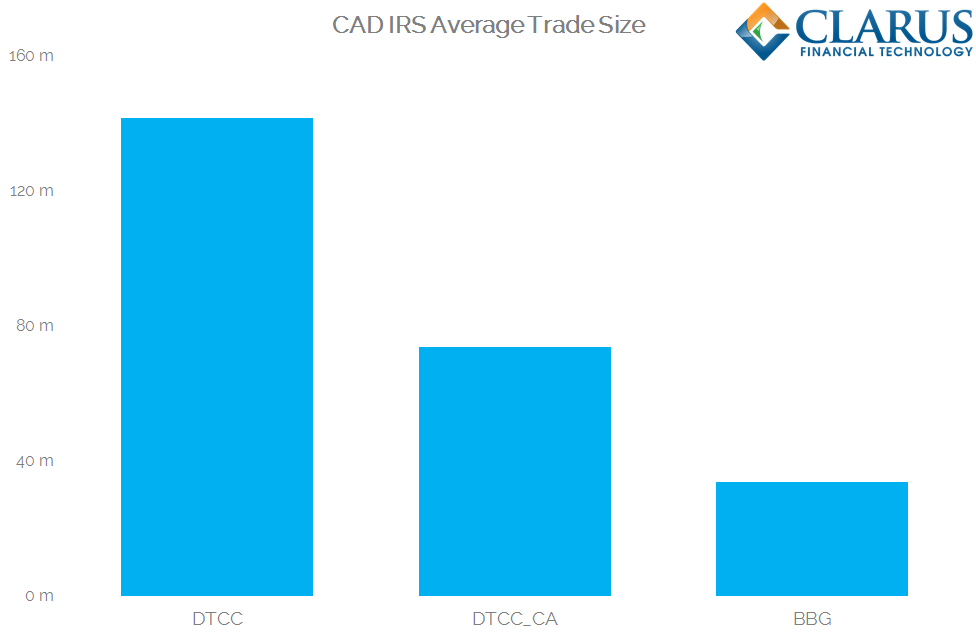
We have 3 SDRs to analyse data from for CAD IRS – DTCC, DTCC_CA and BBG. We can therefore analyse the data by “source” to look at a number of primary economic terms. First – average trade size in notional terms during 2017:
Showing;
- On average, larger trades are reported to DTCC. The average size has been CAD140m.
- DTCC Canada has half the average trade size at CAD74m.
- BBG is again significantly smaller for the handful of trades they see. Average size was half again at CAD34m.
The average maturity of trades is the same both “onshore” and “offshore”
On a notional-weighted basis, we see a weighted-average maturity at both of the DTCC SDR venues of ~2.5 years. This is somewhat shorter than we see in other markets. Remember that this excludes OIS products and FRAs.
The average daily volume reported to SDRs has doubled in 2017
If you take one thing away from this blog, please note that the new trade level reporting from the DTCC appears to have nearly doubled our coverage of the CAD IRS market on a trade-by-trade basis.
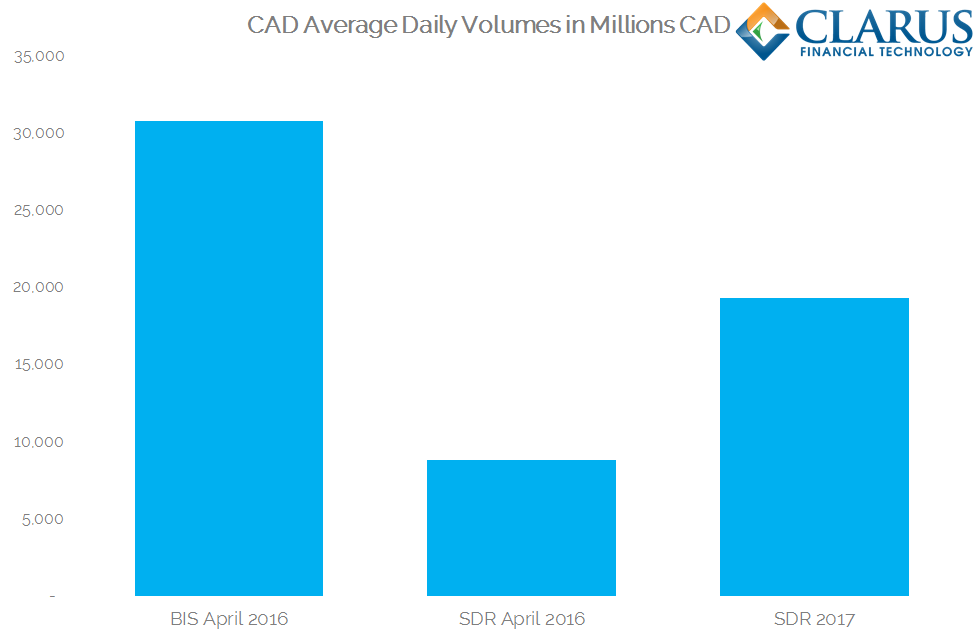
- In April 2016, CAD IRS were only being reported to DTCC in the US. There were not even any trades on Bloomberg. The average daily volume that we saw reported was CAD8.8bn.
- By way of comparison, the BIS Triennial Survey was conducted in April 2016. The BIS reported an ADV in CAD IRS of CAD30.8bn ($38.5bn equivalent).
- Fast forward to 2017 and we now have 3 SDRs reporting trade level data for CAD IRS.
- Our Average Daily Volume across all sources (removing duplicate trades) has so far been CAD19.3bn.
On the face of it, I would like to think that trade level coverage of the CAD IRS market has therefore more than doubled this year as a result of the Canadian Trade Reporting requirement. Of course, we cannot say for sure that volumes have not just increased naturally, but a leap of this magnitude seems unlikely.
If we consider the BIS triennial survey as the “whole” market we must acknowledge the caveats that we have noted before – namely the inclusion of inter-affiliate trades and the sheer number of reporting dealers at 1200+ sales desk. The BIS survey may therefore have a tendency to overstate the total size of risk transfer that actually occurs on a given day.
The price impact of trades is much larger in the Canadian “onshore” market
I (briefly) traded CAD swaps back in my trading days. Never very well I might add! But the over-arching flavour was of a market driven by “locals” (i.e. the Canadian banks) who had very strong franchises and were very protective over it. They hence were not overly keen to extend any meaningful liquidity to international banks trading all currencies in an effort to deliver a “one-stop shop”. Therefore, the market tended to be bifurcated along these lines – small trades between local banks and internationals, and larger trades that really defined the price action, and tended to occur between locals. I therefore wondered whether this could be witnessed in the data.
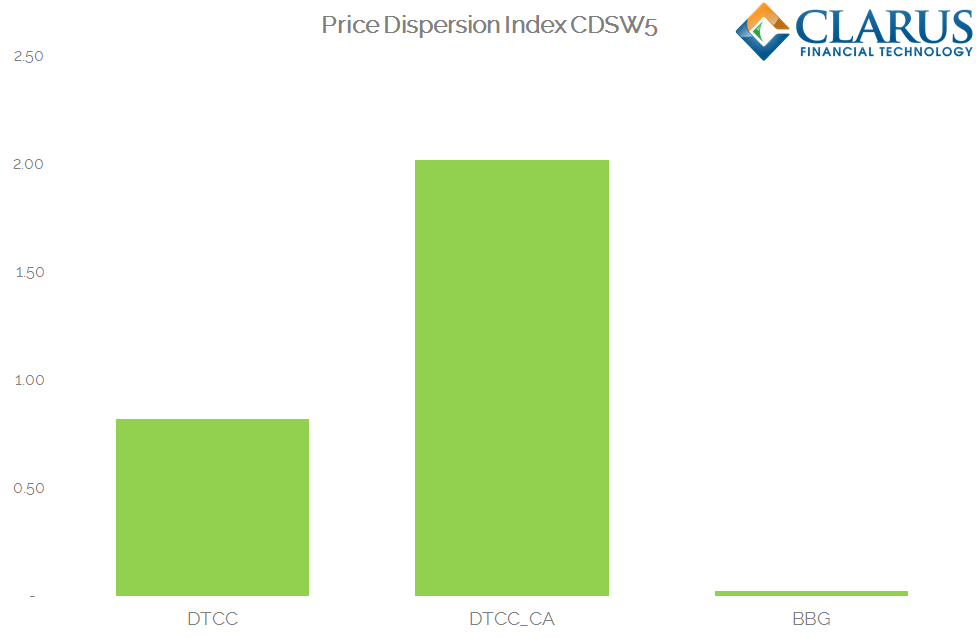
I looked at all spot starting five-year CAD IRS that have traded this year. I ran a price dispersion measure on these trades to look at the “price impact” at each SDR. The results are surprising:
Showing;
- We take the average price of all 5 year swaps reported across all SDRs each day.
- We calculate the square of the deviation from this average price and calculate the volume weighted sum.
- The square root of this sum is the “Price Dispersion” that we assign at each SDR.
- Unfortunately, due to the Uncleared flag at DTCC_CA, the Price Dispersion index at this SDR may be artificially elevated by the presence of uncleared trades, incorporating a bilateral credit charge in the price.
- BBG has a very small sample of trades, but nonetheless sees a price dispersion close to zero basis points.
- DTCC in the US sees less than a 1 basis point price dispersion.
- DTCC in Canada sees a much larger price dispersion, at 2 basis points.
- The total number of trades used in this sample is 1,363 trades – just about large enough for this type of statistical analysis.
Does this suggest that more Client trades are reported to DTCC_CA and they are subject to a larger bid-offer spread than a (presumably interbank) US market? Or is this simply consistent with locals defining the price action? Or simply due to the inclusion of uncleared trades in our sample?
It is an interesting finding that we will revisit in future blogs as the data continues to improve over time.
In Summary
- Transparency in CAD IRS markets has significantly improved during 2017.
- The number (and volume) of trades being reported has more than doubled so far this year compared to 2016.
- We estimate that over 60% of volumes are now reported on a trade-by-trade basis.
- Average trade sizes vary at each SDR, but average maturities are more consistent.
- The data suggests that the price impact of a trade is greatest for the subset of market participants reporting to the Canadian DTCC SDR.
- This could either be a sign that more Clients are reporting trades to DTCC_CA and hence must pay a margin to mid.
- Or it could be a sign of more aggressive onshore trading that defines the price action in CAD IRS.
- Unfortunately, to draw a concrete conclusion we need to know for sure what subset of the DTCC_CA trades are cleared vs uncleared.
- We look forward to improved data quality over the coming months to renew our analysis.