Central Counterparties recently published their latest CPMI-IOSCO Quantitative Disclosures and in this article I will highlight what the data shows, similar to my article on 4Q 2016 trends.
Background
Under the voluntary CPMI-IOSCO Public Quantitative Disclosures by CCPs, over two hundred quantitative data fields covering margin, default resources, credit risk, collateral, liquidity risk and more are published each quarter with a quarterly lag.
CCPView now has seven sets of quarterly disclosures, from 30 Sep 2015 to 31 Mar 2017 inclusive, which means we can observe both trends over time at one CCP and compare CCPs to each other.
Lets take a look at some of the main disclosures.
Initial Margin for IRS
Starting with the Initial Margin requirement for Interest Rate Swaps.

Showing:
- Total IM for these four CCPs was $140 billion on 31-Mar-2017
- While this is up $25 billion or 22% from a year earlier (in USD terms)
- For the first time, it is down from the prior quarter, $140.9 billion to $140.3 billion
- CME IRS IM down from $28.8 billion on 30-Dec-2016 to $23.1 billion
- Is responsible for the drop from the prior quarter
- LCH SwapClear is up from $105 billion to $109 billion
- JSCC IRS is up from $4.5 billion to $5.4 billion
- Eurex Clearing OTC IRS is flat at $2.4 billion
Looking in more detail at CME IRS and specifically the Client IM.
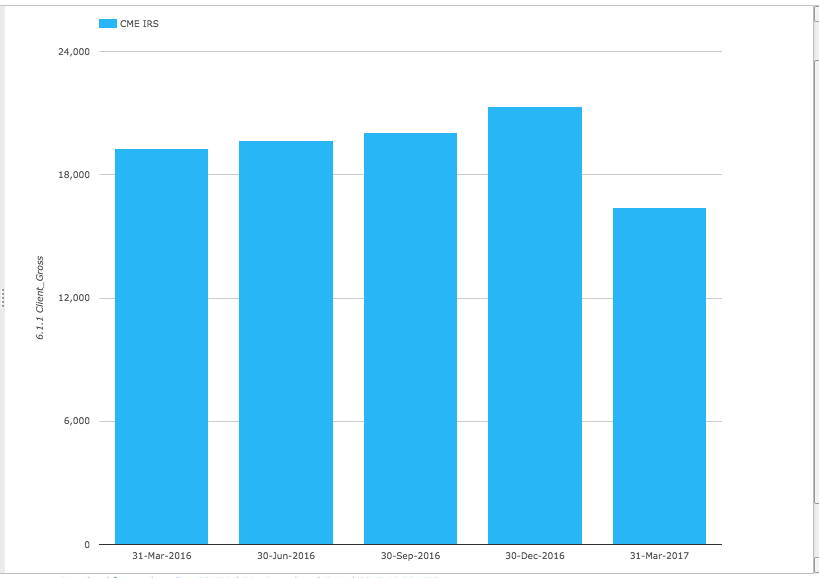
Showing that after rising modestly each quarter, Client IM dropped from $21.3 billion to $16.4 billion, a decrease of $5 billion or 23%. While House IM dropped more modestly, from $7.5 billion or $6.7 billion.
A case of clients decreasing their use of Swaps or a transfer of some clients to LCH SwapClear?
Lets look in more detail at the LCH SwapClear Client IM.
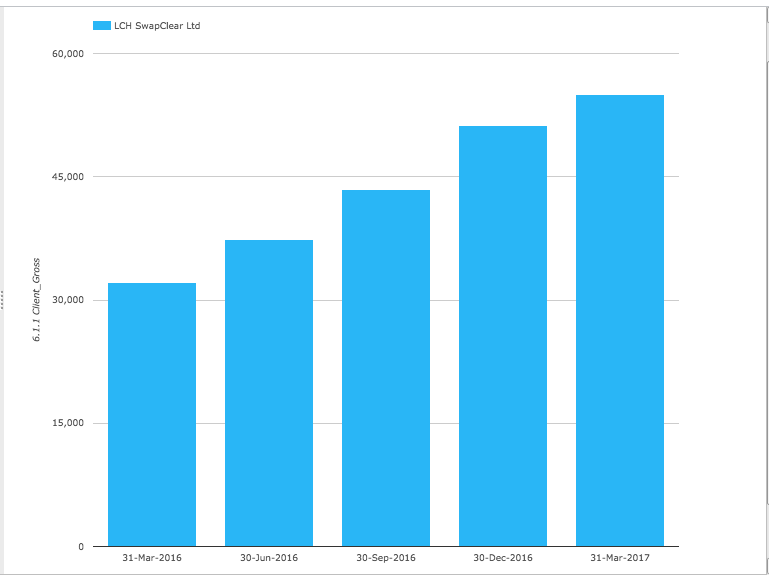
Showing that LCH SwapClear Client IM has risen each quarter and in-fact the rise in the most recent quarter of $3.7 billion is the lowest in the past year. As such the CME IRS drop is un-likely to be a transfer of client business to LCH SwapClear.
As we noted last time, LCH SwapClear Client IM is now larger than it’s House IM and this trend has continued with Client IM of $55 billion to House IM of $50 billion in the most recent quarter.
In GBP terms (the currency of LCH IM), Client IM is up over the year from £22 billion to £44 billion or 100%, while House IM is up from £35 billion to £40 billion or 15%.
So the growth at LCH SwapClear continues, particularly for client clearing and it will be interesting to see what happens in the next few quarters with Brexit starting to loom on the horizon.
Initial Margin for CDS
Next lets look at the Initial Margin requirement for Credit Default Swaps.
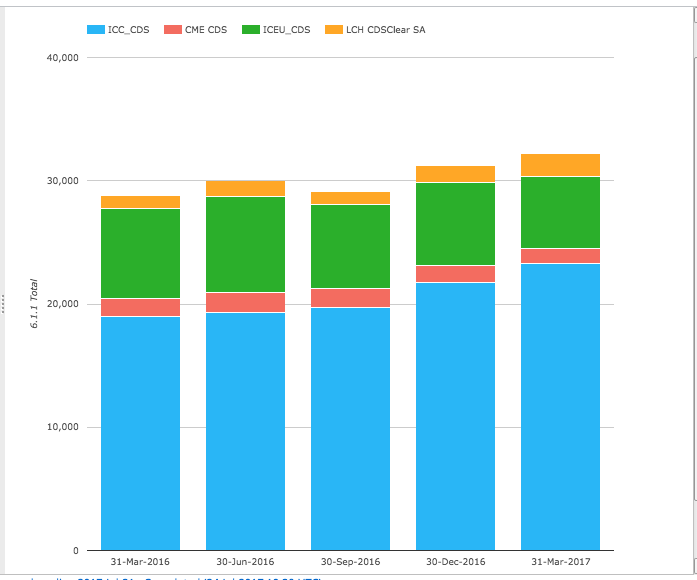
Showing:
- Total IM for these four CCPs was $32.2 billion on 31-Mar-2017
- Up from $21.2 billion on 31-Dec-2016, an increase of 3% (in USD)
- Up from $28.8 billion on 31-Mar-2016, an increase of 12% (in USD)
- ICE Credit Clear the largest at $23.3 billion, up from $21.7 billion in the quarter
- ICE Europe Credit next with $5.9 billion, down from $6.7 billion
- LCH CDSClear with $1.9 billion, up from $1.4 billion
- CME CDS with $1.2 billion, down from $1.4 billion
So signs of ICE Credit Clear increasing its dominance and LCH CDSClear making some headway against ICE Europe Credit, while the overall growth in the CDS market is much lower than IRS.
Initial Margin for ETD
Next Initial Margin for ETD (Futures & Options).
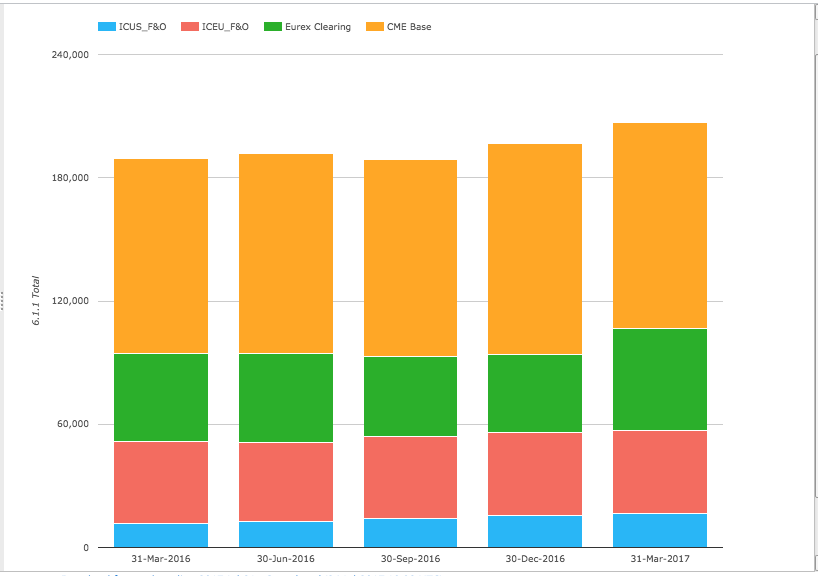
Showing:
- Total IM for these CCPs was $207 billion on 31-Mar-2017
- Up from $196.5 billion on 31-Dec-2016, an increase of 5% (in USD)
- Up from $189.4 billion on 31-Mar-2016, an increase of 9% (in USD)
- CME Base is the largest with $100 billion, down from $103 billion on 31-Dec-2016
- Eurex Clearing is next with $49.8 billion, up from $37.8 billion on 31-Dec-2016
- Eurex Clearing IM is up 30% in EUR terms over the quarter!
- With the growth mainly in Client IM.
- A sign of European markets picking up? Perhaps.
- ICE Europe F&O is $40.5 billion, flat from the prior quarter
- ICE US F&O is $16.3 billion, up from $15.4 billion
So a big increase at Eurex Clearing while the overall growth in the past year is modest.
More CCPs – DTCC, LME, NCC
We continue to add more disclosure data to CCPView and now that we have all the major Derivatives CCPs, we are adding the major Securities CCPs. Let’s look at the size of IM for a some of these.
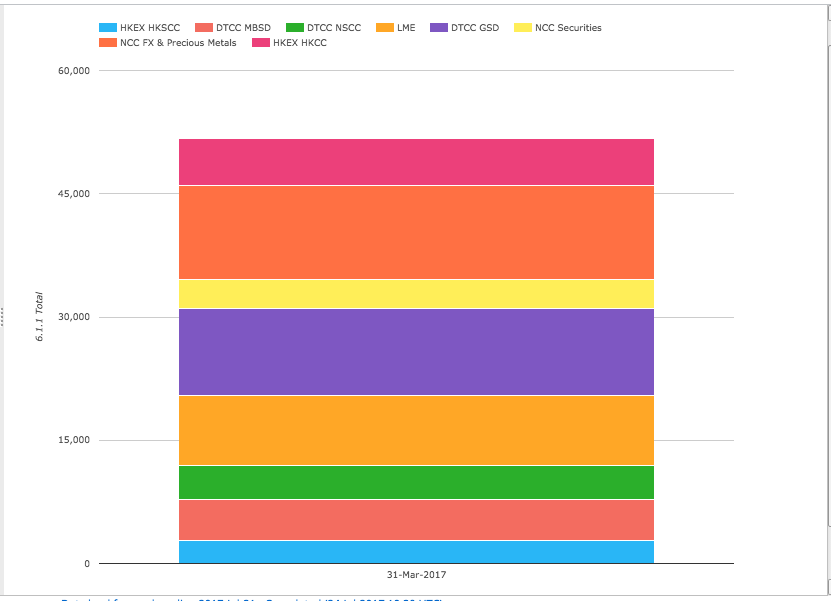
Showing:
- Total IM of $52 billion for these CCPs
- HKSCC, Hong Kong Securities Clearing Company with $2.8 billion in IM
- HKCC, Hong Kong Clearing Corporation with $5.7 billion
- DTCC Government Securities Division (GSD) with $10.6 billion
- DTCC Mortgage-backed Securities Division (MBSD) with $5 billion
- DTCC National Securities Clearing Corporation (NSCC) with $4.1 billion
- London Metal Exchange (LME) with $8.5 billion
- Moscow Exchange Group’s NCC Securities with $3.5 billion
- Moscow Exchange Group’s NCC FX & Precious Metals with $11.4 billion
The size of some of these numbers is surprising and lots of disclosure data to delve into in future.
VM and IM Calls
The flows of VM and IM between CCPs and their members are another interesting disclosure.
First the maximum total variation margin paid to the CCP on any business day and selecting just four CCPs, CME, Eurex, ICE US F&O and LCH SwapClear.
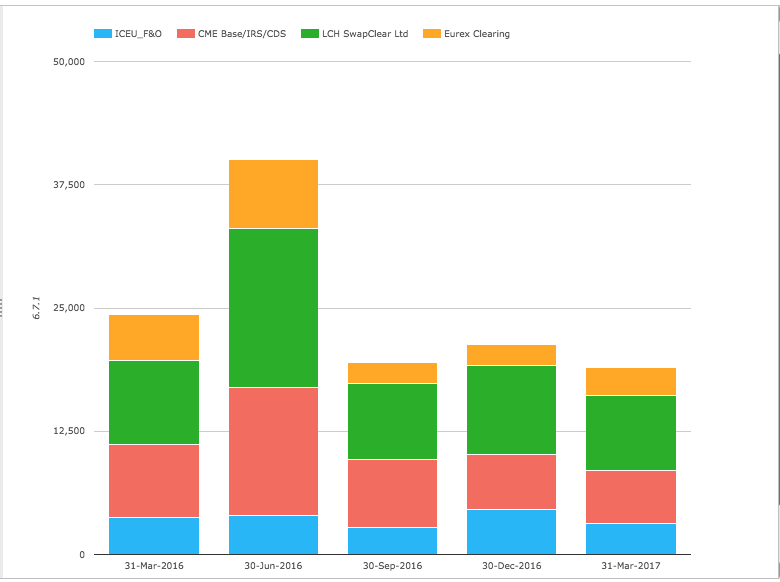
Showing:
- A total across all these CCPs of $19 billion
- The lowest number of any quarter in the past 15 months
- LCH SwapClear the largest with $7.6 billion on one day in the quarter
- CME next with $5.4 billion
- ICE Europe F&O with $3.1 billion
- Eurex Clearing with $2.9 billion
Next the maximum aggregate initial margin call on any business day over the period. (Note for some CCPs these figure includes intraday VM, so the IM component would be lower).
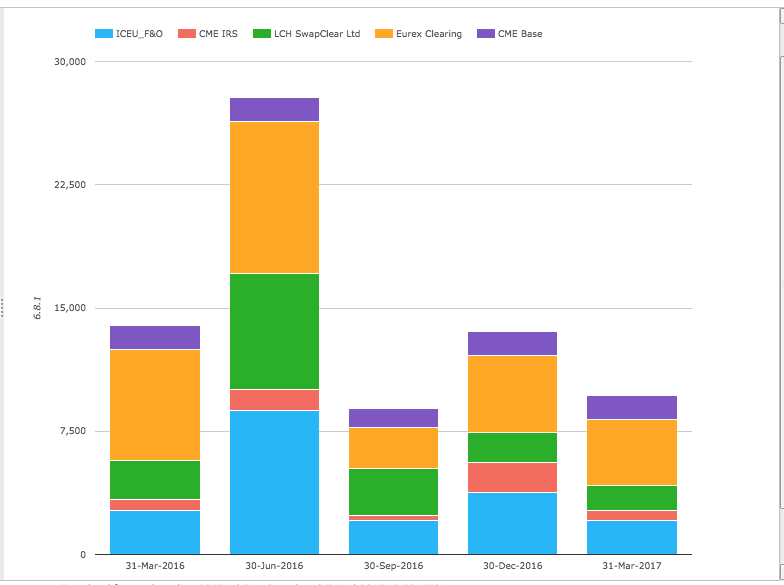
Showing:
- The aggregate maximum daily IM for these 5 CCPs was $9.7 billion in the latest quarter
- Eurex Clearing the largest with $4 billion (this is likely to include large intra-day VM)
- ICE Europe F&O with $2.1 billion (again possibly including intra-day VM)
- LCH SwapClear with $1.5 billion
- CME Base with $1.4 billion and CME IRS with $650 million
Credit Risk
In terms of Credit Risk, one of the interesting disclosures is the estimated largest aggregate stress loss (in excess of initial margin) that would be caused by the default of any two participants and their affiliates in extreme but plausible conditions, expressed as a peak day amount in the previous 12 months.
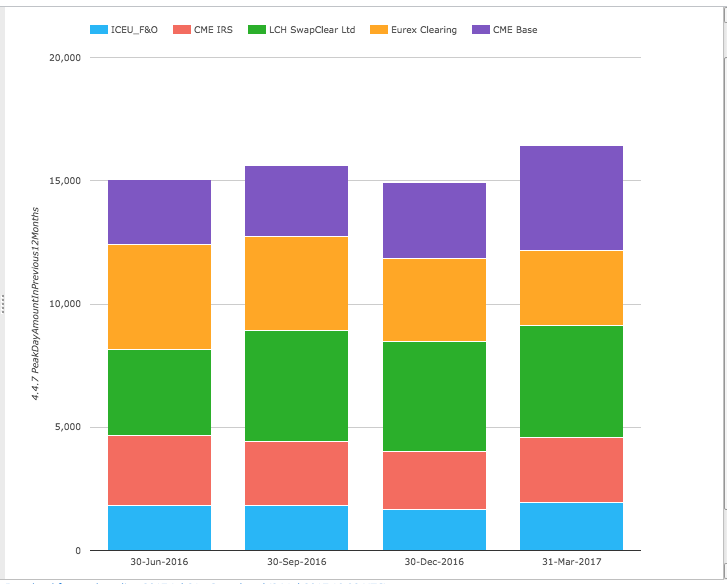
Showing:
- The most recent quarter was higher than prior ones
- CME Base increasing the most by $1.1 billion from the prior quarter to $4.3 billion
- LCH SwapClear at $4.5 billion, similar to prior
- Eurex Clearing $3.1 billion, also similar
No real concern with these amounts as each is well within the Default Resources of the respective CCPs, as given in Disclosures 4.1 (not shown).
Other Disclosures of Interest
A few others to point out (charts not shown):
- LCH SwapClear, number of client accounts has increased from 17,092 to 17,848, similar to prior quarters
- LCH SwapClear number of bank participants is down 4 to 94, while other participants is up 2 to 15
- CME Base Default Resources are up, with pre-funded participant contributions up from $3.3 billion to $4.6 billion and committed up from $9.2 billion to $12.7 billion.
- CME IRS Default Resources are also up with pre-fundedparticipant contributions up from $2 billion to $2.9 billion and committed from $0.9 billion to $1.7 billion.
- Not sure why this is, perhaps higher market volatility or a change in risk policy
- CME Base and CME IRS have added one new clearing member, which seems to be a foreign bank participant, the totals now being 64 and 25 respectively
More Disclosures
CCPView has a lot more CPMI-IOSCO Disclosures covering Interest Rate Derivates, Credit Derivatives, Futures and Options and now Securities, currently from fifteen Clearing Houses each with many Clearing Services and we continue to add more.
With over 200 quantitative data fields and seven sets of quarterly figures from these CCPs, there is no lack of information for analysis and discussion.
If you are interested in this data please contact us for a CCPView subscription.
Thanks for the update! What I find interesting is that total posted initial margin posting against OTC contracts (about $225 billion) is still way below the multi-trillion dollar levels many were forecasting some years ago (e.g., ISDA projected $7 trillion in extra collateral needs stemming from central clearing). Not to brag (but what the heck!) at the IMF we called for $100 – 200 billion incremental initial margin and default fund contributions in the April 2012 GFSR . Mind you our numbers included default fund contributions, which I believe are a small fraction of initial margin ones, but i wonder if CCPView can grab those numbers too? (http://www.imf.org/en/Publications/GFSR/Issues/2016/12/31/The-Quest-for-Lasting-Stability)
Thank you for the comment.
We do have Default Fund Contributions data, I just did not cover in the article.
For the 4 CCP Services in the first chart, where IM for IRS total is $140 billion, the Default Fund Total is around $25 billion, counting CCP contributions, Pre-funded and Committed Member Contributions.