Central Counterparties recently published their latest CPMI-IOSCO Quantitative Disclosures, so lets look at trends in the data, similar to my article on 2Q 2016 trends.
Background
Under the voluntary CPMI-IOSCO Public Quantitative Disclosures by CCPs, over two hundred quantitative data fields covering margin, default resources, credit risk, collateral, liquidity risk and more are published each quarter with a quarterly lag.
CCPView now has five sets of disclosures, from 30 Sep 2015 to 30 Sep 2016 inclusive, which means we can both observe trends over time at one CCP and compare CCPs to each other.
Lets take a look at some of the main disclosures.
Initial Margin for IRS
Starting with Initial Margin for Interest Rate Swaps.
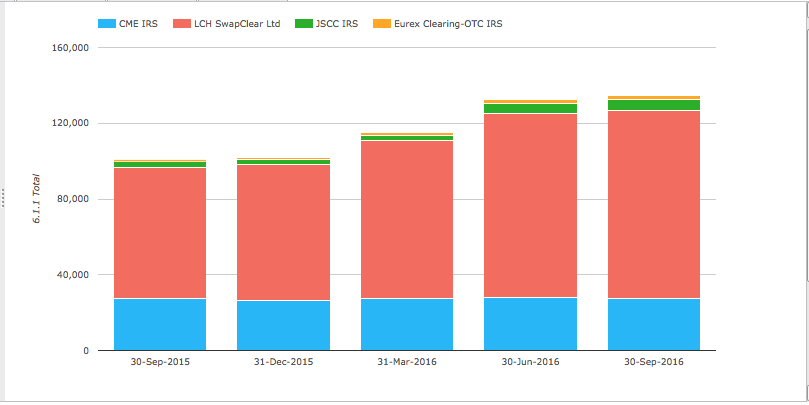
- Total IM for these four CCPs was $134.4 billion on 30-Sep-2016
- This is up by 1.4% from the $132.5 billion on 30-Jun-2016
- The trend over the year is up 33% in USD terms and even higher in local ccy
- LCH SwapClear is by far the largest with $99.6 billion up from $97 billion
- LCH SwapClear IM is in GBP and on this basis it is up 7% in the quarter to £77 billion
- CME IRS is next with $27.2 billion, down 2% from $27.8 billion
- JSCC IRS with $5.5 billion is the same as the prior quarter
- Eurex Clearing OTC IRS at $2 billion is the same as the prior quarter
While Initial Margin at a single point in time is influenced by many factors in the period (new volume, compression, volatility), it is a good measure of the relative size and systemic importance of a CCP.
There is further detail in terms of the breakdown between House and Client Margin and the growth in each, but in the interests of time, will leave that to those of you interested to see for yourself in CCPView.
Initial Margin for ETD
Next lets look at IM for ETD (Futures & Options) and three Global Interest Rates CCPs.
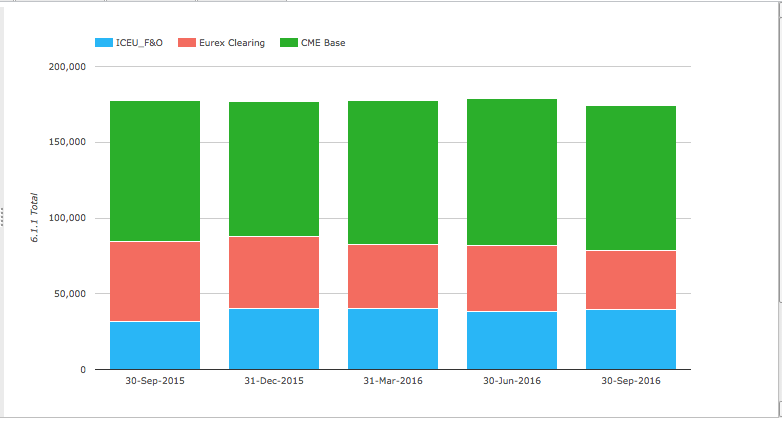
- Total IM for these three CCPs was $174.5 billion on 30-Sep-2016 ($40b higher than IRS above)
- The trend over the year is flat, with a 3% reduction from prior quarter
- CME Base is the largest with $96 billion, down 1% from $97.5 billion in the prior quarter
- ICE Europe F&O is $40 billion, unchanged from the prior quarter
- Eurex Clearing is $38 billion, down from $43.5 billion
- Sep-2106 is the first time that ICE is higher than Eurex (in this data series)
- Eurex Clearing in EUR terms is down 12% in the quarter and down 27% over the year
- CME and ICE up over the year to leave the overall trend flat
Members and Clients for IRS
As mandatory clearing for IRS is currently being phased in, lets look at the member and client disclosures.
First the general clearing members.
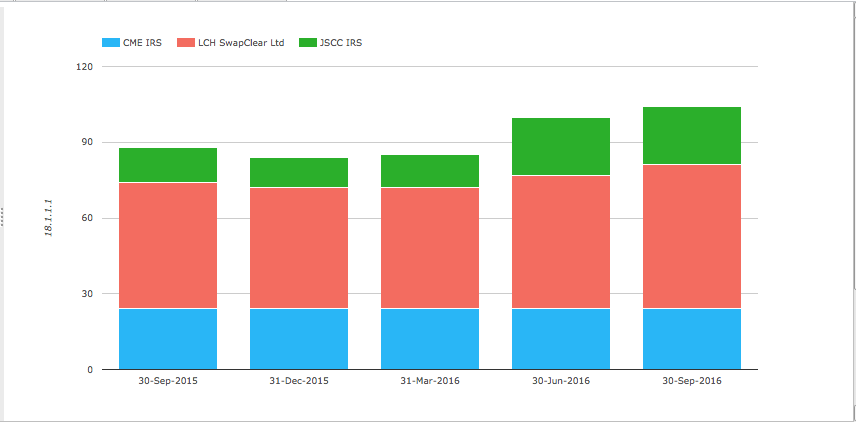
- CME IRS has 24 members and is unchanged over the year
- JSCC IRS has 23 members and also unchanged
- (graph is misleading as prior to 30-Jun-16, 10 members were direct and not general)
- LCH SwapClear has 57 general members, up from 53 on 30-Jun and 48 on 31-Mar
- This is largely due to non-bank participants increasing from 5 to 12 between 31-Mar to 30-Sep
We know that in Oct 2015, SwapClear announced its first non-bank member as Citadel Securities, however a quick scan of the SwapClear member list only reveals two obviously non-bank entities (both Citadel), so it needs more research to discover the others.
Next the Clients.
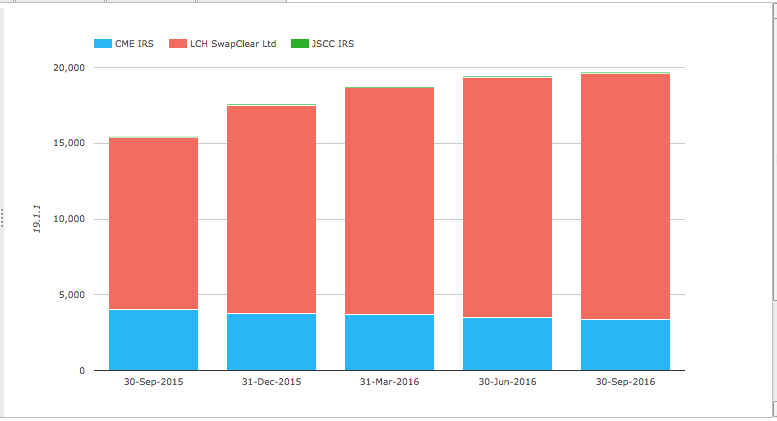
- LCH SwapClear increasing Client Accounts by 3%, from 15,840 to 16,280 in the quarter
- Over the year, LCH SwapClear Client Accounts have increased by 43%
- CME IRS decreasing Client Accounts by 5% to 3,345 in the latest quarter
- JSCC IRS showing 56, same as before (this may be Clients rather than Accounts)
- (Eurex Clearing do not break out their OTC IRS number)
VM and IM Calls
Next lets look at flows of VM and IM between CCPs and their members.
First the maximum total variation margin paid to the CCP on any business day.
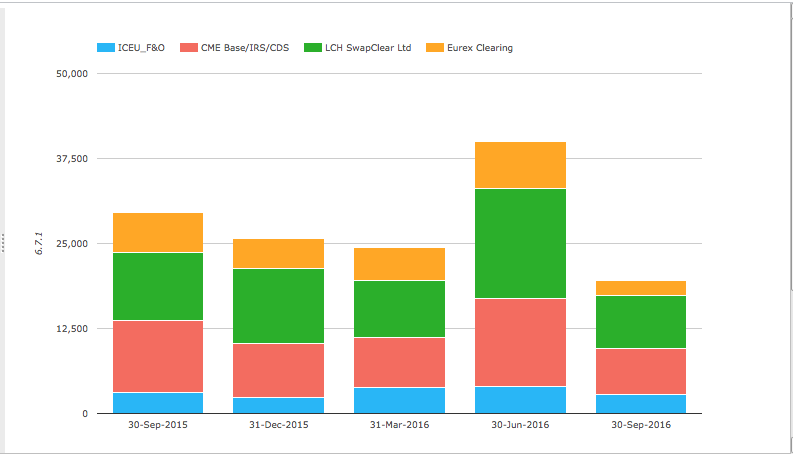
- The quarter ending 30-Jun-2106 is by far the highest in the series with > $37 billion
- The quarter ending 30-Sep-2106 is the lowest in the series
- LCH SwapClear had it’s highest of $16 billion in the quarter ending 30-Jun-2016
- And was $7.7 billion in the quarter ending 30-Sep-2016
- CME had it’s highest of $13 billion in the quarter ending 30-Jun-2016
- And was $6.8 billion in the quarter ending 30-Sep-2016
- Eurex Clearing had it’s highest of $7 billion in the quarter ending 30-Jun-2016
- And was $2.2 billion in the quarter ending 30-Sep-2016
- ICE Europe F&O had it’s highest of $4 billion in the quarter ending 30-Jun-2016
- And was $2.7 billion in the quarter ending 30-Sep-2016
[UPDATE: The above chart has been corrected to state revised and lower numbers for Eurex Clearing]
Next the maximum aggregate initial margin call on any business day over the period. Note for some CCPs these figure includes intraday VM, so the IM component is much lower.
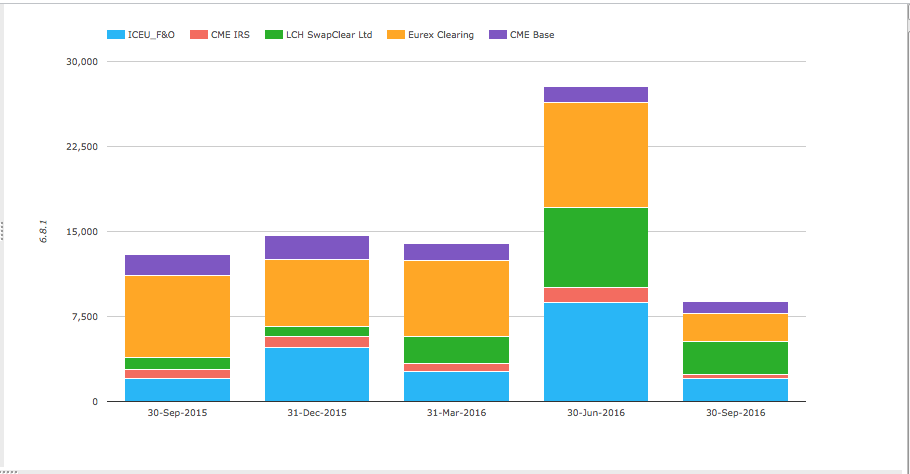
- The quarter ending 30-Jun-2106 is by far the highest in the series
- Eurex Clearing had the highest aggregate IM Call at $9.2 billion in this quarter
- (For Eurex Clearing and other CCPs a larger share of this figure may be from Intraday VM and not IM)
- ICE Europe F&O next with $8.8 billion
- LCH SwapClear with $7 billion
- CME Base + CME IRS with $2.7 billion
- (All the above in the quarter ending 30-Jun-2016)
- The quarter ending 30-Sep-2106 is the lowest in the series
[UPDATE: The above chart has been corrected to state revised and lower numbers for Eurex Clearing]
More Disclosures
CCPView has a lot more CPMI-IOSCO Disclosures covering Interest Rate Derivates (IRD), Credit Derivatives (CDS) and Futures and Options (ETD), currently from thirteen Clearing Houses each with many Clearing Services and we plan to to add more.
I would encourage those of you interested in this data to contact us for a CCPView subscription.
Final Thoughts
CPMI-IOSCO Public Quantitative Disclosures provide many useful insights.
The quarter ending 30 Sep 2016 was a quiet one.
Many disclosures were significantly down from the record highs in the prior quarter.
We know the next quarter was a more volatile one with the US Election and Fed Rate Rise.
It will be interesting to see what the next set of disclosures show.
An earlier version of this blog had much higher figures for Eurex Clearing for the two charts in the VM and IM Calls section for the quarters 30-Sep-2015 to 30-Jun-16 inclusive.
It was pointed out to us that there were updated disclosures available and we have uploaded these today and the charts and text below the charts have been updated.
Apologies for the mis-information.