Last week I looked at CCP Disclosures 1Q2016 – Trends in the Data , so this week I thought it would be interesting to focus on disclosures for Initial Margin Models to see how they compare.
Background
Under the voluntary CPMI-IOSCO Public Quantitative Disclosures by CCPs, over two hundred quantitative data fields covering margin, default resources, credit risk, collateral, liquidity risk and more are published each quarter with a quarterly lag.
CCPView now has three sets of disclosures; for 30 Sep 2015, 31 Dec 2015 and 31 Mar 2016.
Credit Derivatives
Lets start by using CCPView to view the latest disclosures by the four CCPs active in CDS.
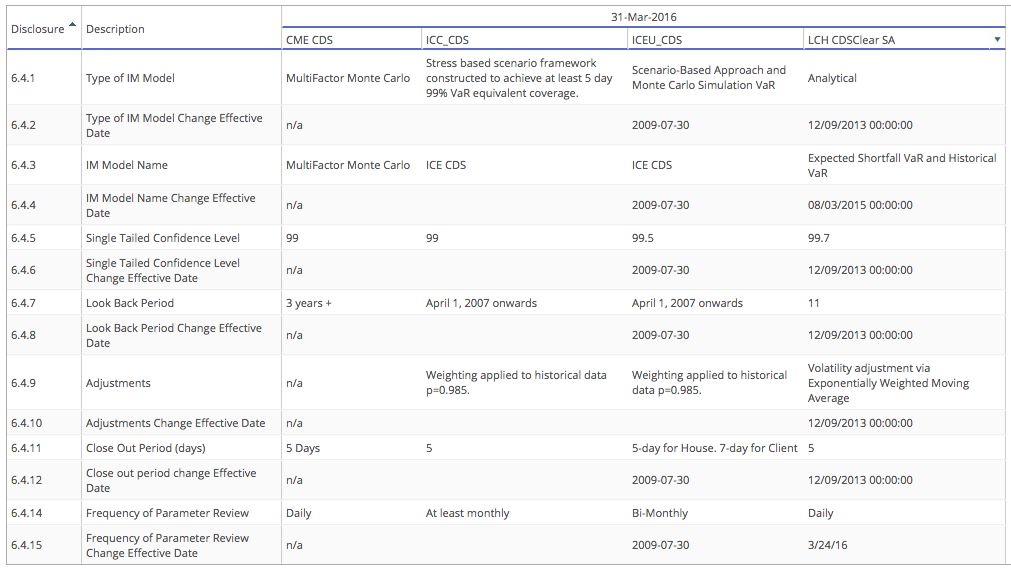
Showing:
- ICE Clear Credit (ICC_CDS), the largest CCP, uses
- Stress scenarios constructed to achieve at least a 5-day 99% VaR coverage
- Historical Look back period is April 1, 2007 onwards, so >9 years
- Weighting of 0.985 to historical data (so less weight for older data)
- ICE Clear Europe – CDS (ICEU_CDS), the next largest
- Scenario based approach and a Monte Carlo Simulation VaR
- Model was changed 30 July 2009
- 99.5% confidence level and same Look back period and Weighting as ICC_CDS
- Close out period of 5-days for House and 7-days for Client
- CME CDS
- Multi-factor Monte Carlo Simulation
- Look Back period is 3 years +
- 99% confidence level and 5 days close out
- LCH CDSClear
- Expected Shortfall and Historical VaR
- Model was changed 08/03/2013
- Look Back period is 11 (years?)
- 99.7% confidence level, 5 day close out and weighting
In general a consensus across the board on 5 days for close out (or MPOR), while there are differences in confidence levels, the look book period, stress or simulation based models and types of adjustments.
Futures and Options
Next lets look at Futures and Options and five of the CCPs that we have data for in CCPView.
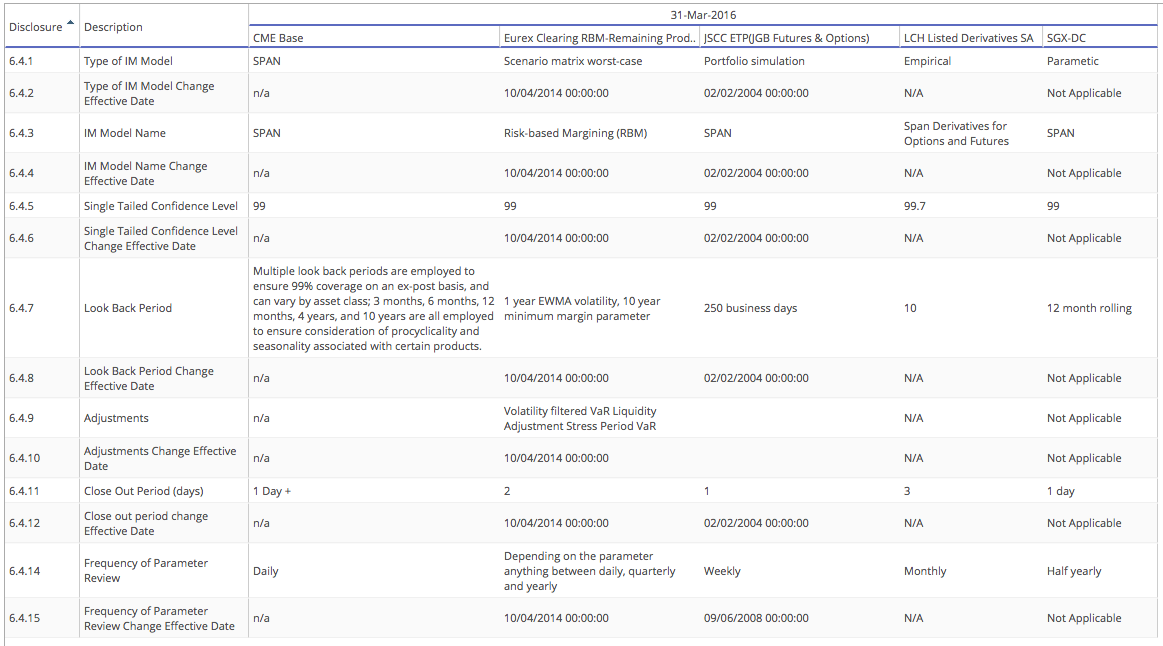
Showing:
- SPAN is used by CME and all others except Eurex with RBM
- Confidence level is 99%, except for LCH Listed Derivatives SA with 99.7% (2 Std dev)
- Look Back Periods vary from 1 year to 10 year
- Close out periods shows the greatest variation, with 1 day, 1 day+(?), 2 day and 3 day.
While SPAN and RBM have been in use for more than 30 years and have withstood the test of time, we know that more recently some CCPs are offering portfolio margining of ETD and OTC Derivatives and in some cases also moving ETD only portfolios from SPAN to Simulation based approaches.
Interest Rate Swaps
Now lets look at IR Swaps and four of the CCPs that we have data for in CCPView.
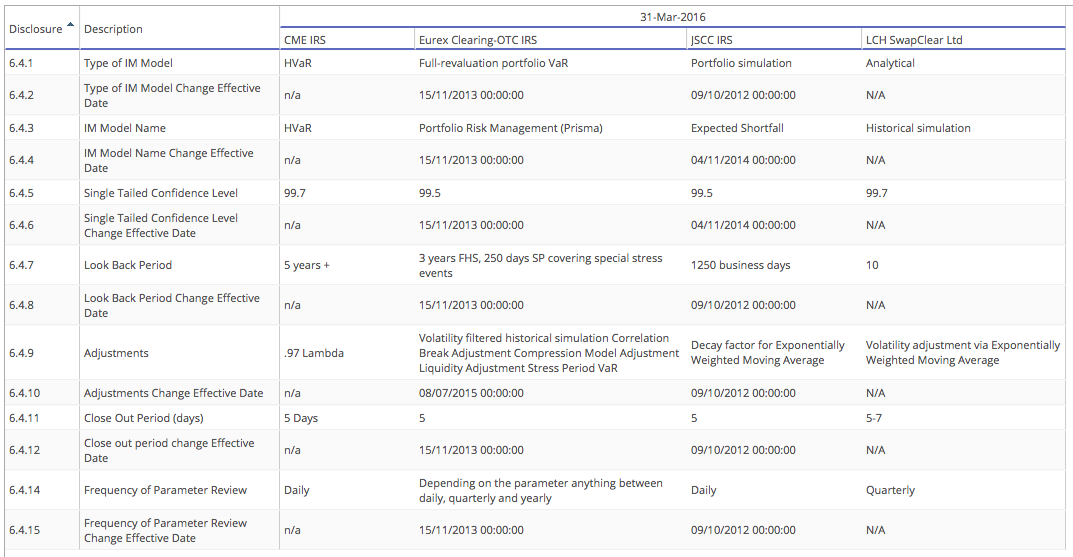
Showing that:
- Historical Simulation is used by all of these
- Either a VaR measure or Expected Shortfall is used (see FRTB article for the difference)
- Confidence levels are either 99.5% or 99.7%
- Look back periods vary, with Eurex using 3 years plus stress events, the others 5 years to 10 years
- Adjustments have a similar ring for each, except Eurex looks more involved
- Close out periods of 5 days, except LCH which is 5 for house and 7 for client
We also know that CME and Eurex currently offer portfolio margining of certain Futures contracts with IRS, using these same margin models, while JSCC and LCH are both planning to launch this capability. [UPDATE: JSCC launched this in Sep 2015 and ASX also offer portfolio margining]
Backtesting of Margin Models
With any margin model the proof is in the back testing results, so it is good to see that there are also lots of quantitative disclosures on these.
However that would take sometime, so a good topic for another day.
We will end there, except for a quick summary.
Summary
CPMI-IOSCO Public Quantitative Disclosures by CCPs provide many useful insights.
Including Initial Margin Model Types, their parameters and dates of change.
From these disclosures we can observe the following.
CCPs in CDS use Stress or Monte-Carlo approaches.
Primarily due to data constraints and dynamics of these markets.
CCPs in IRS use Historical Simulation.
Primarily due to the availability of good quality price data.
CCPs in Futures and Options use SPAN, which is analogous to a parametric Historical VaR.
One with very specific margin aggregation logic.
IRS and CDS use 5-day close out periods.
Futures and Option close out periods vary from 1-day to 3-day.
Primarily due to differences in liquidity, regulation and practice.
There are more CCPs and more Disclosures in CCPView.