Central Counterparties recently published their new CPMI-IOSCO Quantitative Disclosures, meaning we now have three sets of disclosures, so I thought it would be interesting to look at trends in the data.
Background
Under the voluntary CPMI-IOSCO Public Quantitative Disclosures by CCPs, over two hundred quantitative data fields covering margin, default resources, credit risk, collateral, liquidity risk and more are published each quarter with a quarterly lag.
CCPView now has three sets of disclosures; for 30 Sep 2015, 31 Dec 2015 and 31 Mar 2016.
Initial Margin
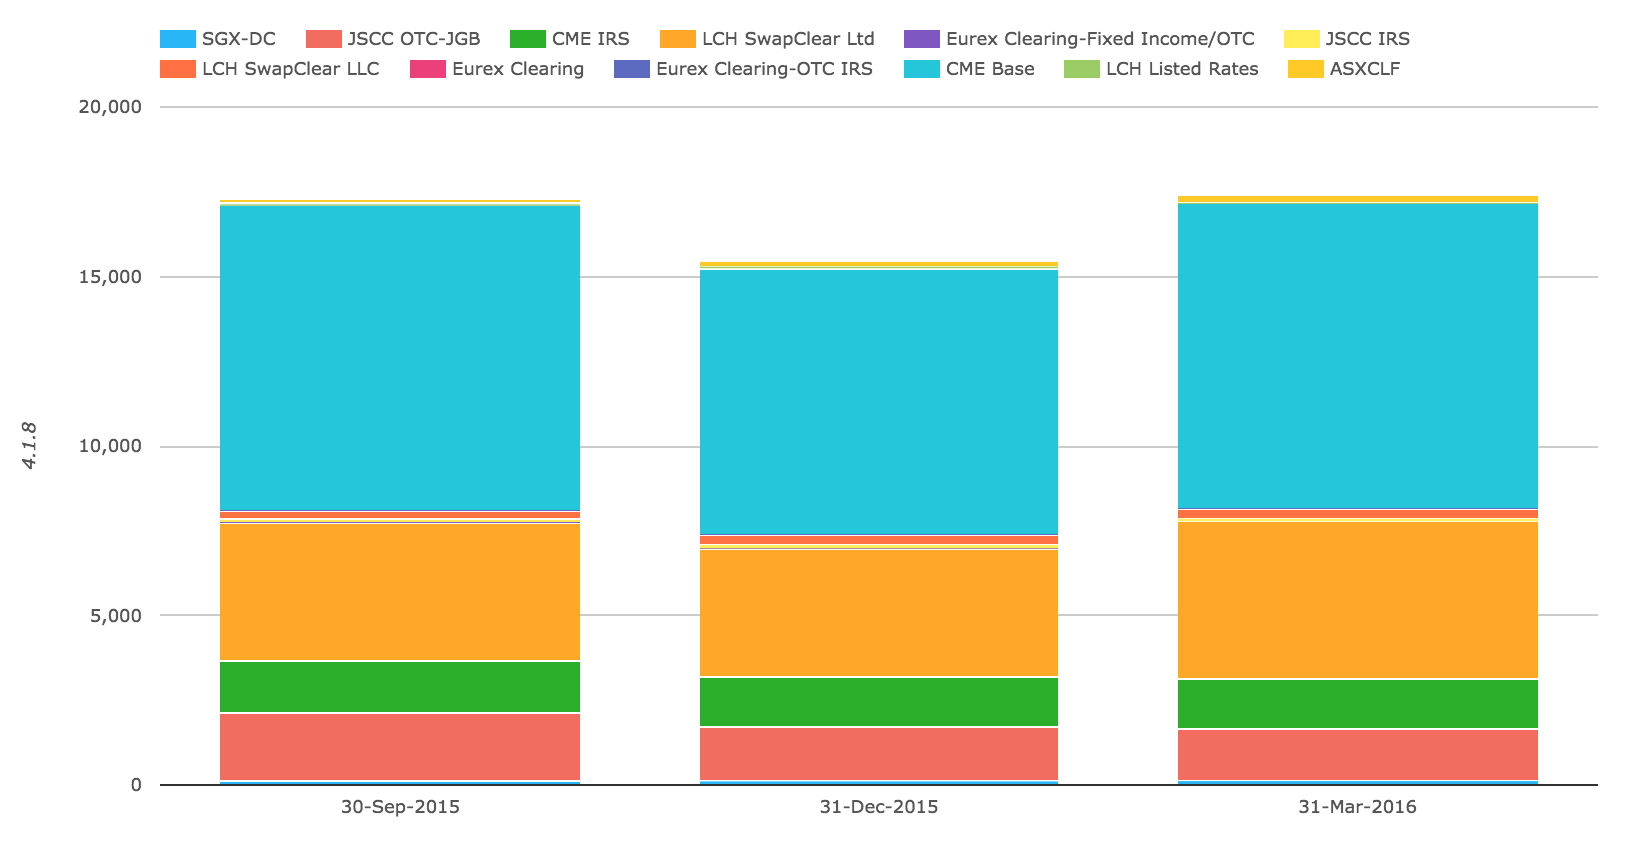
Lets start with Initial Margin for IRD, covering Swaps and Futures.
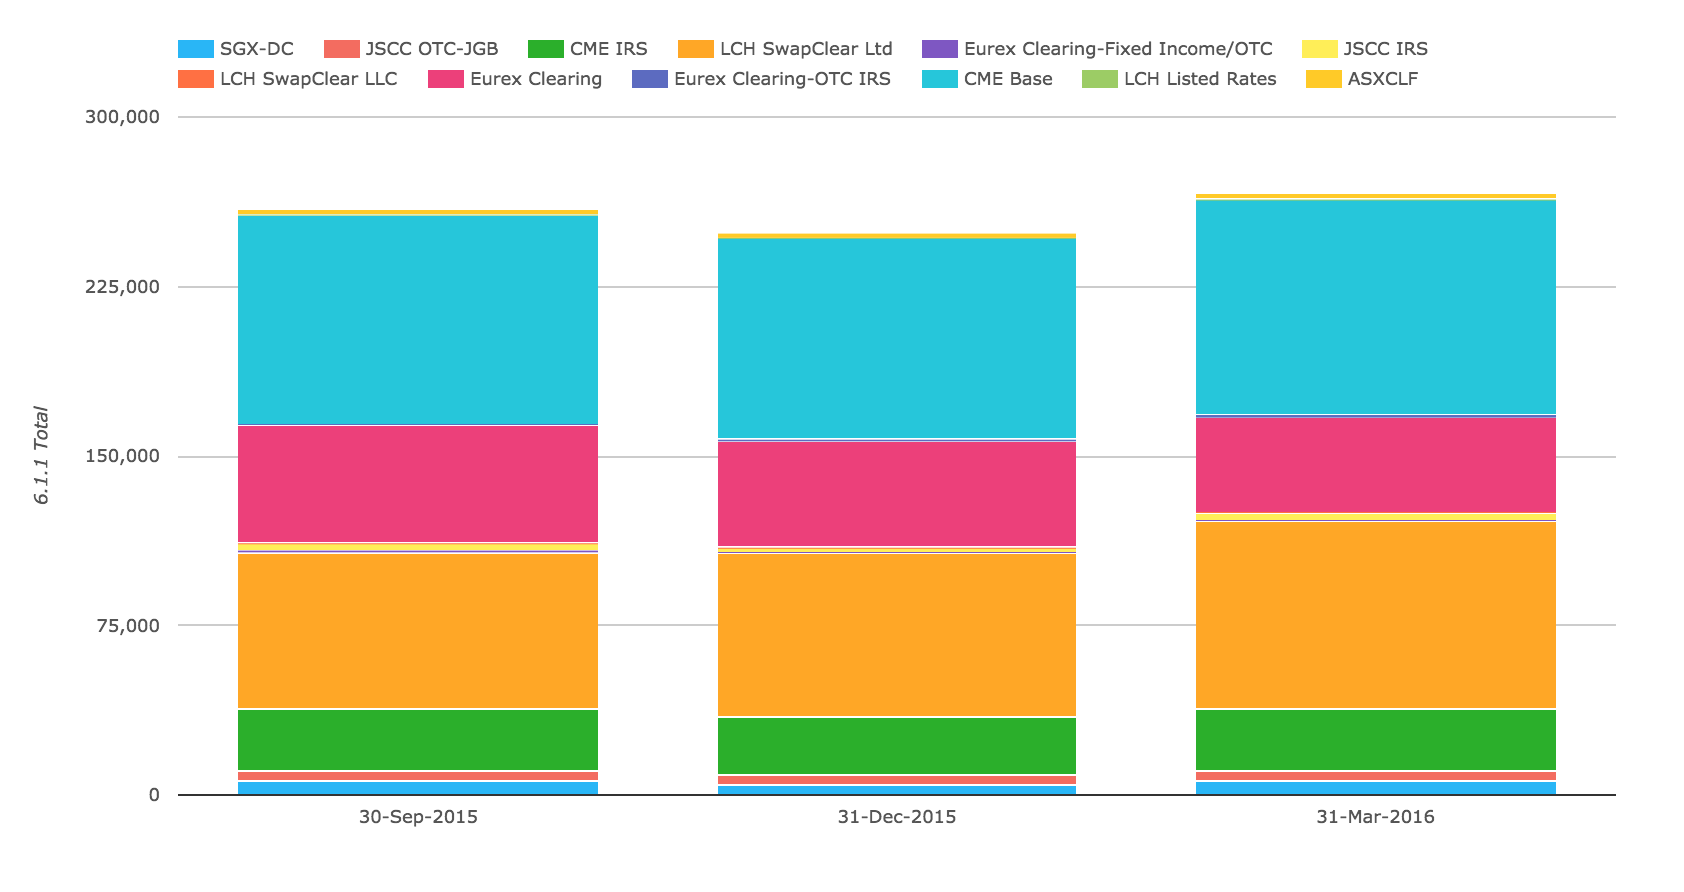
Showing that:
- Total IM across these 12 CCPs is more than $250 billion
- Comparing each CCPs 31-Mar-2016 figures with 31-Dec-2015
- CME Base, the Futures business, is up 7%
- Eurex Clearing, the Futures business, is down 10%
- LCH SwapClear, the Swaps business, is up 15%
- CME IRS, the Swaps business, is up 4%
- Others that register on the chart are JSCC IRS, JSCC OTC-JGB, SGX-DC
Meaning that LCH SwapClear and CME Base are the big gainers in IM over the period and as IM represents the risk of outstanding positions held at the CCP, it is a good proxy for size and significance.
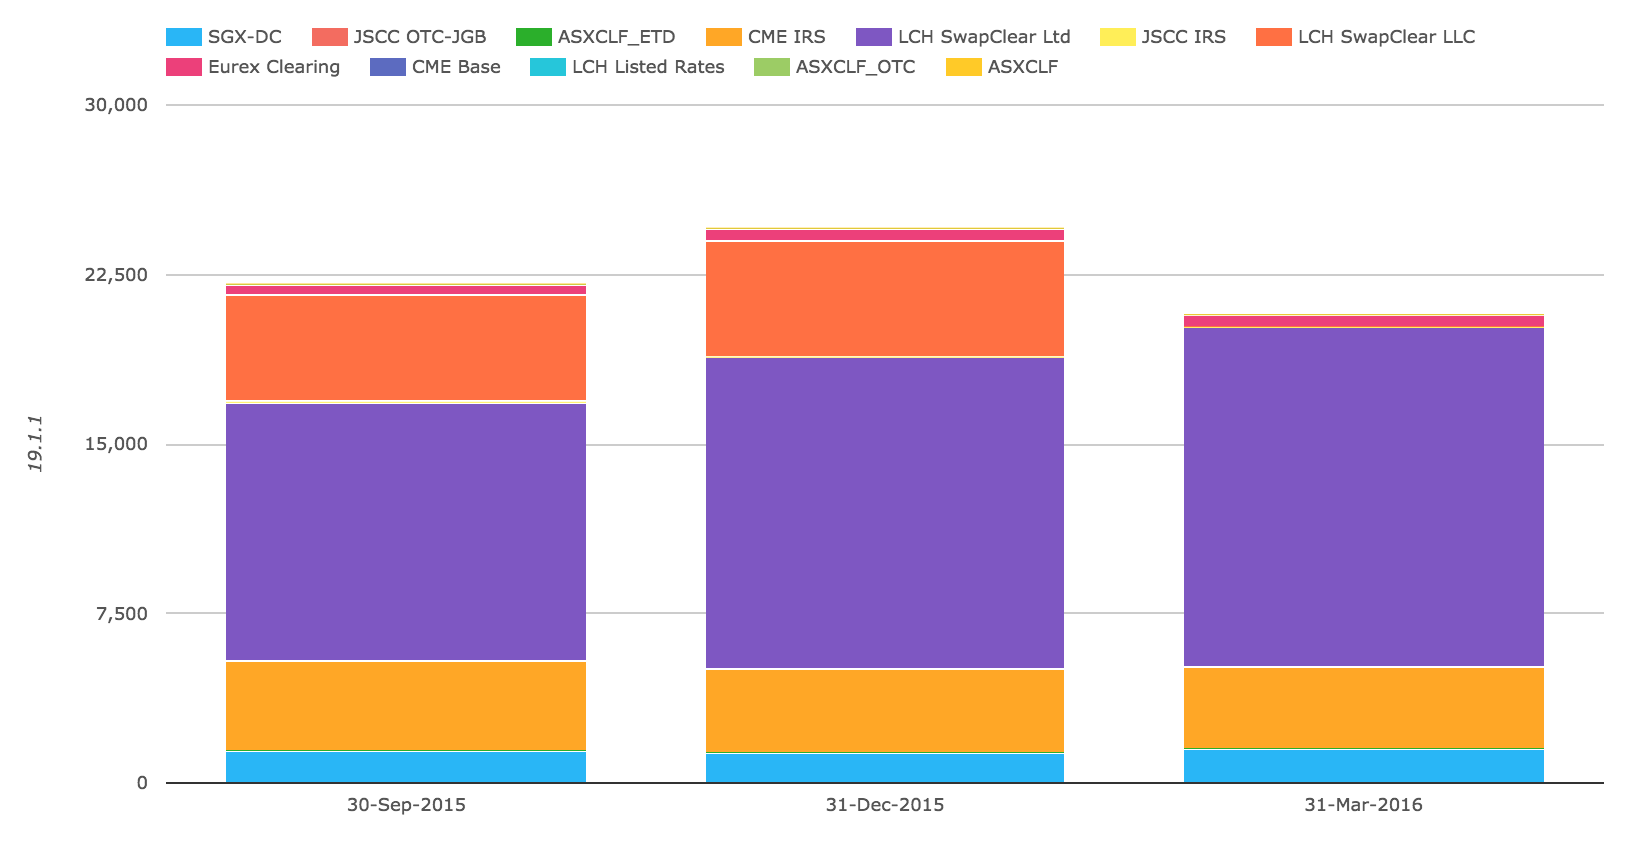
And looking just at Client Gross IM.
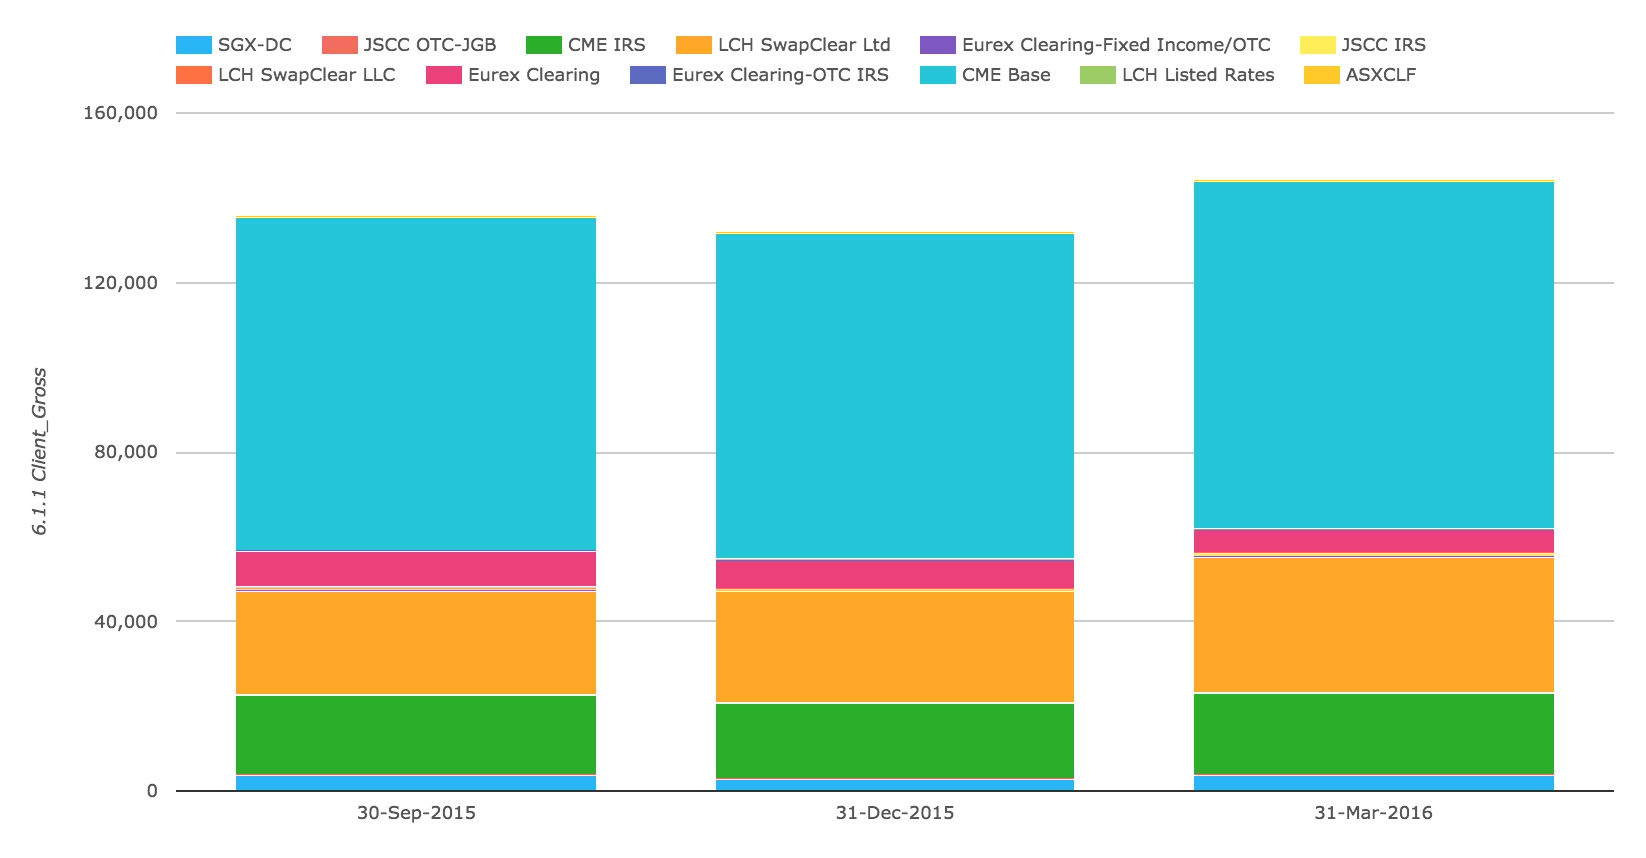
Shows significant increase at both CME Base and LCH SwapClear.
Next Client Net IM.
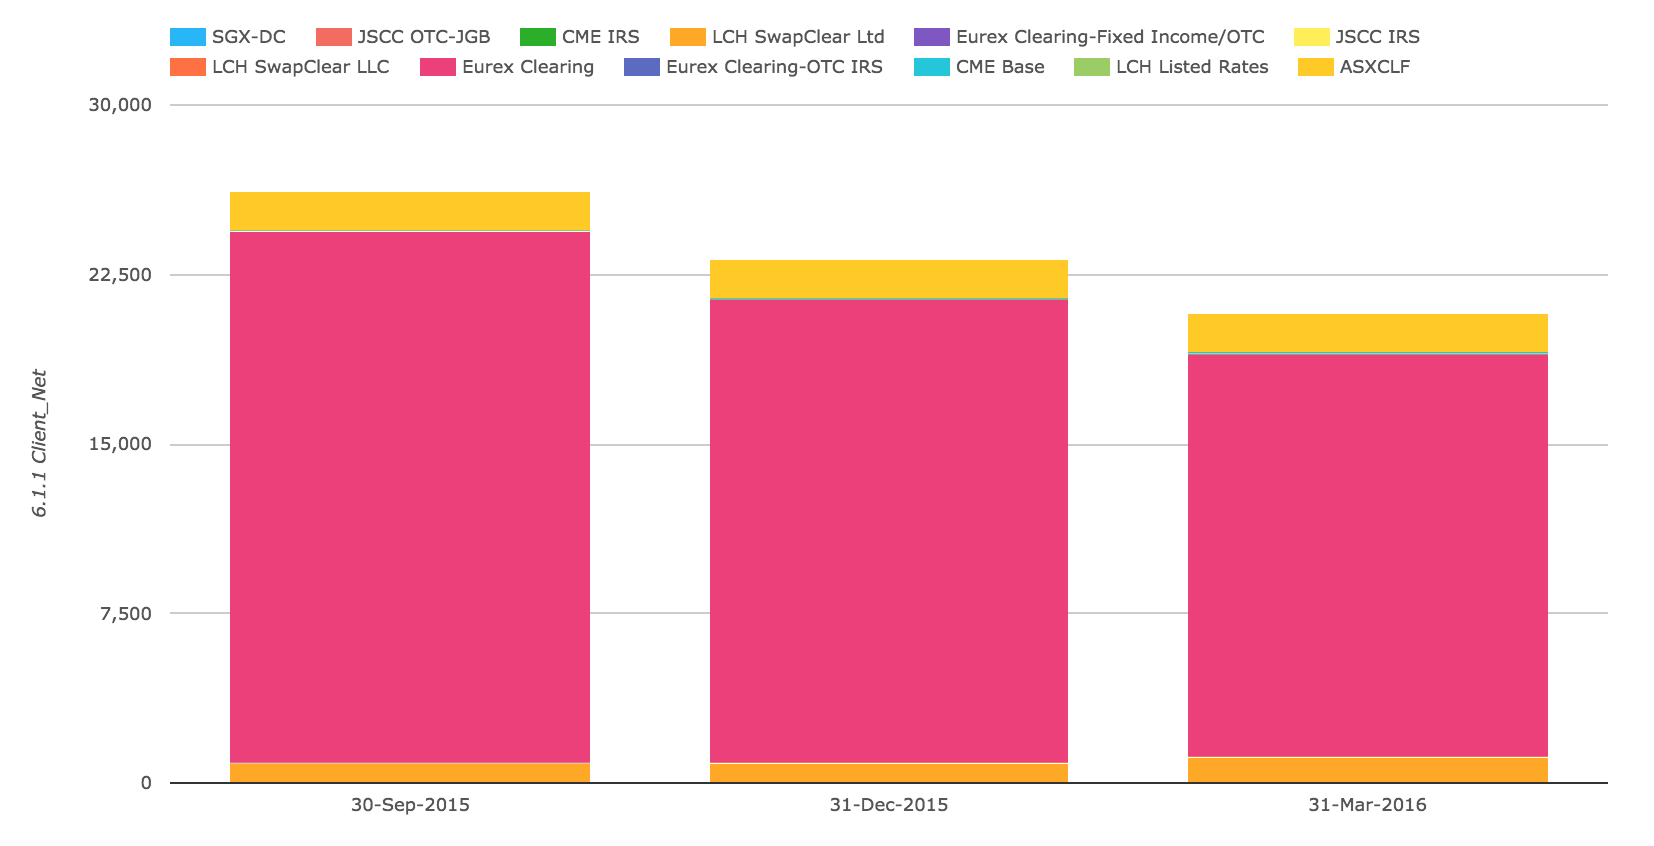
Showing:
- ASX CLF flat each quarter
- Eurex Clearing down each quarter
Is the latter a reflection of clients voting with their feet on Gross vs Net or is it symptomatic of a general malaise in European markets? My guess is the latter.
Default Funds
Next lets look at Default Fund Resources at the same IRD CCPs.
Starting with Pre-funded Aggregate Participant Contributions (Post-haircut Posted).
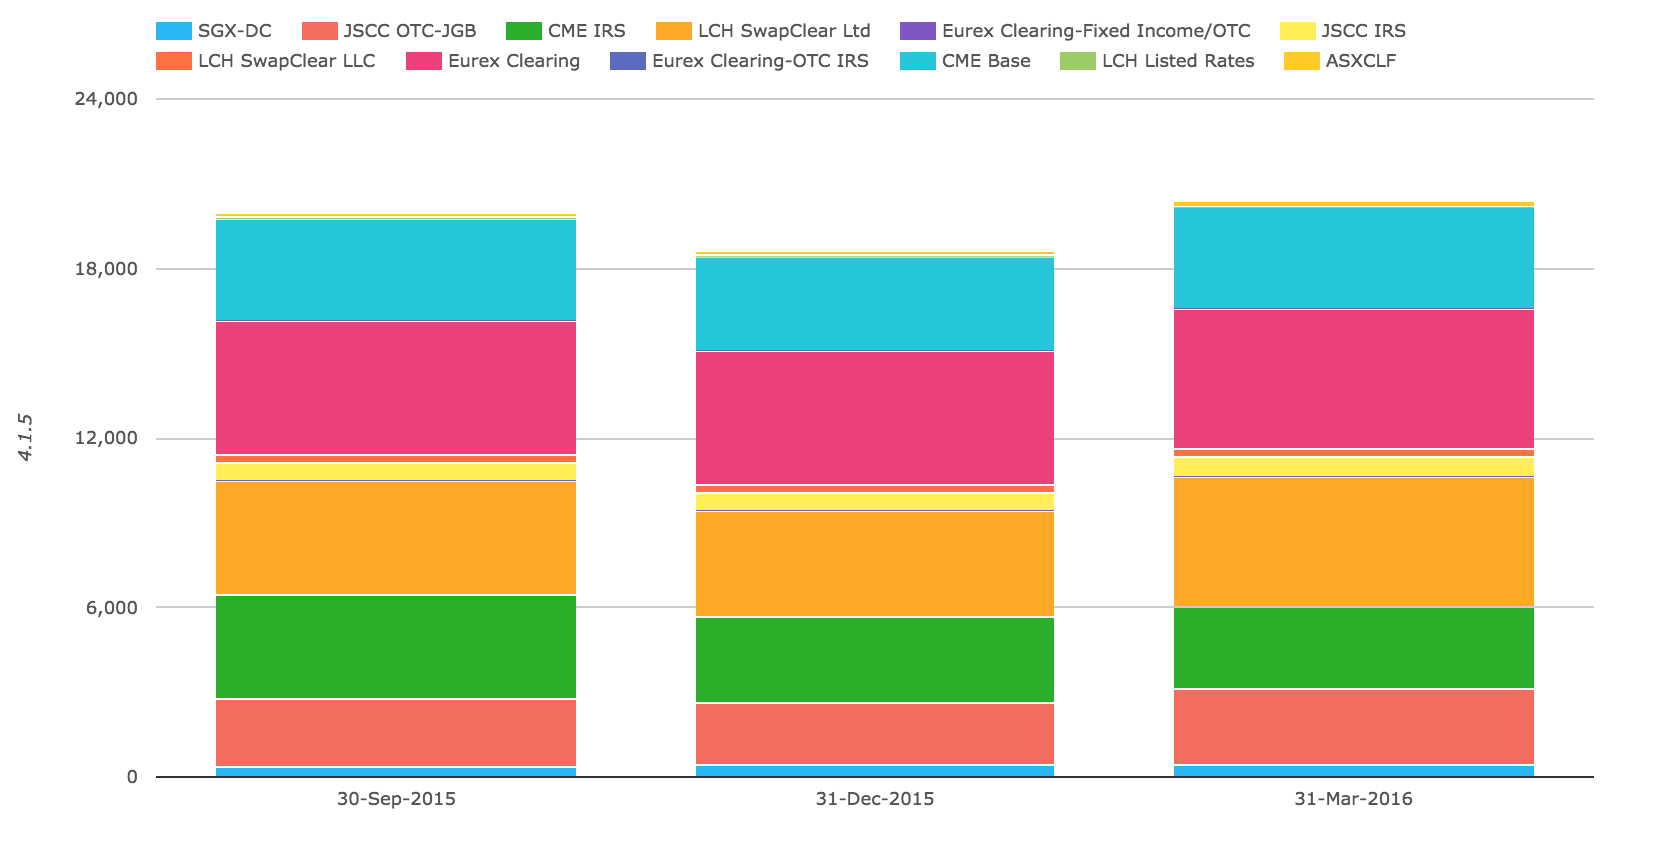
Which again reflects the increase in 1Q 2016 from 4Q 2015 that we saw in the Total IM figures, but differs from that in that the make-up is not dominated by just two CCPs (CME Base and LCH SwapClear).
In addition 31 Mar 2016 Contributions at each CCP are generally higher, unlike the IM chart and total Pre-funded Contributions are more than $20 billion.
Next Committed Aggregate Participant Contributions to address an initial default.
Which at $17.5 billion are similar to the $20 billion of Pre-funded Contributions, but this time dominated by CME Base with $9 billion, followed by LCH SwapClear with $4.6 billion.
Number of Clients
As we approach and pass European deadlines for mandatory client clearing, disclosures on numbers of clients should be an interesting metric.
(Note: Some CCPs report this as the number of client accounts and some as the number of client firms)
Showing:
- LCH SwapClear Ltd increasing each quarter and now with nearly 15,000 client accounts
- LCH SwapClear LLC dropping to zero (we know this service is being shut down)
- CME IRS slightly down each quarter and now with 3,700 client accounts
- CME Base does not report this number
- Eurex Clearing looks like number of clients and is flat at 526 from prior quarter
Initial Margin for CDS
Lets now switch to looking at Credit Derivatives Clearing and the CCPs active in this.
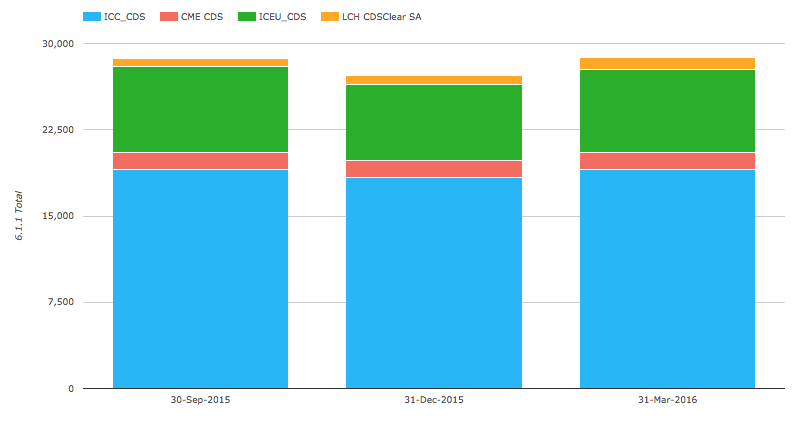
Showing that:
- Total IM across these four CCPs is $29 billion
- ICE Credit Clear with $19 billion
- ICE Europe Credit with $7.2 billion
- CME CDS with $1.5 billion
- LCH CDSClear with $1 billion
And looking just at Client Gross IM.
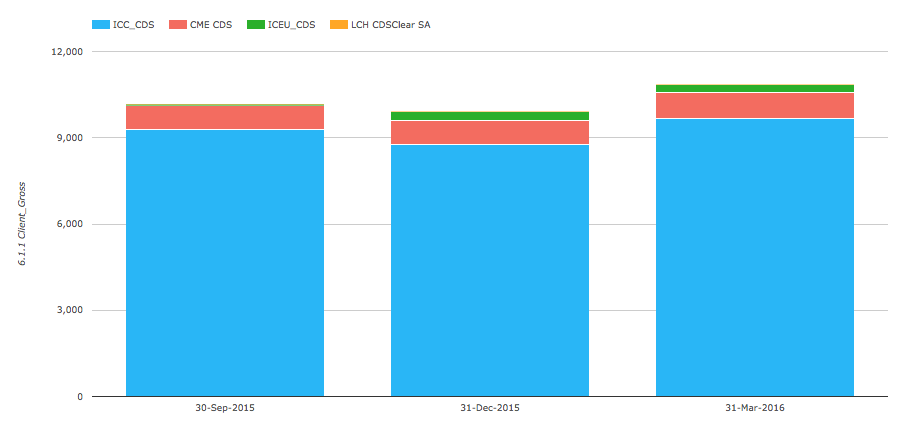
Shows ICE Credit Clear increasing Client IM by 10% between 31 Dec 2015 and 31 Mar 2016 with Client IM now representing 51% of the Total IM.
Final Thoughts
There are a lot more numbers and trends in CCPView.
CPMI-IOSCO Public Quantitative Disclosures by CCPs provide many useful insights.
I will end there for today.