- We look at the SDR data for CDS Index and Swaption trading.
- In Options, we see a lot of Swaption expiries coming up next week.
- For the underlying Indices, there have been record volumes traded during 2016…
- …with Bloomberg’s SEF the number one venue.
Automated Trading in Credit anyone?
I recently saw a nice click-bait title on Bloomberg that piqued my interest:
I was expecting a bit of a block-buster revelation about volumes, akin to the Risk article about HFT in the UST market that garnered so much attention last year. Sadly, it was far less enticing than that. But there are a few nuggets in the story that I thought worth exploring nonetheless.
..the notional volume of credit index options traded has on some days surpassed the volume of trades in the underlying index, according to a senior credit trader at one of the biggest banks.
Obviously, this is our kind of bread and butter at Clarus. Looking at volumes and, in particular, comparing volumes of what trades and where. So I thought I’d test out this assertion in the data.
CDX vs CDX Options
As we’ve discussed in the past, due to the success of CLOBs in the CDS Index space, CDX data is an excellent target for some data-mining. So I was really hoping we’d see similar for Options (“Swaptions”) written on the Index too. Here’s the chart plus the API call:
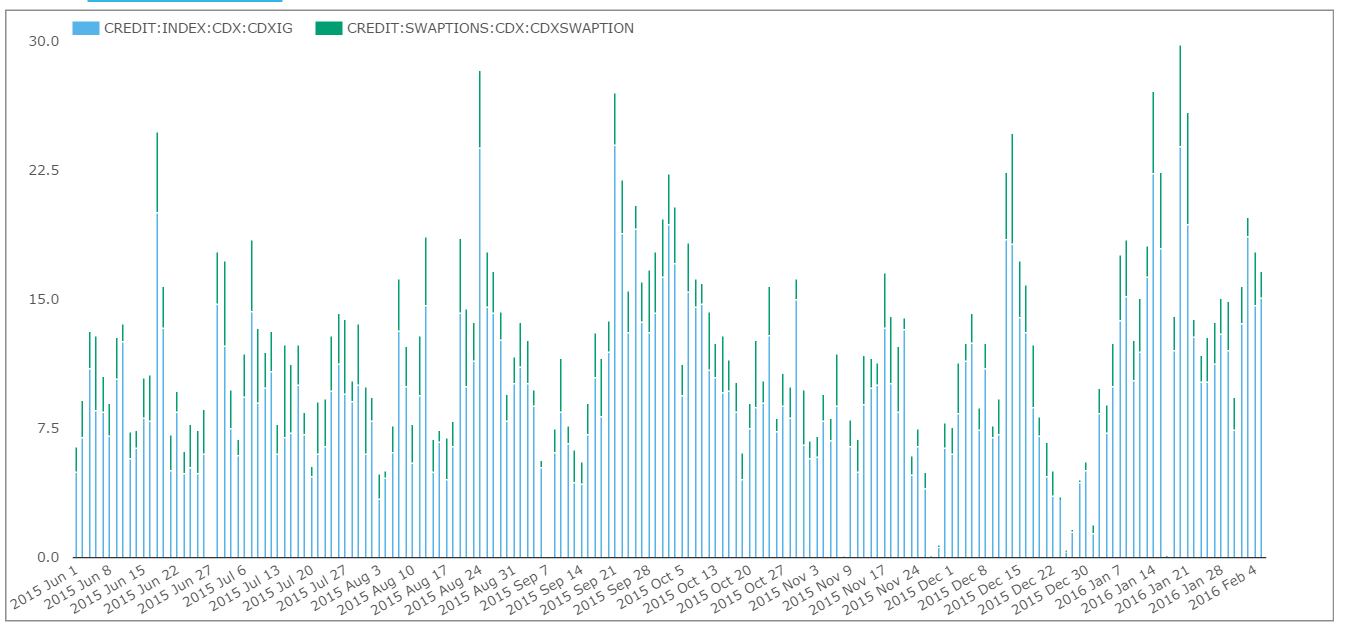
API Call: sdrview.clarusft.com/rest/api/v2/SDRCR.csv?source=BB…….
Showing;
- Far fewer Swaptions traded relative to Swaps on any given day
- As a percentage, the peak volume of Swaptions traded was just over 34% of total CDX-related volumes.
- That’s not to say that’s not impressive! But still, not quite as much data as I was hoping to delve into.
Other Indices
To be fair, the assertion that Swaptions may trade more than the underlying Index can be upheld in some circumstances. Bear in mind that;
- We don’t necessarily see the whole market in our data
- The above analysis is on the most liquid indices.
The second point there turns out to be key. When we look at some of the iTraxx indices, we do see a different story:
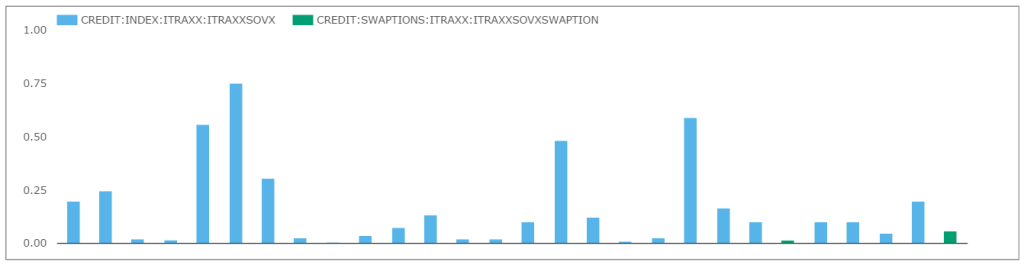
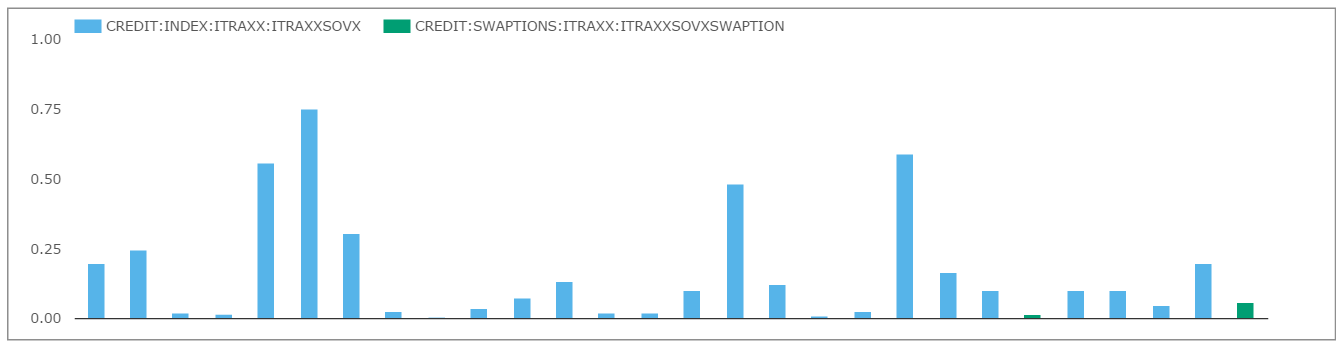
Itraxx Australia

Volumes for iTraxx Australia Index and Options written against that Index are shown on the right. The chart shows;
- On a select couple of days in the six month window, we did see Swaption volumes out-strip the underlying Index volumes
- For example, on July 17th, Swaption volumes were 79% of total volumes traded.
- Swaption volumes out-stripped the underlying Index volumes on 4 other days as well
-
iTraxx SovX: Click to enlarge And this can be seen in even less liquid offerings, such as the iTraxx SovX Index which, truth be told, hardly ever trades in either Swaption or Swap form (chart to the right).
Still, as Bloomberg say in their article;
From the widely used Markit CDX index tied to credit default swaps (CDS) on junk-rated companies to options written on that index, as well as total return swaps (TRS) linked to Markit’s iBoxx cash bond index—investors now have a bevy of exotic, alternative instruments to trade the asset class.
This is certainly true – all you have to do is look at the drop-down list in Clarus of the Indices traded to have a sense of how wide this Universe is:
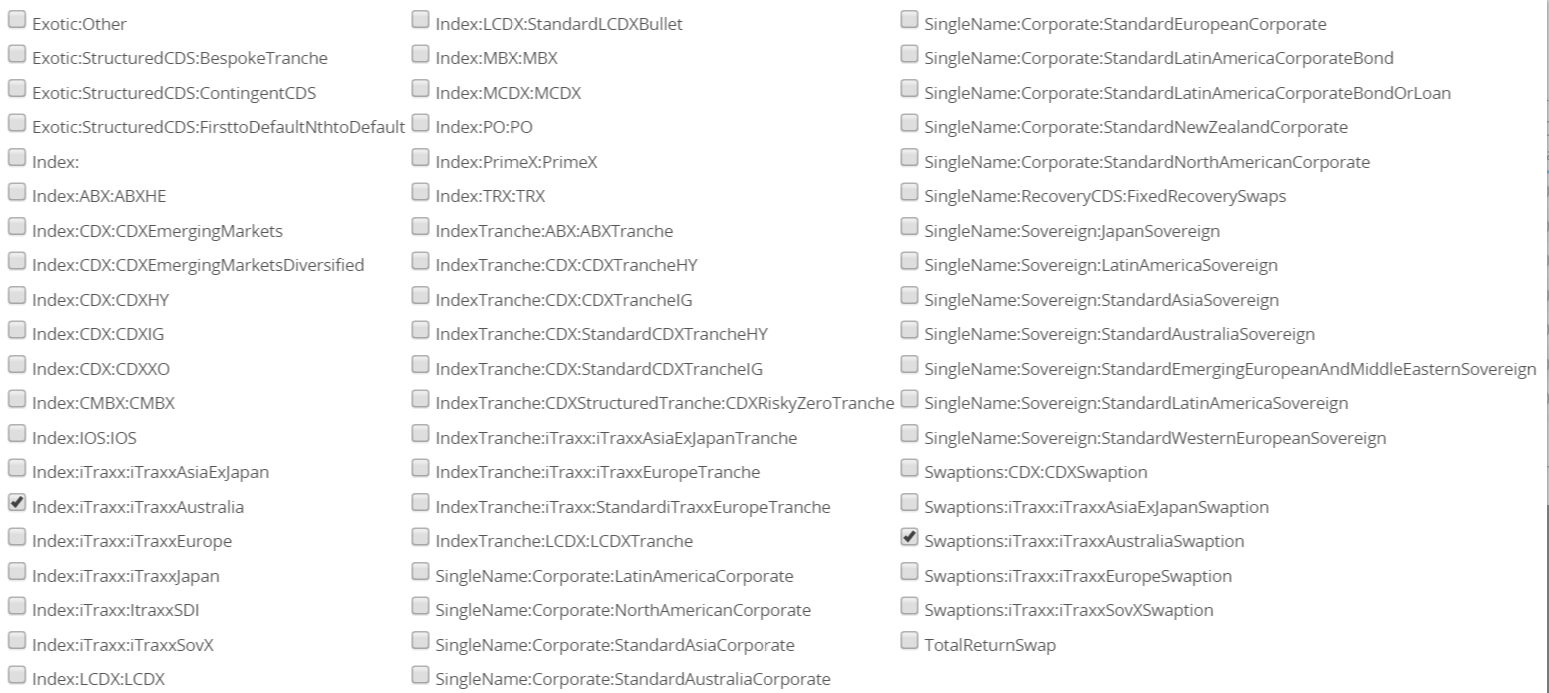 Thankfully, Clarus curate all of that data and make it easily accessible. Even for a Rates trader like myself, we can make sense of this huge Universe of CDS data in a relatively straightforward manner.
Using that Data
First up, the CDS Swaptions data. We do have a couple of caveats, as this week we’ve noticed the following in the data:
- The Swaptions data isn’t that clean
- Why don’t we improve the accessibility of the data and just make everyone report prices as Points Upfront or Traded Spread? The Swaptions data is full of Percentages/Prices/UpfrontPoints quotation differences – which are simple enough to convert using the ISDA/Markit standard methodologies outlined here, but it seems strange to make this a two-step process. Isn’t the whole point of data reporting to aid transparency?
- Feel free to contact us if you think Clarus should be doing this within our Credit feed. This is the kind of thing we’ve been doing for the Rates market and people seem to love.
Data Visualisation
Still, there’s always time for some kind of fun with the data, right? So let’s take a quick gander at the volumes that have traded across expiry dates and strike prices for just a subset of the data – namely the CDX.NA.IG.S25 Index this year:
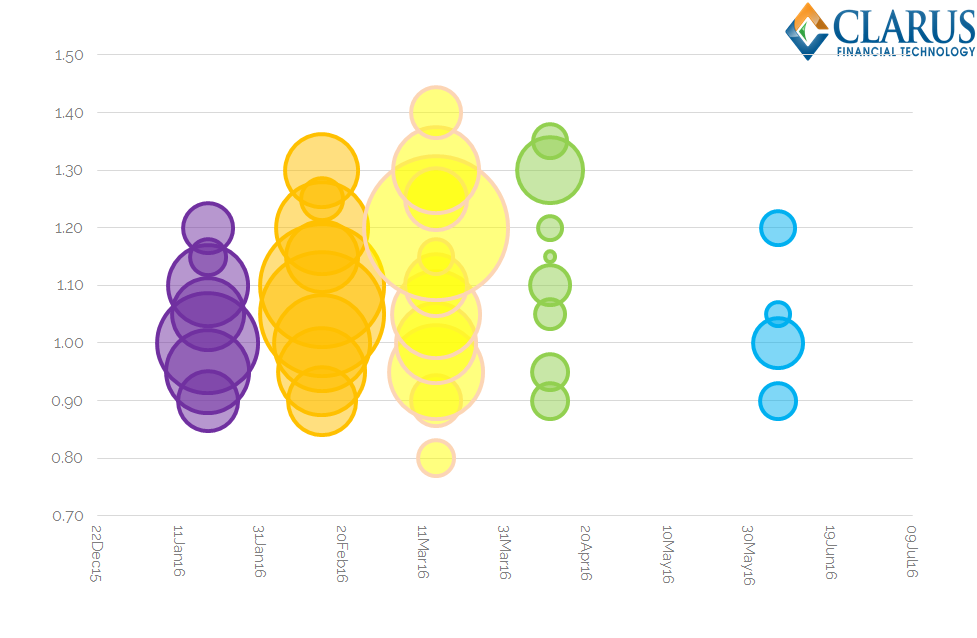
Showing;
- Swaptions traded on the CDX.NA.IG.S25 Index in 2016
- Expiry date on the horizontal axis
- “Strike Price” on the vertical axis (% of notional, “points upfront“)
- The size of the bubble represents the volume (i.e. notional value) of the Swaption
- Puts and Calls are summed together
- This is a subset of Swaptions traded, which follow the convention of a “TradedSpread” for the underlying Index.
- We are looking at $17.5bn notional of Swaptions traded in the past month.
- The week beginning 15th Feb 2016 (i.e next week) sees the largest notional of expiries, at $6.2bn.
- With the correct analytics, we could even calculate the delta of these Swaptions expiring next week. That might prove interesting given current price action in credit markets.
- The week beginning 14th March is a close second, with $5.7bn expiring.
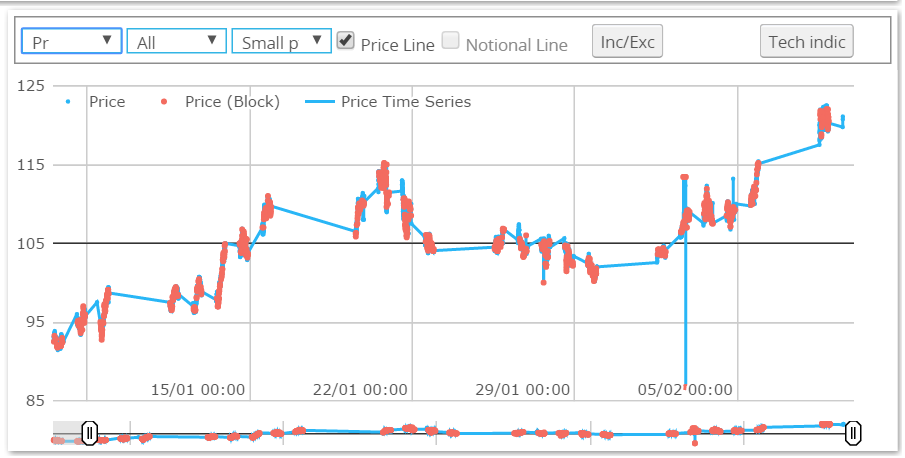
- It’s also worth noting the price evolution this year, as everyone seems to be talking about CDS this week:
And what of the SEFs?
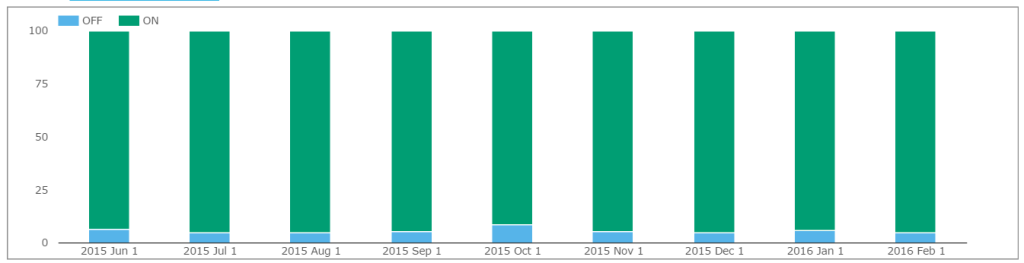 We really can’t talk about CDS trading without talking about Bloomberg’s SEF. Whilst most of the CDS Swaptions trade Off-SEF, over 95% of volumes for vanilla Index trading are traded On-SEF each month (chart to the right).
When we look at SEFView, we can see that Bloomberg are the dominant SEF. And recently they appear to be successfully extending their lead in this space:
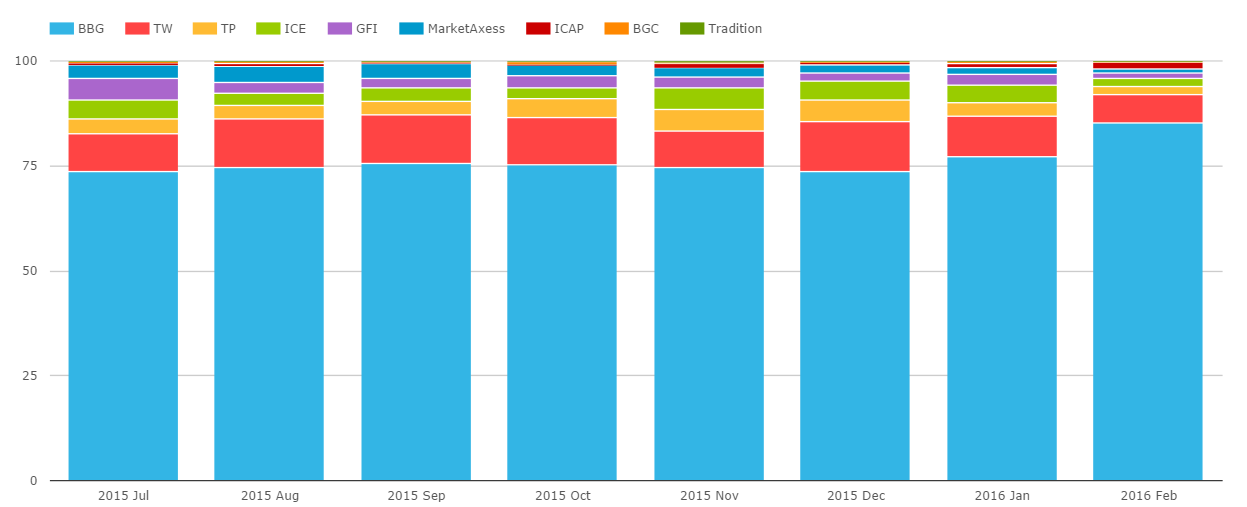
Showing;
- Bloomberg number 1 by a long-way, Tradeweb second and the “D2D” platforms a long way behind.
- Bloomberg were just below a 75% market share for a long-time, but it looks like January saw them break that high-water mark and February has got off to a great start for them (very early days).
Generally speaking, BSEF has seen some huge volumes in 2016 go through in Credit trading, enjoying a 95% market share on some days.
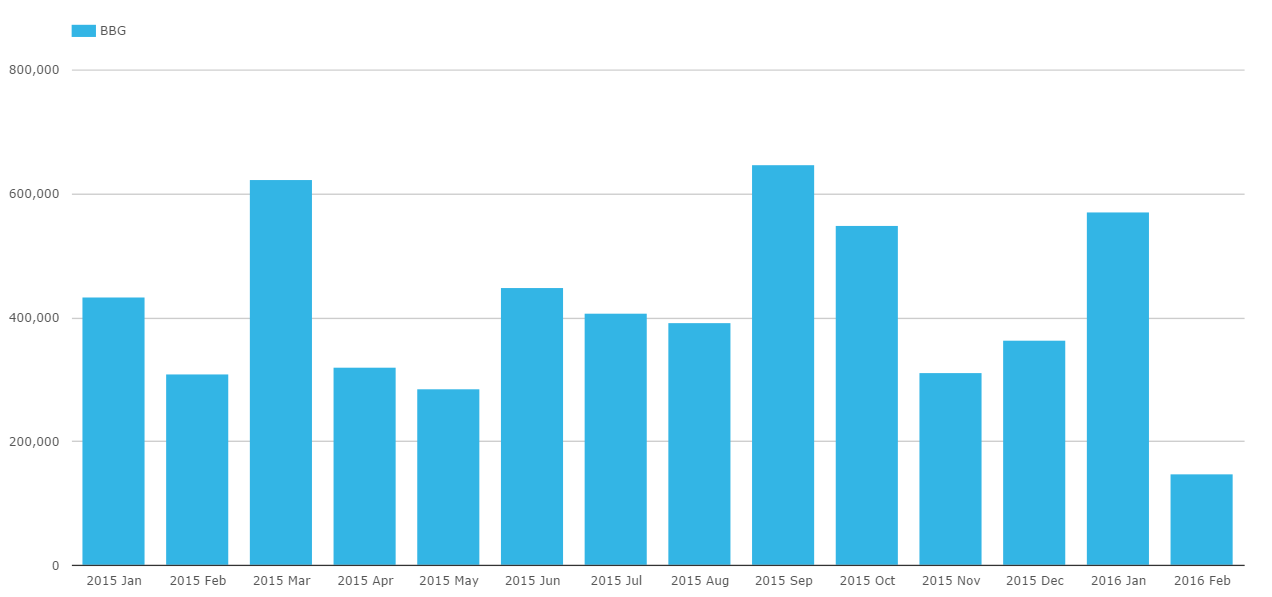
Looking at the BSEF time-series for the past year, January 2016 was a record-ever month (excluding the Index roll months of March and September):
In Summary
- We explore the CDS and CDS Swaption data reported to the SDRs and by the SEFs.
- CDX Index volumes continue to be impressive, with a smaller CDS Swaptions market also active.
- Some of the less liquid CDS indices can see greater volumes in Swaptions trade than the underlying index on particular days.
- Around 95% of CDS Index trades occur on-SEF. For Swaptions, around 90% occur off-SEF – probably due to their more structured nature.
- Bloomberg SEF is a marker leader by a long way.
- It is notable that 2016 has seen a pick up in volumes at BSEF.
- Next week sees a lot of Swaption expiries on the CDX.NA.IG.S25 Index. That may cause added volatility.
- It will be interesting to see if BSEF can hold on to their recent gains in market share….
- …the data will reveal all. Contact us about any of our Clarus products here.