February 27, 2014 was the Made Available Trade (MAT) determination date for CDSIndex contracts based on the TradeWeb submission. Similar to my recent article on Interest Rate Swaps, I will look at what the volumes show.
Which products are MAT?
Two North American Indices: CDX.NA.IG.5Y and CDX.NA.HY.5Y
Two European Indices: iTraxx Europe 5Y and iTraxx Europe Crossover 5Y.
For all of these, the current on the run series and the preceding series.
Before and After MAT Date
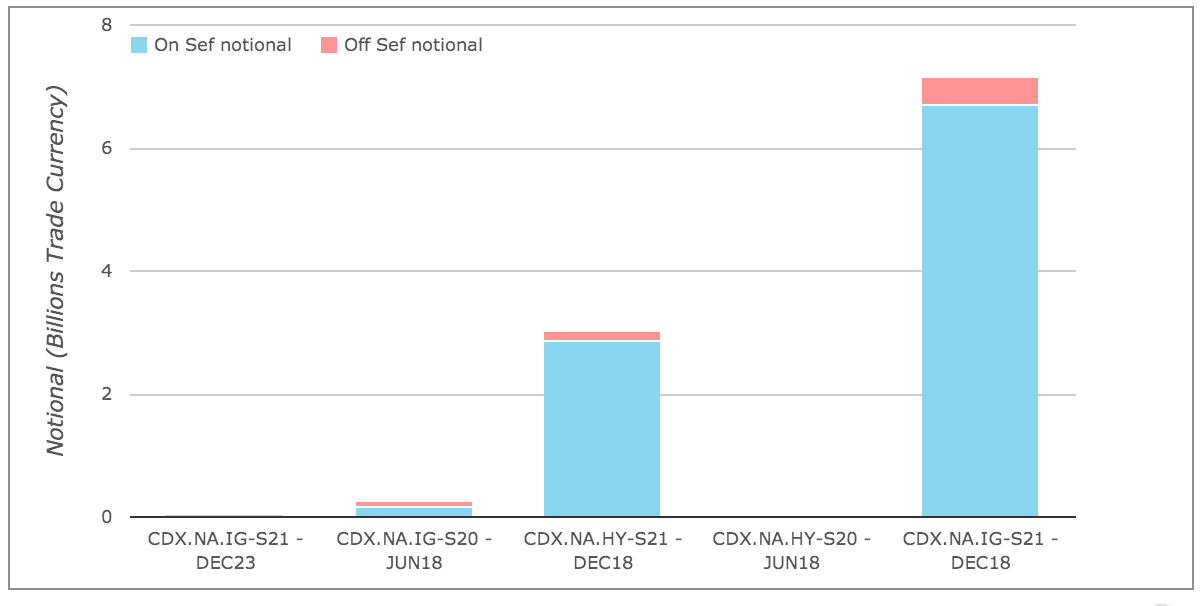
Lets start with two charts from SDR View Professional, the first for Feb 7, 2014 (before MAT) and the second for Feb 28, 2014 (1 day after MAT) for Cleared trades in the two North American Indices.
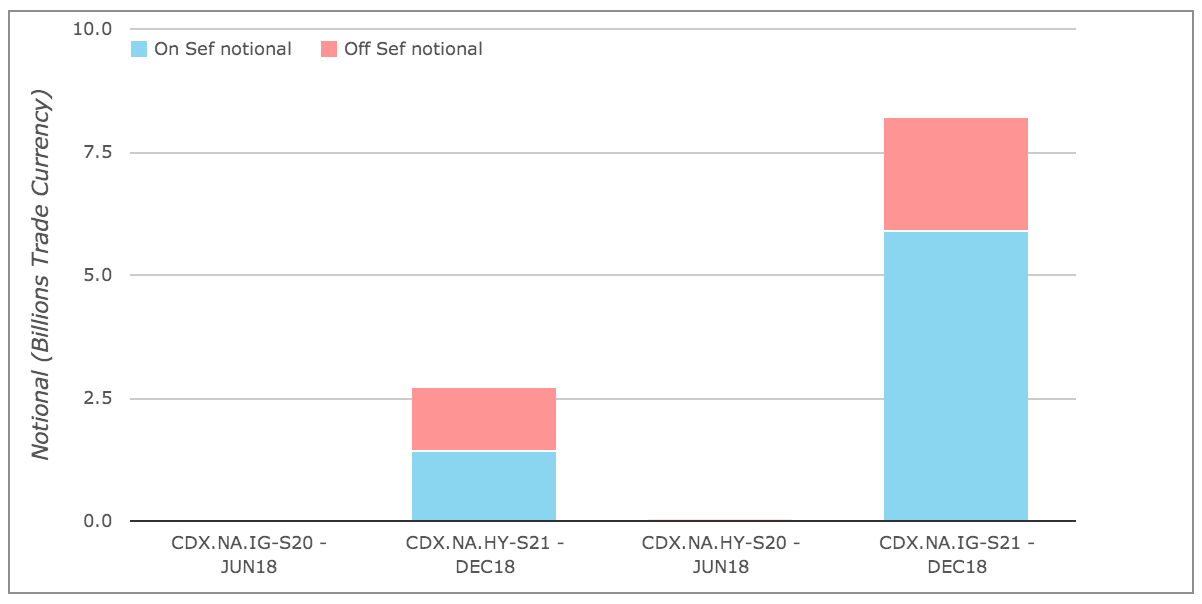
These show:
- What we would expect to see
- A sharp reduction in Off SEF, down to close to zero
- Lets look at the figures in more detail
- There is tiny volume in the preceding series (S20)
- On 7Feb there were 5 such trades of $49 million notional
- On 28Feb there were 4 such trades of $270 million notional
- While for the on-the-run series (s21)
- On 7Feb IG is 147 trades of >$8.2 billion and HY is 168 trades of > $2.7 billion
- On 28Feb IG is 156 trades of >$7 billion and HY is 173 trades of > $3 billion
- So similar volumes
- However the percentage of On SEF vs Off SEF is very different
- On 7Feb for IG this is 72% On SEF and 28% Off, while for HY it is 52% to 48%
- On 28Feb for IG this is 94% On SEF and 6% Off, while for HY it is 95% to 5%
- So a great improvement
The only question is why is it not 100%?
Why are there 7 IG trades of $450m and 8 HY trades of $162m?
Drill-down to the trades (not shown) does not give us any clues.
A few are block trades, a few capped, others standard, so nothing obvious.
I am not aware of any exemptions on these contracts.
So we can either assume a mistake in the reported SDR data or mistakenly executed Off SEF.
Which SEF has the volume?
A burning question we are often asked and one that is not possible to answer from the SDR public dissemination feeds.
However our new SEFView product, which sources data from each SEF itself, is able to answer this question.
Lets do so for the Feb 28 date for the North American USD indices (for convenience I am including a third contract; CDX.NA.EM.5Y)
Firstly from SDRView for 28 Feb we can see:
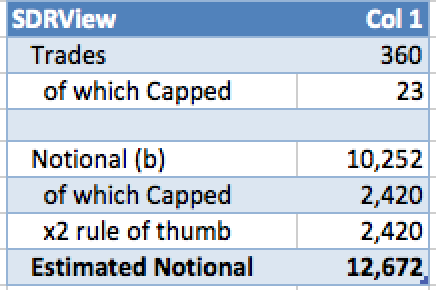
As there are 23 capped trades with $2.42 billion notional and the capped size for IG is $110m and HY $100m, we know that our $10.252 billion figure is an understatement of the real traded notional.
As a rough rule of thumb lets just double the capped notional of $2.42 billion, to come up with an estimate of $12.7 billion.
Now what do we get from SEFView for the 28-Feb?
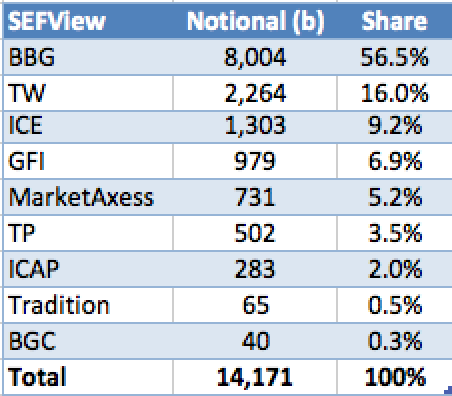
From which we can see that using SEF reported figures:
- The actual gross notional traded was $14.2 billion
- As opposed to our SDR estimate of $12.7, so close but could be better
- If our rule of thumb was 2.75 and not 2.0
- More importantly, we can now see market share on this date
- Bloomberg dominates with $8 billion or 56%
- TradeWeb follows with $2.2 billion or 16%
- ICE with $1.3 billion or 9%
- GFI with $0.98 billion or 7%
- And so on
- Just one day, but of course we could do for another or a longer period.
- (remember this excludes Tranche & Option products).
Wrap Up
I could do the same for the European Indices or indeed look at different days or weeks.
However as my 2pm deadline is fast approaching, I will leave that for you to do yourself.
Just login into SDRView Professional.
In summary, the MAT date for CDS Indices is past.
Volume show that 95% of these are now On SEF.
The remaining are either mistakes in the data, laggards or exempt(?).
Your view in the comments please.