An interesting week for SEFs. The Tradeweb MAT self-certification went into effect last Wednesday, and MarketAxess’ on Friday, so we now have the 4 primary CDS Indices made available. It appears to have been a fairly active week.
Lots had been said about Swap activity after the first MAT week. Headlines were that swap volumes were down between 30% and 50%, depending upon what criteria was used (USD or all currencies, all asset classes, or just IRD, or just vanilla IRD, etc, etc). I even had an old friend call to say that after reviewing the trade data over the past couple months, he is planning to leave the industry!
DATA
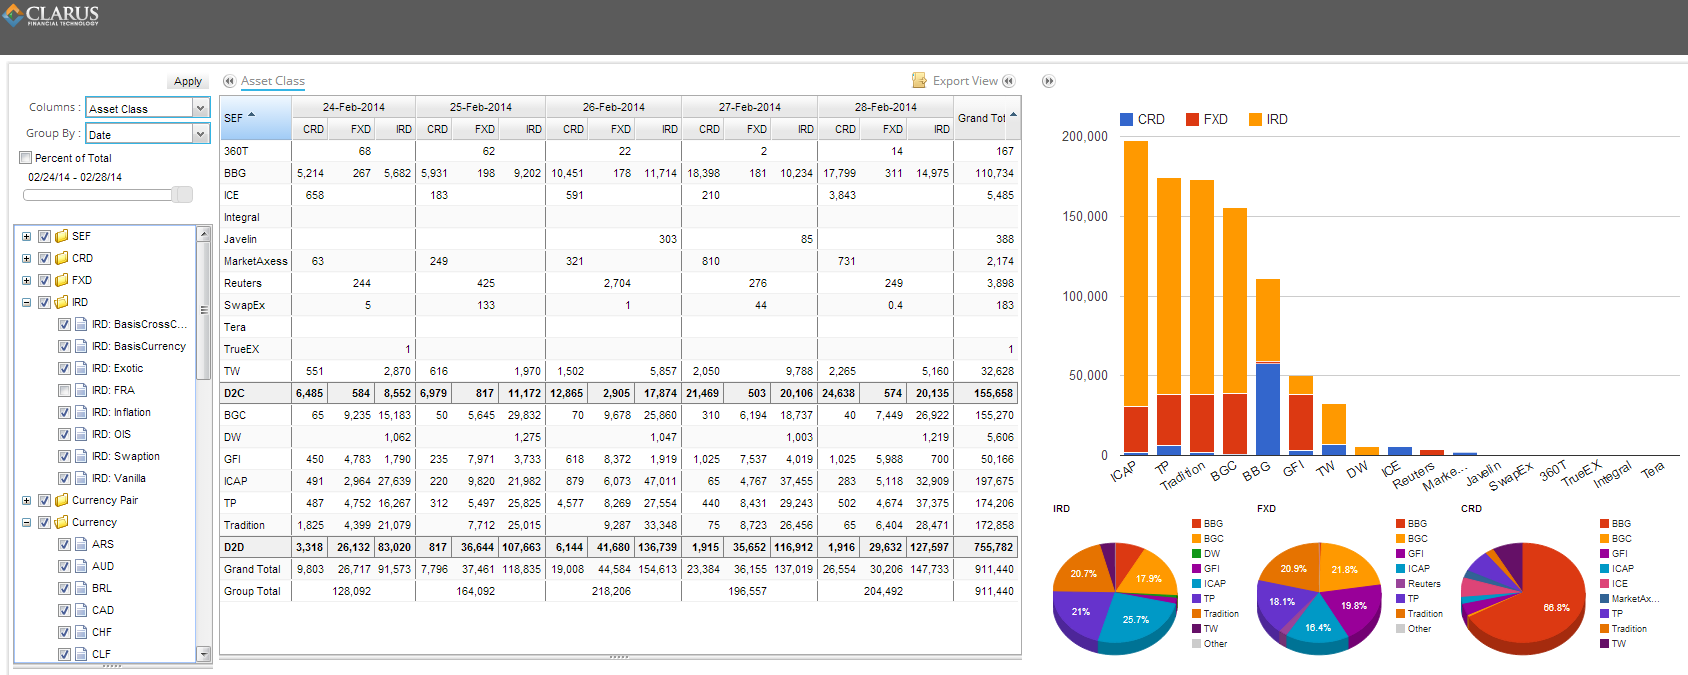
We’ll start with daily data for last week.
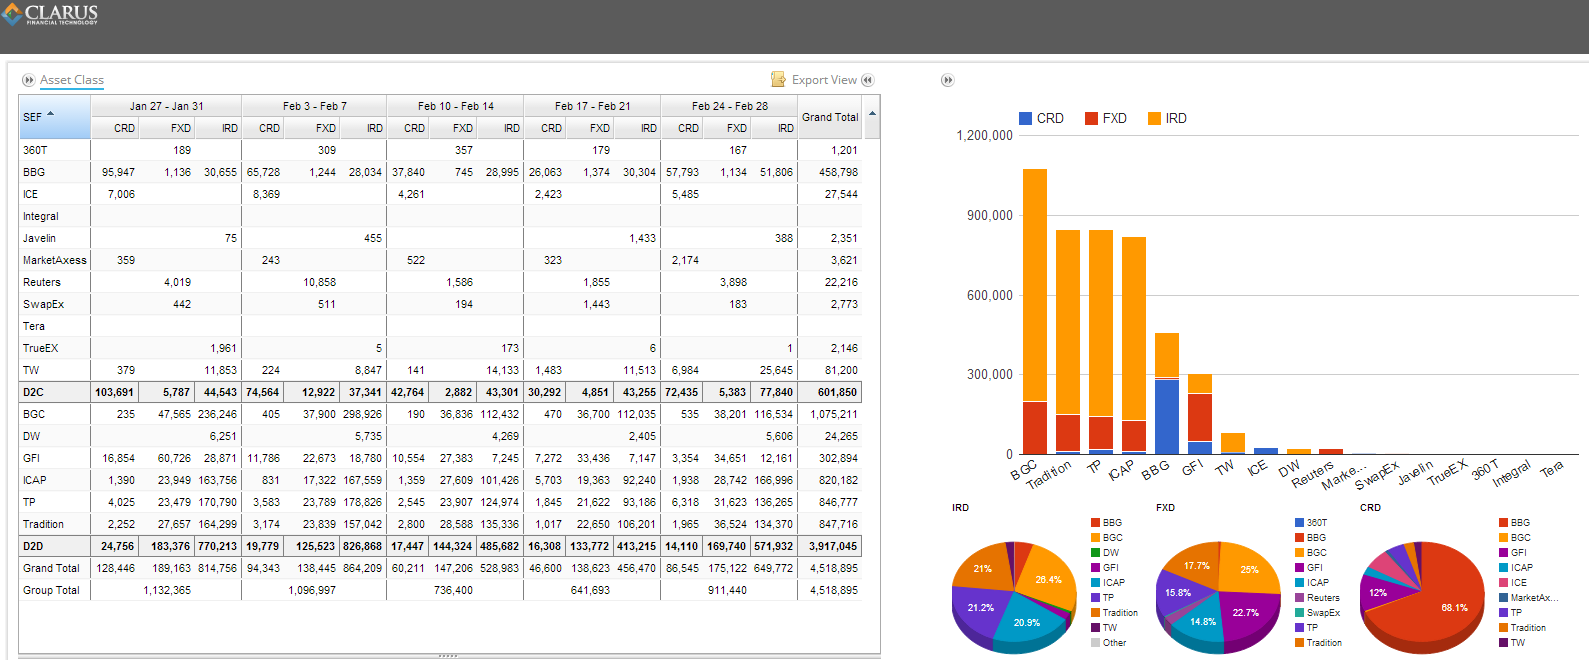
And to gain insight into any recent trend, a 5-week analysis:
WHAT DOES THIS SHOW?
Looking at the data:
- Overall activity seems to have headed back towards the recent mean across all asset classes.
- Credit Derivatives seemed to perk up on the Wednesday MAT date.
- We’ve seen the CDS disparity between legacy D2C and D2D platforms as a general trend, but this week was probably the largest percentage of CDS activity on D2C vs D2D.
- Bloomberg continued their strength in credit, but good showings collectively from ICE, MarketAxess, and Tradeweb
RECONCILING SEF & SDR DATA (aka How large are block/capped trades?)
A lot goes into compiling, parsing, and normalizing the data we publish on SEFView. There are some “gotchas” that I have been fairly vocal about in my blogs over the past few months. As such, one thing we like to do before pushing the data out to the world is to give the data a good sanity check. Over time, this has led to SEFView data becoming cleaner and more robust. We’re always trying to improve the parsing of the SEF data.
The fundamental sanity check we perform is to reconcile the weekly SEF data with the weekly SDR data. The variance between these data sources for On-SEF data is typically on the order of 10%, with SEF data being the larger of the two. Anything larger and we investigate, which typically results in one of:
- We conclude that there were some large block trades (more accurately, large capped trades)
- We find a nuance in the parsing of the SEF data that needs tweaking
- An email to a SEF asking them why we cant find their trades in the SDR!
It’s interesting to explore the first point. Block trades. If you are an active reader of our blogs, you will have read a blog by Amir talking about the cap trade rule in SDR reporting. The brief “Cliff Notes” version is that the notional amounts on public SDR reported block trades are capped at a threshold to limit the visibility of the true size of the trade. What this means is:
- Public SDR data should always understate the actual notional of the market (assuming a single capped trade went through)
- You can use SEFView (albeit time-delayed) to see the actual sizes of traded positions.
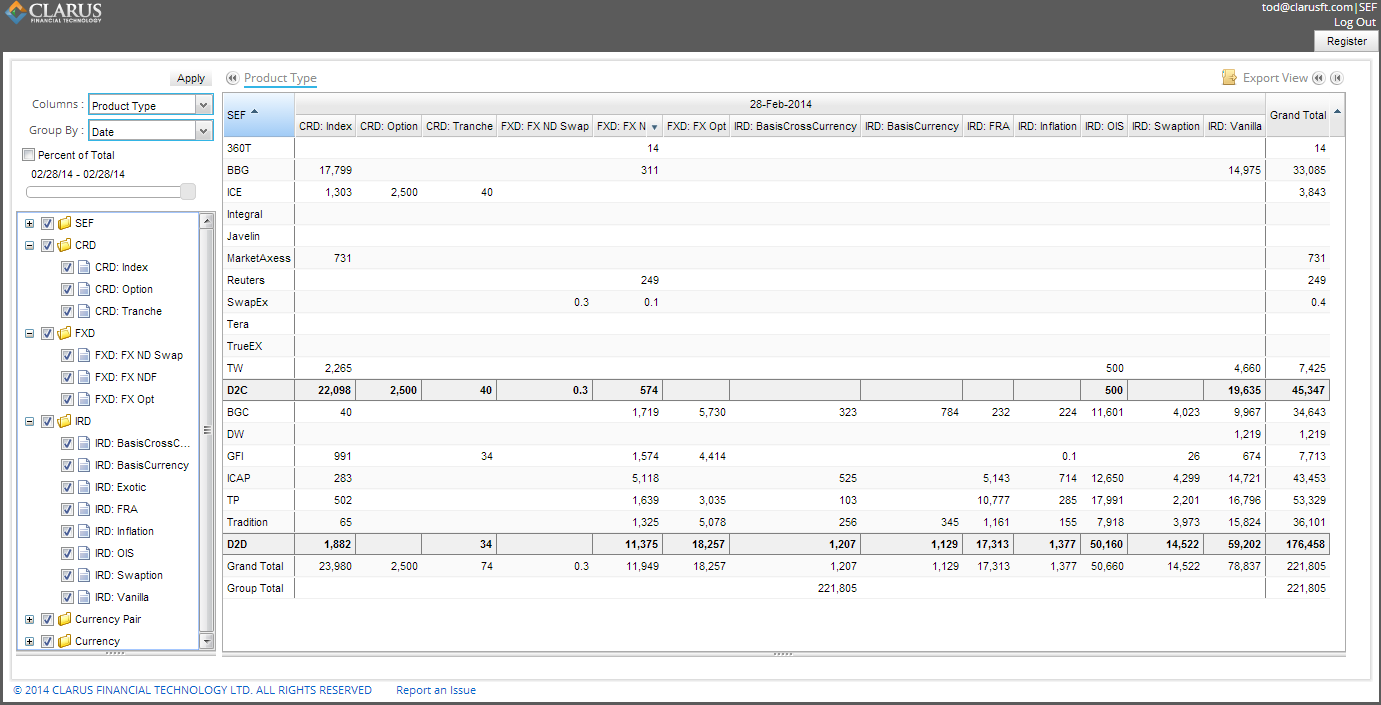
I say positions, as you may need to exercise some further analysis to get to the bottom of the average block trade size. Lets take an example, below. On February 28th, our reconciliation of CDS was out by nearly 2 billion USD. First, we look at SEFView and see $2.5 bn of CDX Options (the second column over, for ICE):
Using SDRView, we look at all On-SEF options, and see only $550 million, across 5 trades:
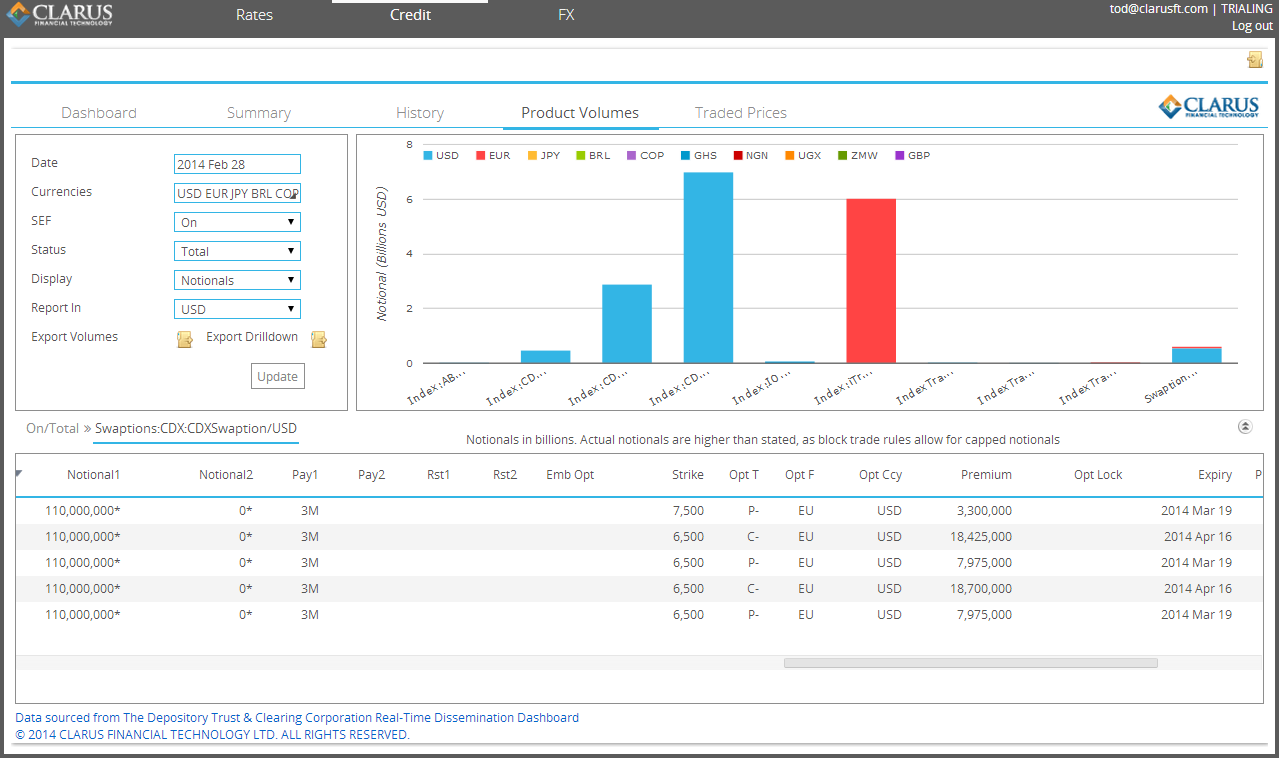
How do you reconcile $2.5 billion with $550 million? First, note in the SDR screen above that each of the 5 trades has a notional ending in an asterisk (*). This denotes that the trade was capped. Next, using SEFView again, we drill into the 2500 number for options, which were all transacted on ICE:
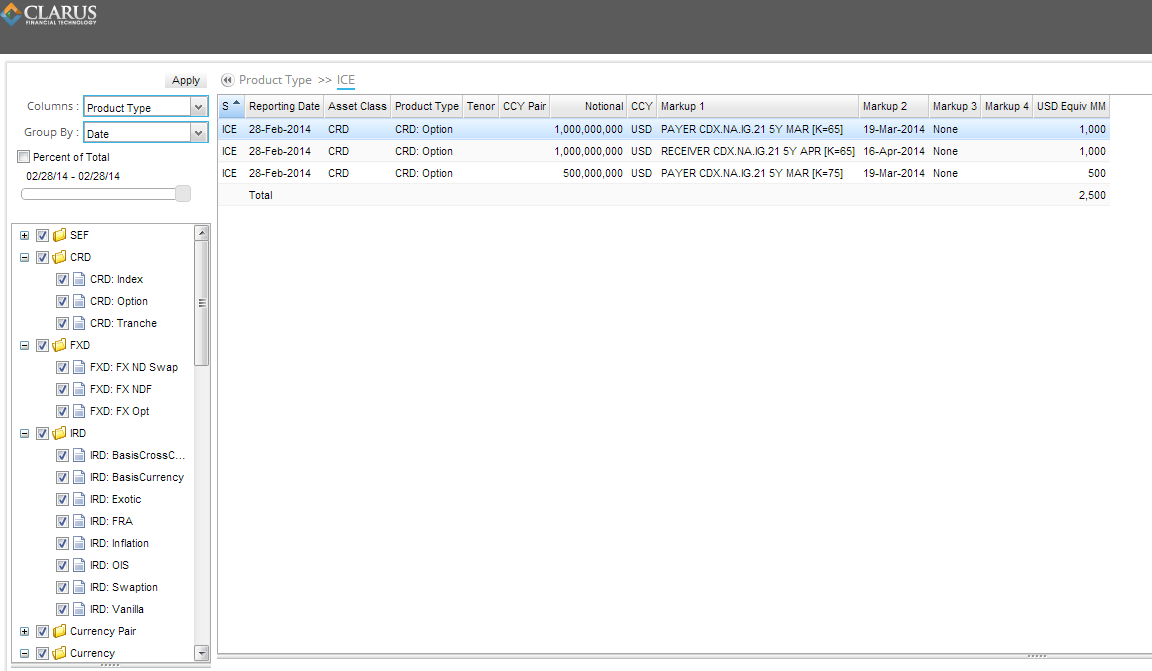
Here you can see the 75 strike March 19 option that SDR listed as $110,000,000 (capped) was really a $500,000,000 trade. The other two lines reported by ICE, one would assume, then account for the 4 total April and March 65s reported in SDR, with each $110mm SDR trade equating to a true $500mm trade.
The data is there, you just need to find it.
NEXT WEEK
Both Amir and I will be attending FIA next week, so please stop us to say hi. Given that, we might see a dropoff in our blogging activity. Or you never know, it could give us lots of material.