With the release of CCPView, we now have a great tool to monitor OTC clearing data.
CRYING FOUL
My previous articles on the topic of clearing data garnered a lot of comments from folks surprised by some of the data we can see when we start tearing off layers of data. In each of these articles, I began with diagrams demonstrating how LCH dominates the cleared interest rate swap market, and then proceeded to whittle that down in an attempt to shine some light on any of the other clearing houses.
The folks making these comments have had a valid point. LCH has been at this for a long while, clearly dominates cleared rates OTC, and in today’s Basel III / LCR world, they are actively innovating services in an attempt to reduce Open Interest. They have long had Tri-Optima’s service for multi-lateral compression, and have more recently ushered in new compression/blending services to bring these benefits to more parties.
It made me wonder about a possible a new, more accurate metric. We all know that “Activity” shows throughput, and “OI” shows how much of that activity is currently being housed. A “compression” metric could be interesting to look at, and we are occasionally made aware of these numbers through press releases and marketing campaigns, but is not a normally publicly disseminated value that we can monitor. So, given the pressures on swap line items, I thought it would be appropriate to also look at not just Activity, not just OI, but the relationship between these two measures.
I’ll come back to this. First though, let’s put some numbers up.
DATA
I’ll be looking at IRD data from January 1 through February 13. Don’t forget that you can play along as well by logging into the freeview version of CCPView.
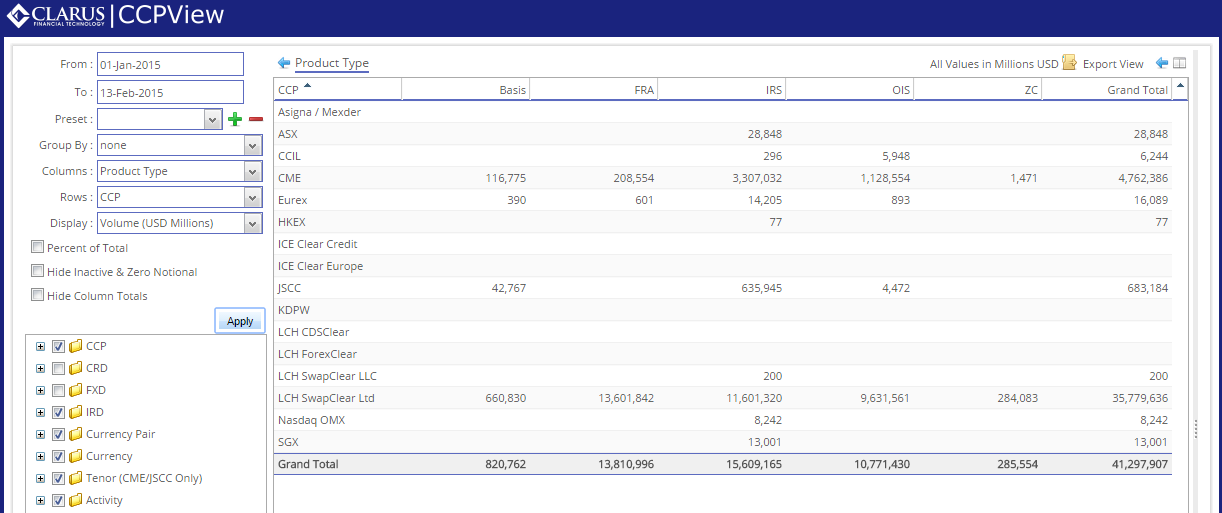
The numbers get fairly hefty and obscure pretty quickly. These numbers are in millions of USD equivalents. Hence LCH’s throughput since Jan 1 is a staggering 35.7 trillion. CME a distant second at 4.7 trillion.
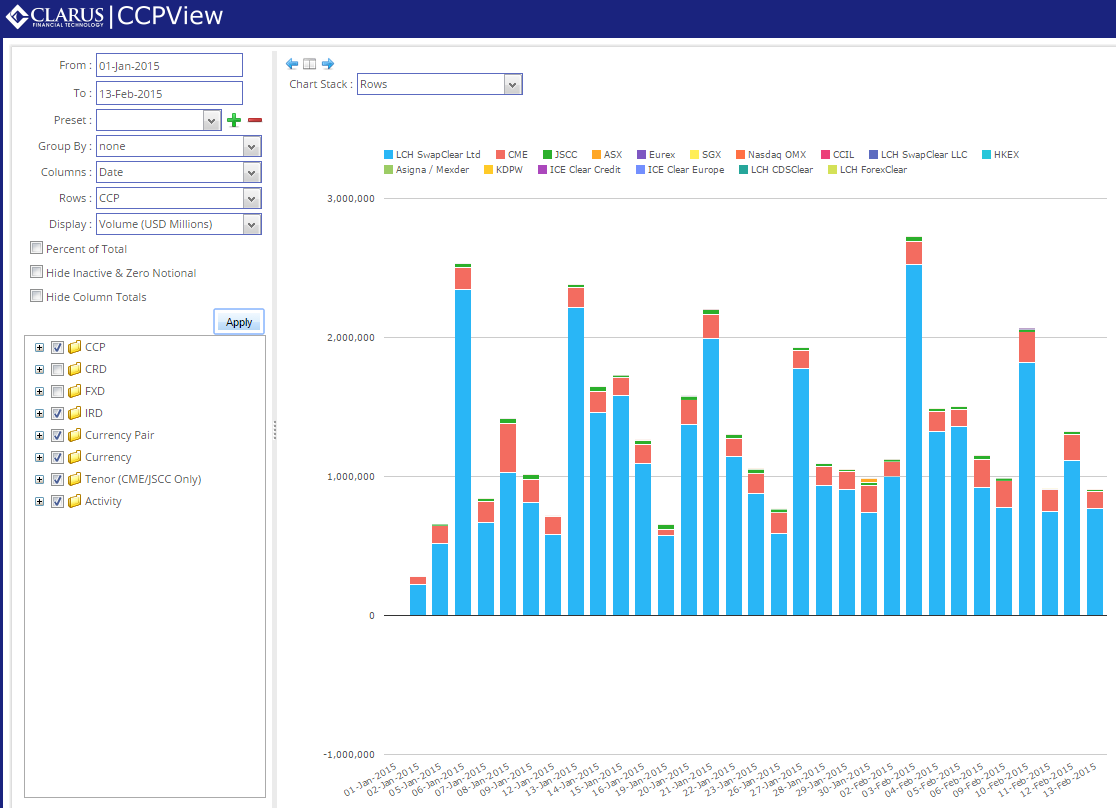
Looking at this activity day-over-day, across all product types within IRD, the scale of the difference becomes even more evident. LCH in blue, CME in red, and you can make out JSCC in green to top off each day:
SMALL FRA TANGENT
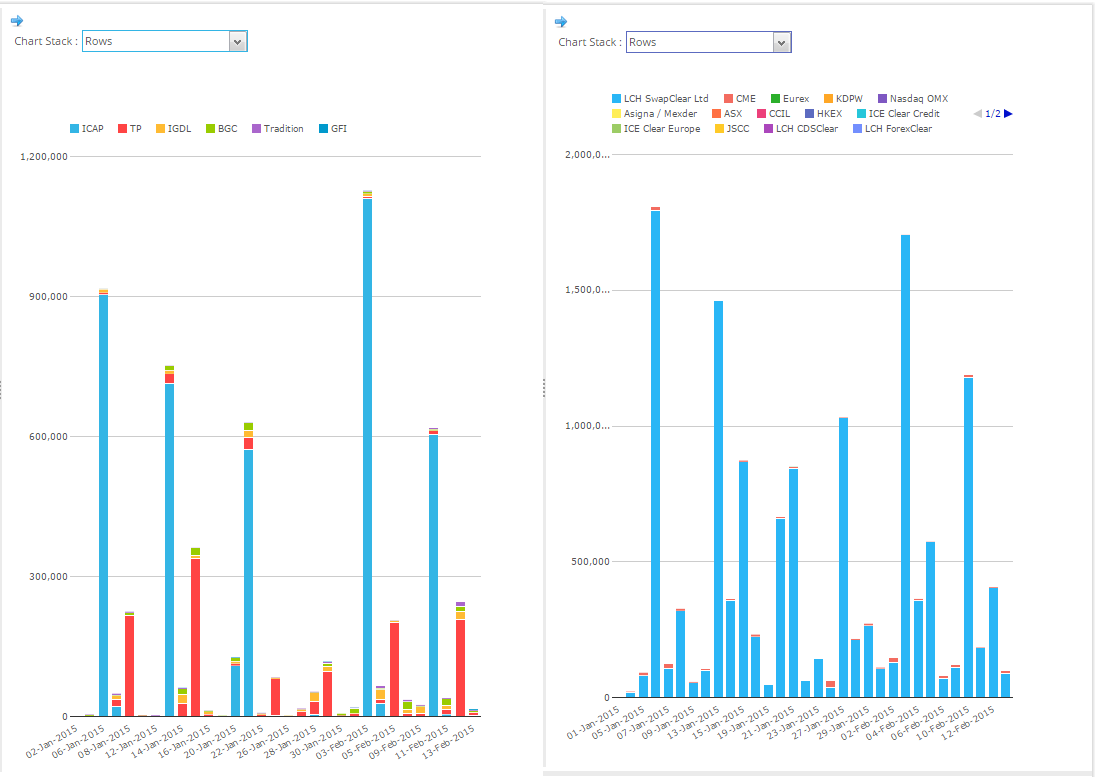
As evidenced from the product allocation table in the first screenshot, FRA’s make up the largest contributor, by notional, to LCH cleared rates volumes. We’ve seen such activity before on SDRView and SEFView. What is interesting is to overlay (or just compare) the SEF-executed FRA activity to CCP cleared FRA activity. We know the large blips on-SEF are due primarily to the ICAP and Tullet Prebon FRA service schedules. Quite normal then to see that the CCP data sees the same corresponding blips. We can tell quite easily that all FRA’s from these SEF programs appear to be cleared at LCH. Comparing these side-by-side:
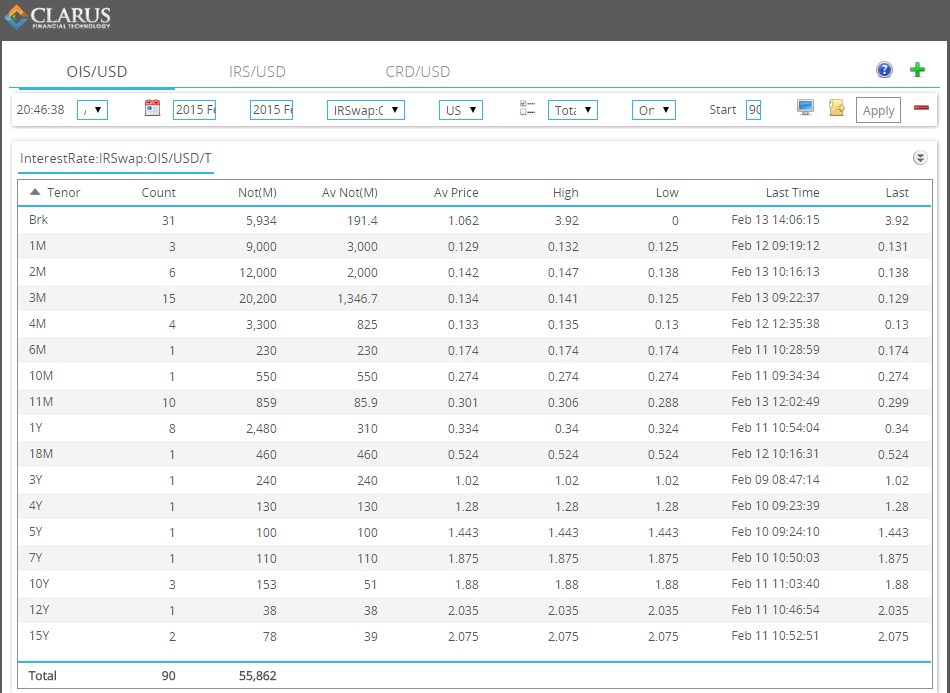
Of course much of this activity is very short-dated and quickly grosses up notionals. We’ve found that, unless specifically looking for FRA volumes, our users of SEFView tend to filter these products out. Similar can be said for OIS. While some OIS can be very long-dated (eg to 30YR), as a whole these products are typically within one to two years. We are able to confirm this through the trade counts and notionals across tenors for a weeks worth of OIS in SDRView, below:
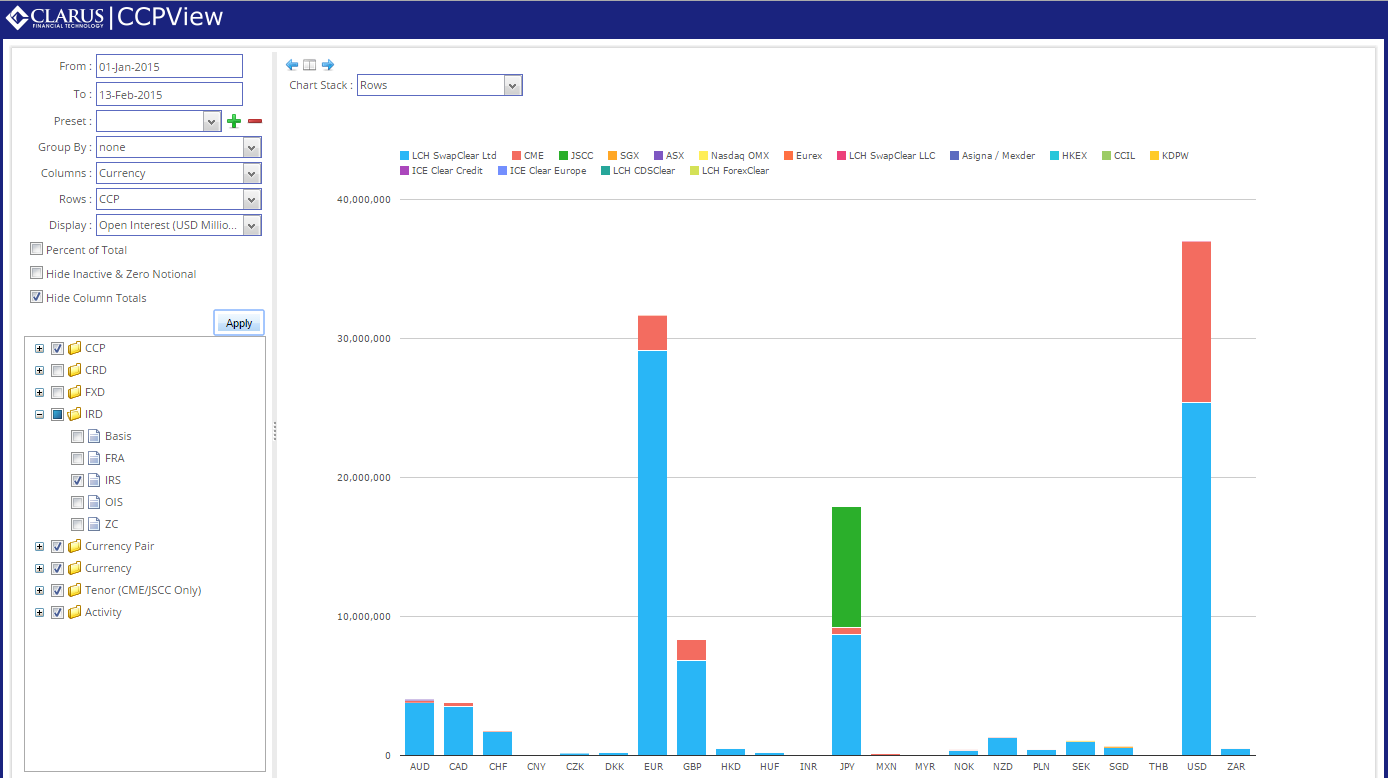
You can see where I am going with this. Arguably each product deserves investigation in its own right, however for todays research purposes I’d like to whittle it down to the universe of “IRS”, fixed-floating swaps, for which we saw there was 15.6 trillion in cleared volume in this YTD period. If we do that and look at the spread across currencies, we get the following:
In previous articles I have sliced up this activity further by looking at activity across Client and Dealer clearing. However for todays purposes, I’ll leave it there. LCH the clear leader, with JSCC handling a fair share of JPY, and CME enjoying a nice slice of the USD cleared activity.
OPEN INTEREST
So then, a popular view onto any product or DCO’s success is open interest. OI is a fabulous metric for very liquid AND fungible products, as it is a well understood gauge of how many people are in the game, and hence an indicator of how much liquidity the product can enjoy. In swaps its a bit more dicey, largely because the fungibility is not the same as in futures; in fact fungibility is absent at some clearing houses that do not offer compression services.
Lets look at the OI for the same universe of IRD products:
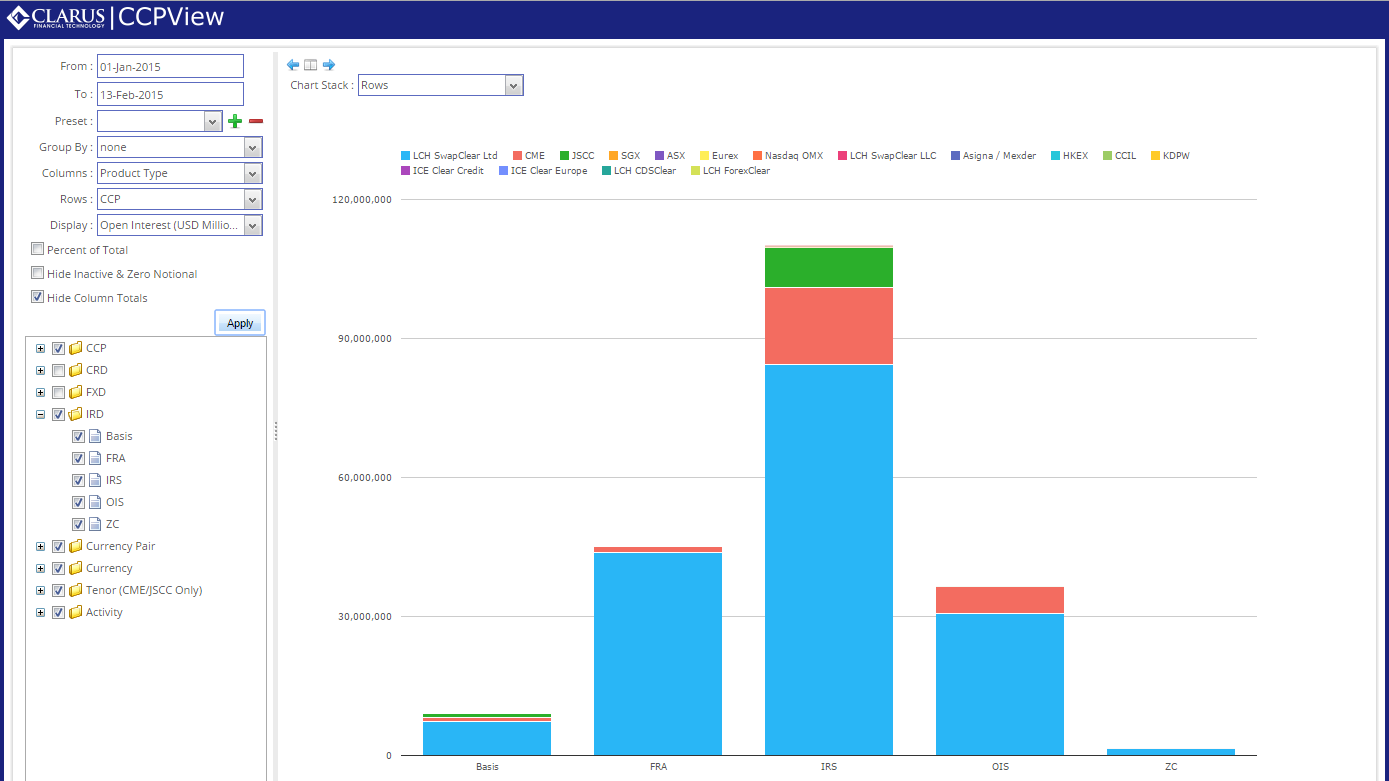
This shows that Open Interest for Fixed/Float swaps tops out at roughly 110 trillion USD, and you can more readily make out LCH (blue), CME (red), JSCC (green) and a slice of yellow for Eurex on top.
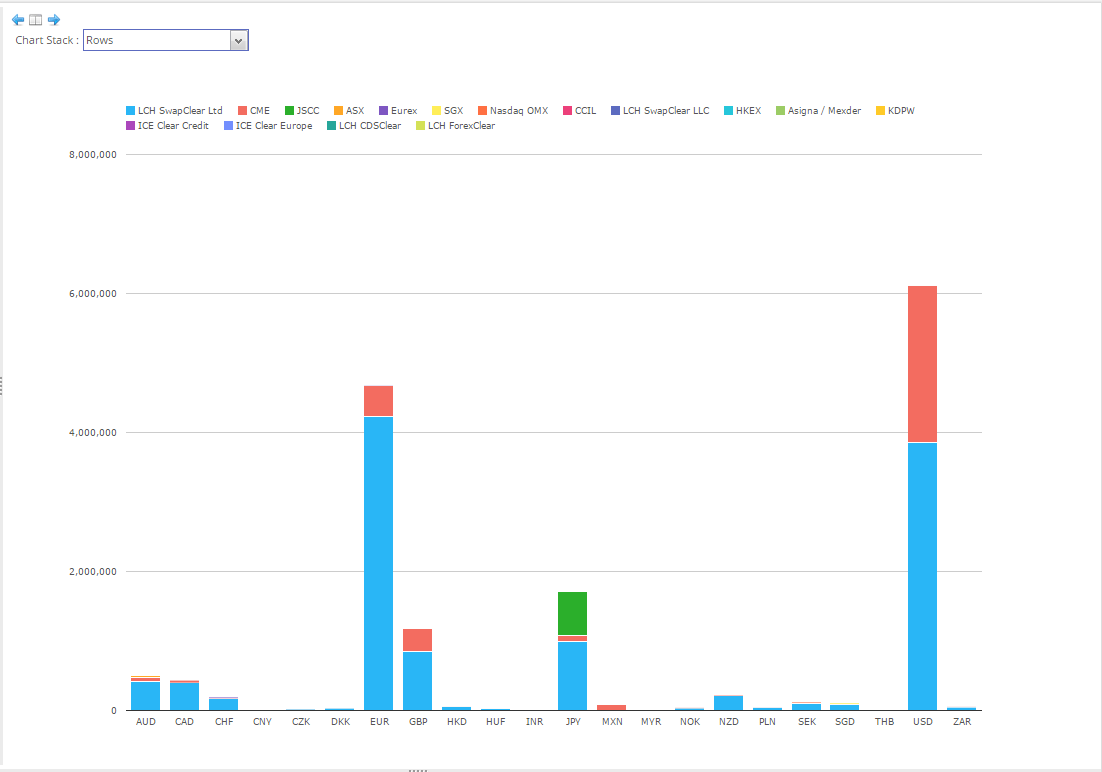
As we did for Activity (volume) far above, lets look at the currency breakdown by ccy, this time for OI:
Importantly, lets now look at this OI over the first 6 weeks of the year:
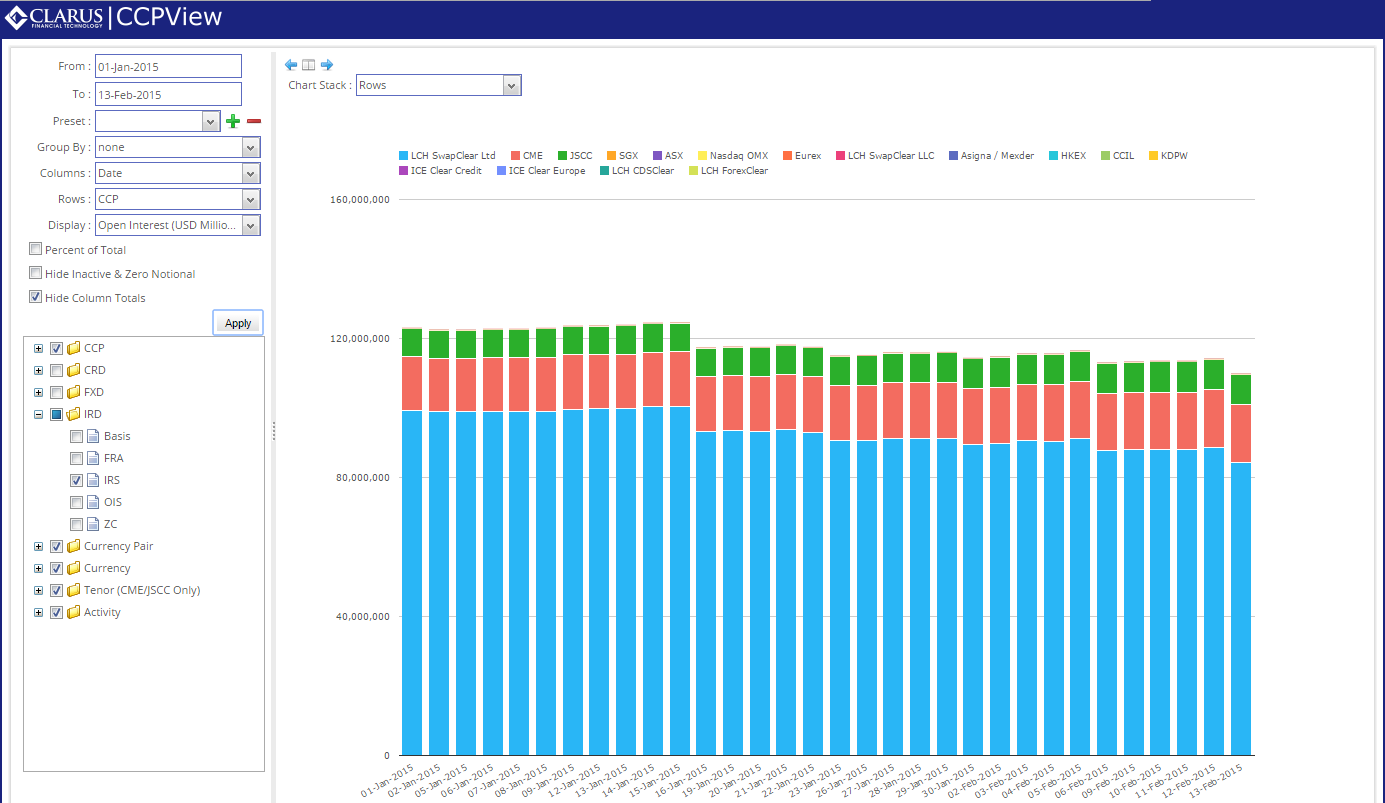
This is the real telling chart. We can see here that open interest drops from 123 trillion to begin the year, to our familiar 110 trillion last Friday, 13-Feb. A roughly 10% reduction. Quite impressive. Seems to corroborate dealers behavior in reducing their outstanding notional.
Word of warning on this, these are USD equivalents, and we update FX rates monthly. With the USD strength so far this year (except against JPY), we would naturally expect USD equivalents to drop as a representation of non-USD values. I wont show the data, but take confidence in the fact that USD OI alone has shown a drop from 45.7 trillion to 37 trillion (still a 8+ trillion reduction). So its not just an FX conversion phenomenon we are seeing here. This appears to be real.
A NEW METRIC?
If we look at this in tabular form, we can see what the YTD changes in OI look like:
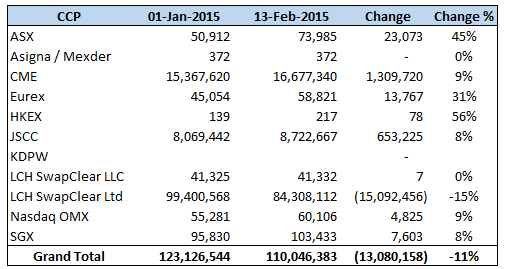
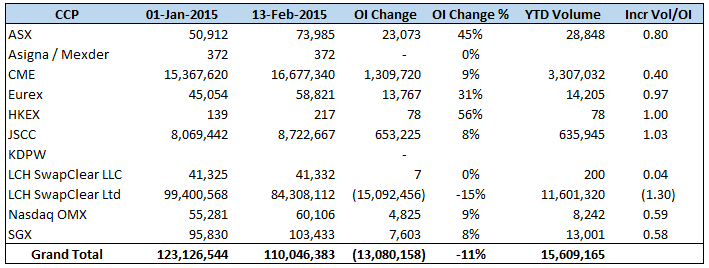
This shows some of the relative new services at ASX, Eurex, and HKEX posting double-digit gains in OI. It becomes even more interesting if we then plot volume alongside this change in OI, along with a metric I have called “Incremental Vol/OI”, which is in the last column. This attempts to answer how much additional OI is added for every incremental $1 cleared.
Few notes on this:
- LCH showed a reduction of 15 trillion USD in OI, having only cleared 11.6 trillion of new IRS.
- CME a respectable factor of 40 cents added to OI for every $1 cleared.
- FX translation causes JSCC to have a metric slightly greater than 1. This is because the USD weakened (USD/JPY dropped ~120 to ~117) so the USD equivalent OI (of cleared JPY) jumped on the first day of (and throughout) February.
- It is unreasonable for any new venue to expect to have compression opportunities when the OI is small, hence we would expect the incremental metric to be ~1.00 for these.
- Further, there are natural swap-maturity opportunities at long standing venues such as LCH, as its quite possible there are now swaps rolling off that were cleared 15 years ago. Hard to have a 15 year swap mature when your business has only been operative a few years (forgetting backloading).
- LCH was the only venue showing a negative ratio. I would think this is a combination of trades maturing alongside their recent compression initiatives.
SUMMARY
I set out to look at cleared volumes vs OI for interest rate swaps, and endeavored to come up with some sort of metric to monitor the anecdote that firms are reducing their swap books. The inherent FX translation issues, lack of maturity data, as well as the lack of a pure compression number, makes this kind of analysis more of an art than a science. However I am pretty comfortable that we’ve proven there is a real downsizing & efficiency shift occurring in the cleared space.
Hi Todd
I do usually try and keep an eye or your analyses, but this one is fascinating
many thanks
Tony