Continuing with the theme of CME-LCH Basis which has been a phenomenally popular blog, I wanted to look at whether there has been an impact on volumes of Cleared USD Interest Rate Swaps at CME and LCH.
Weekly Volumes
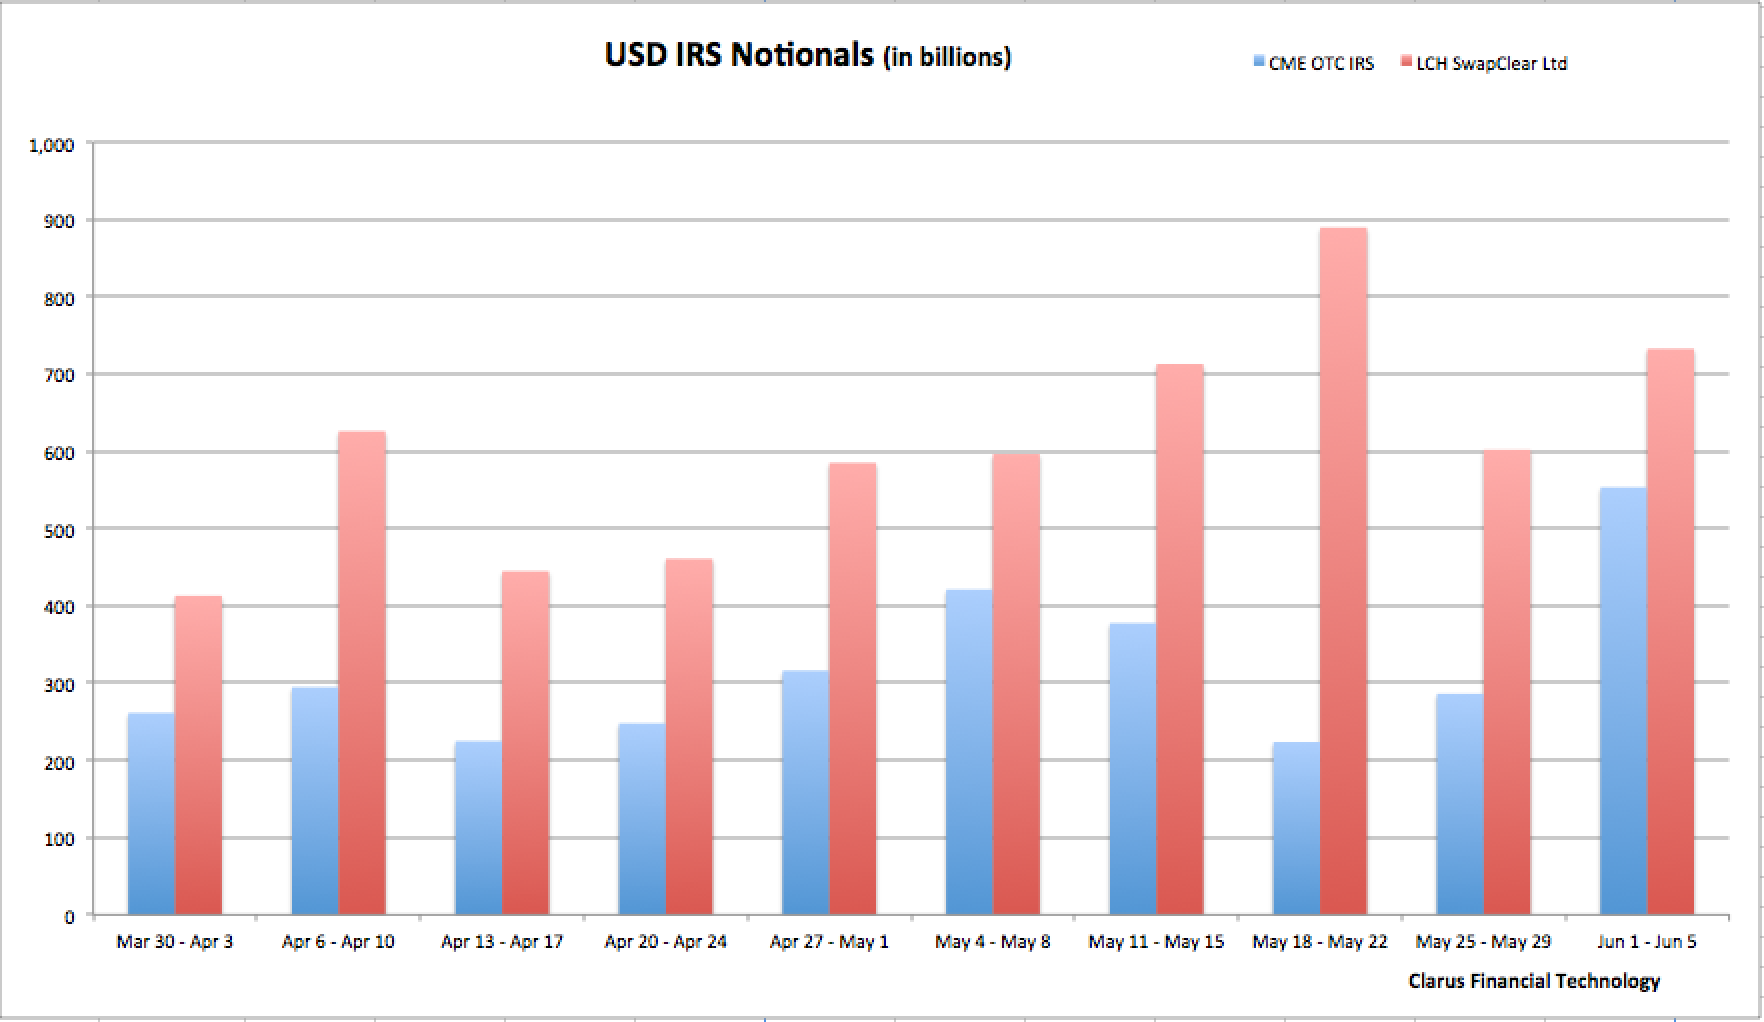
Using CCPView we can extract weekly volumes of gross notional for just USD IRS for the past 10 weeks and compare CME IRS Volumes with LCH SwapClear Volumes (All and not just Client).
A few things stand out:
- CME volume in the first week, Mar 30 to Apr 3, is $261b while LCH is $413b
- For the first 6 weeks CME volumes fluctuate between 30-40%, while LCH is 70-60%
- And for each of these 6 weeks, both CME and LCH rise or fall in the same week, in-line with the market
- Then in the week of May 11-15, we see CME drop and LCH rise
- And in the week of May 18-22, we see a low for CME of $224b and a high for LCH of $890b
- The total volume is similar to the prior week at $1.1 trillion but CME is down to 20%, while LCH is 80%
- Week of May 25-29, reverts to similar figures to those in week 5, with CME 32% and LCH 68%
- But then the Week of Jun 1-5, sees CME hit a high in the period of $553b while LCH is $733b (second highest)
- The total is a new aggregate high in the period of $1.3 trillion
- And in this week the share is CME 43% and LCH 57%
- Turbulent to say the least!
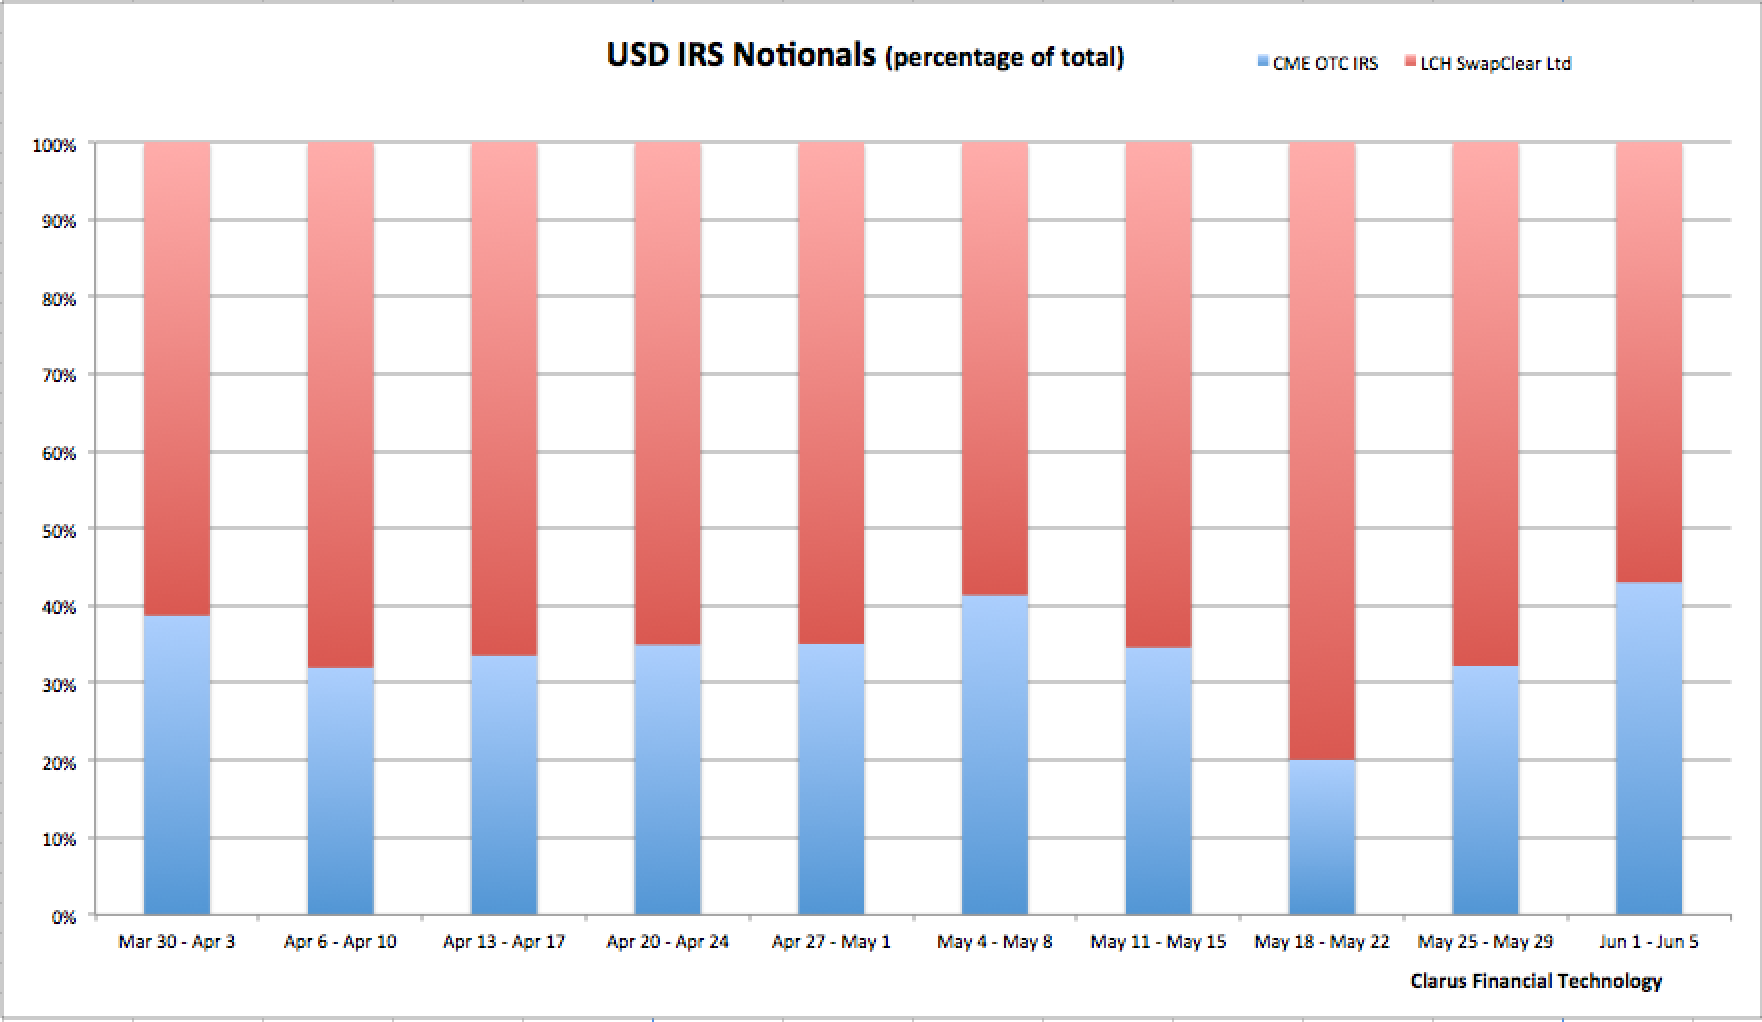
A chart showing percentage share is also instructive:
So what do we make of this?
Lets drill-down into more detail before drawing a conclusion.
Week May 18-22
Starting with the LCH weekly high of $890b.
Using CCPView we can look at daily volumes for this week.
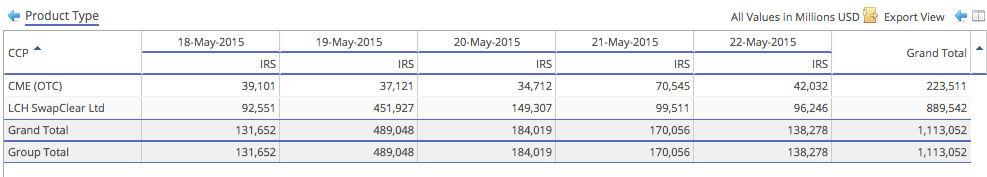
Showing that 19 May has a very high volume of $452 billion, more than 3 or 4 times other days this week.
And then drill-down to see the daily breakdown.
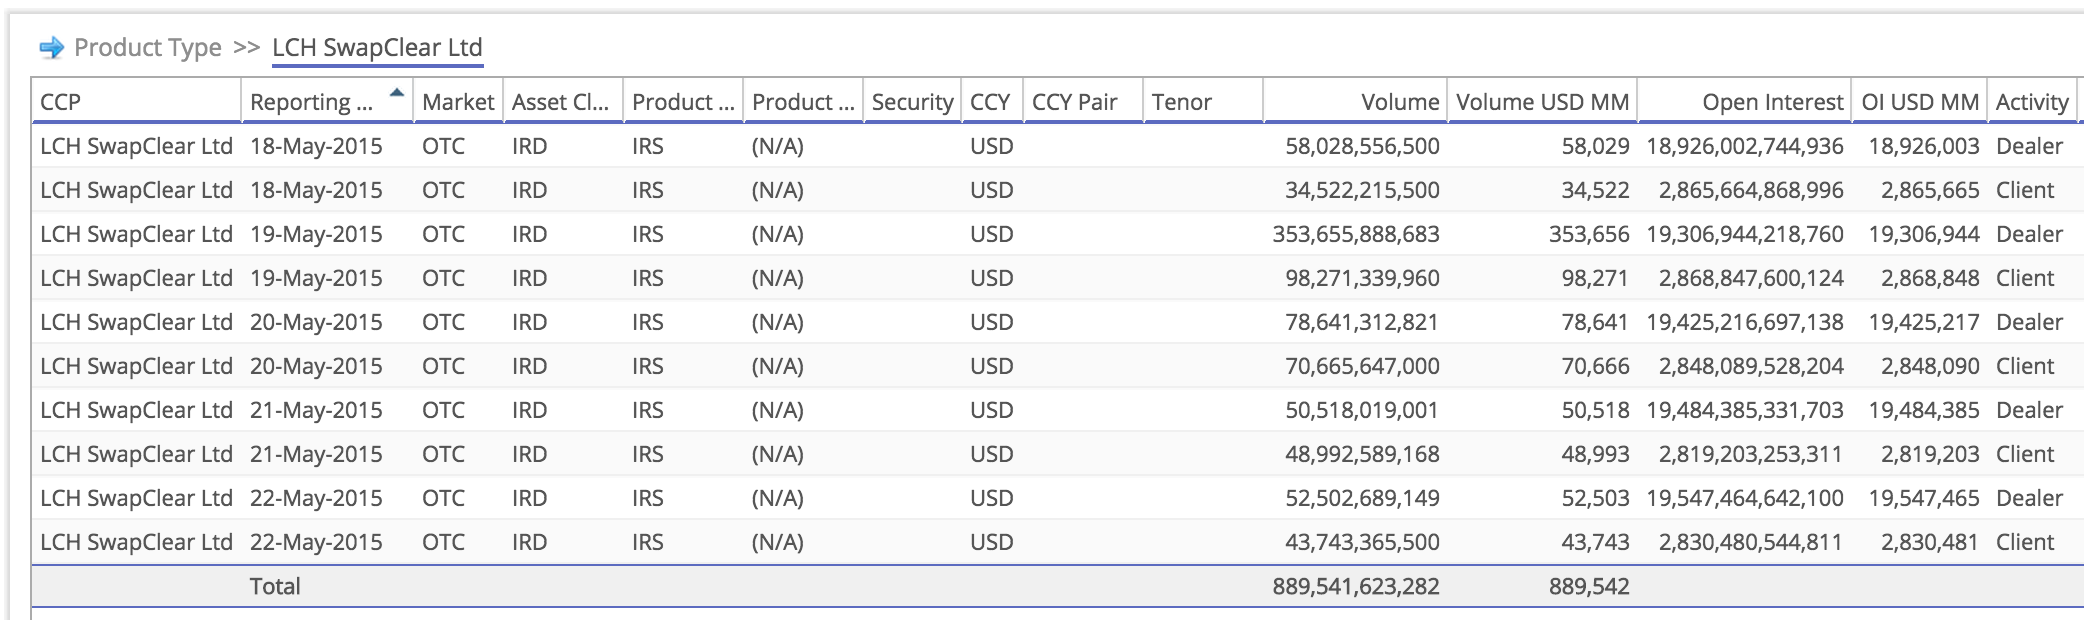
Shows that on 19 May it is Dealer volume of $353 billion, ( 5 to 6 times the volume of other days that week) that is the cause and not Client volume. We do not have further information as to Tenor as that is not made public by LCH.
We could look at SEF disclosed volumes in SEFView to see whether we can find more details:
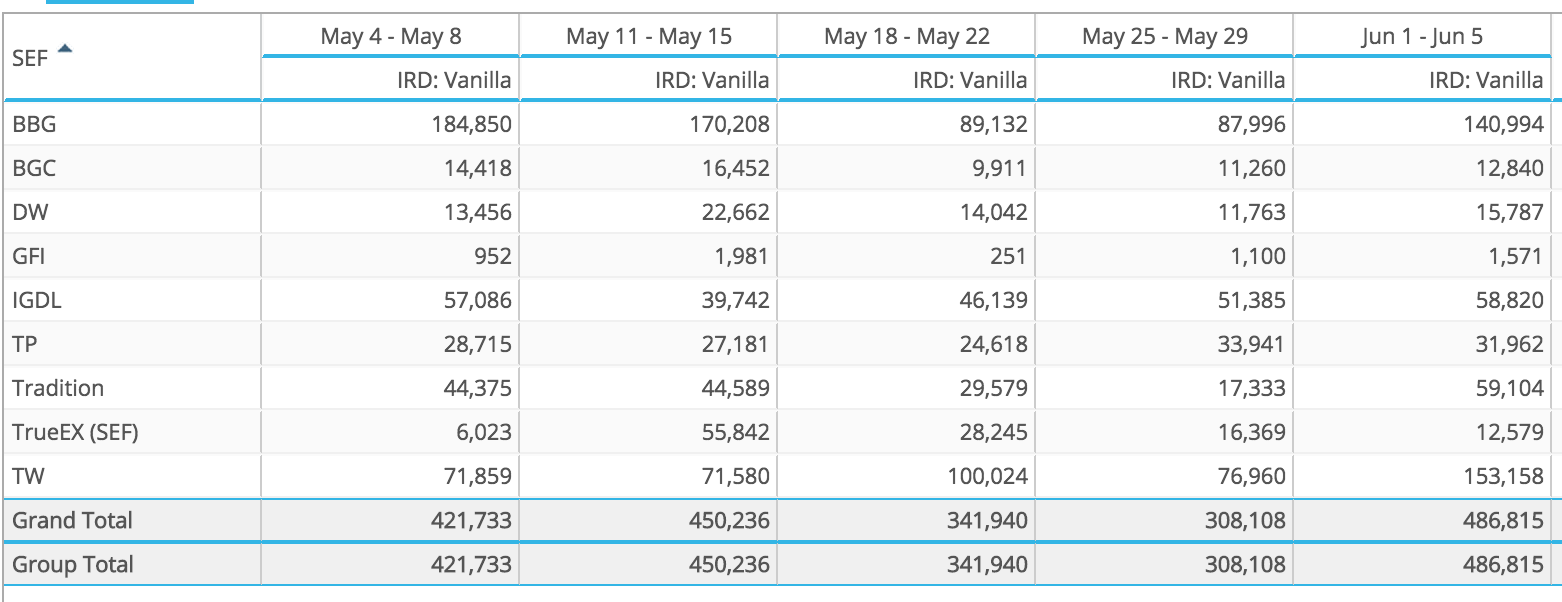
However that shows that May 18-22 was a low volume week with $341b traded, far from the $891b figure.
Meaning that this volume was transacted Off SEF, so either Non-MAT Swaps (Forwards or Non-MAT Spot tenors) or is back loading of existing bi-lateral trades.
We could turn to SDRView next, but given the block cap rules that is not going to help, so I will spare you the detail.
Week Jun 1-5
Lets now turn to the CME high of $533b.
Again using CCPView we can look at daily volumes for this week.
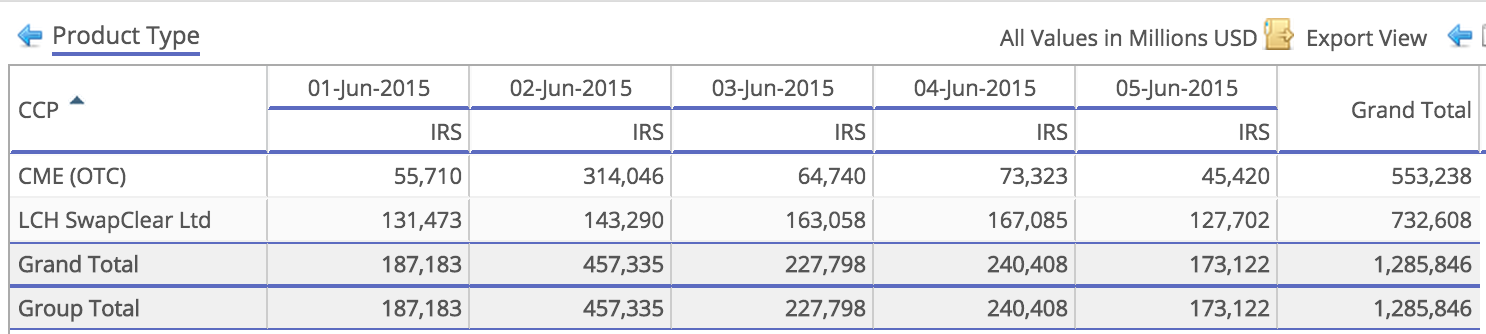
Showing that 2-Jun had more than 5 times the daily volume of other days at $314 billion.
Drilling down on this day shows:
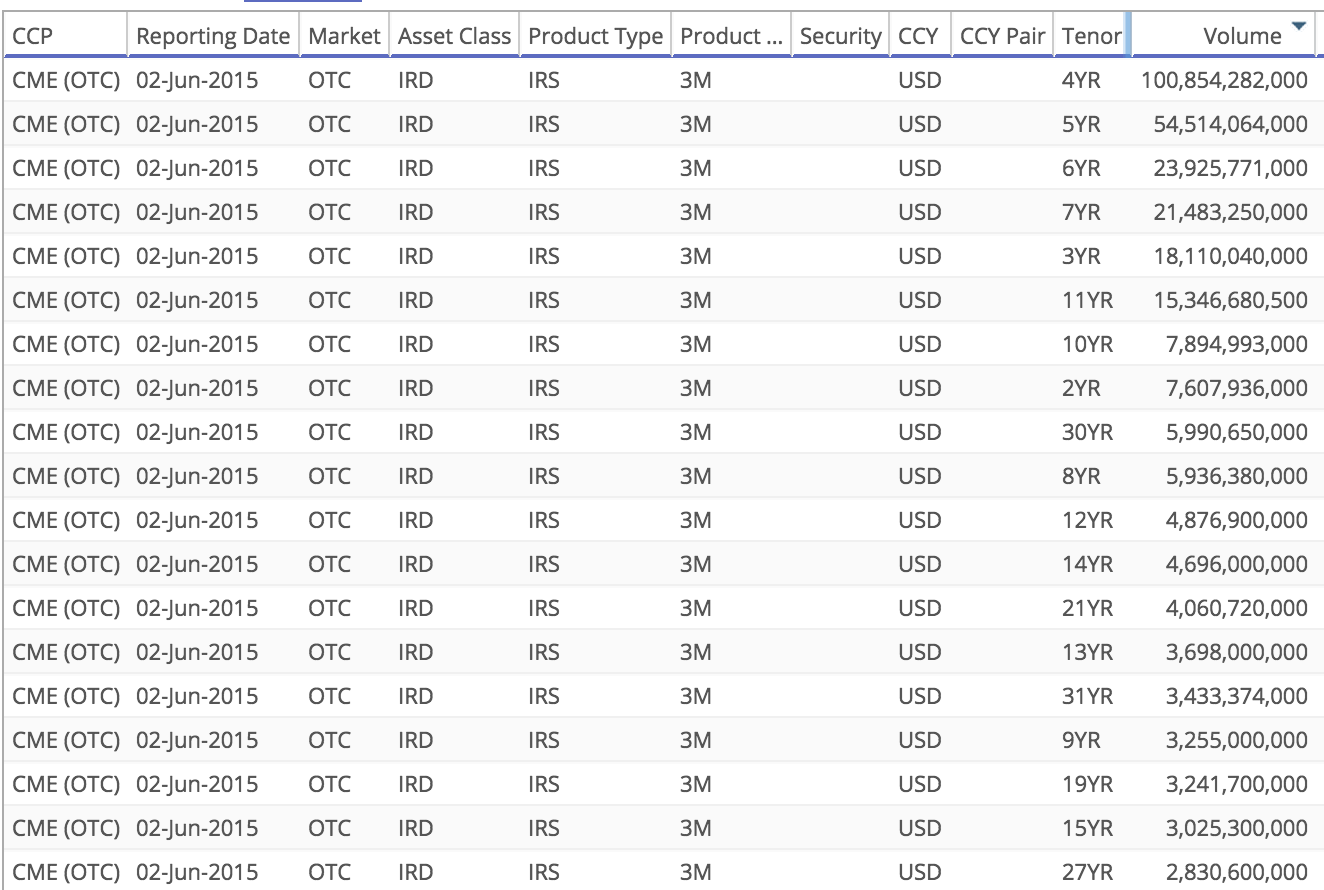
Very high numbers and many in Non-MAT tenors:
- $100b in 4Y which is Non-MAT, so can be Off SEF
- $54b in 5Y, actually CME markup is in 4Y-5Y, so could also be Non-MAT
- 6Y, 11Y, 8Y, 21Y, 13Y, 31Y, 27Y are all un-usual tenors for such volume and Non-MAT
From the earlier SEFView table we can see that the week of May 18-22 is higher at $486b and both Bloomberg and Tradeweb posted large numbers that week, so at least some of this volume may have been On SEF but the majority will have been Off SEF.
Again nothing to be gained by looking at SDRView.
Suffice to say that these are then either new Non-MAT trades or back-loading of existing bi-lateral trades.
(Note: We could isolate the CCP basis trades volumes that TradX and ICAP reported in these periods but given they hit both CME and LCH volumes equally and are significantly smaller than the weekly volumes above, doing so has no material impact).
Piecing it Together
Starting in the week of May 11, we see a drop in CME IRS volumes in favour of LCH.
The following week of May 18, CME IRS volume hits a low of $224 billion or 20% as LCH hits $890 billion.
This LCH high is the result of May 19 Dealer to Dealer volume of $353 billion (> 5 times other days that week).
The next week of May 25, we see CME rise a bit and LCH fall from its prior high; so similar share to earlier weeks, 32% to 68%.
Then the week of Jun 1, we see CME hit a high of $553 billion, for a share of 43% to LCH’s 57%.
This CME high is the result of Jun 2 volume of $314 billion (5 times other days that week).
And a Plausible Narrative?
We know from my earlier blog that the LCH-CME Basis started increasing late April or early May.
Significant CCP Basis trading took place on Tradition and ICAP.
Stories surfaced in the press towards the end of the week of May 11.
CME announced on May 13 an imminent move to CME specific observations in their settlement curves.
This and the widening basis caused Dealers to look to offset their exposure with other Dealers.
Resulting in the massive cleared volume of $353 billion on May 19 at LCH.
As the CME curve change neared implementation (Jun 8), firms with large net receiver positions at CME stood to loose up to 2.5 bps times their portfolio DV01 and decided to hedge this.
Resulting in massive cleared volume of $314 billion on Jun 2 at CME.
We know that on both May 19 and Jun 2, the large volumes was Off SEF, but cannot say whether new trades or back-loading, either or a combination of both is plausible.
Make sense? Does to me.
But tomorrow is another day and while facts should not change, our interpretation may. (Any economists out there?)
Some Final Thoughts
An interesting angle of enquiry would be to look at CME EuroDollar and Treasury Note volumes over the same period, however the spirit is willing but the flesh is weak. So I will leave those of you that are interested to do yourself in CCPView.
For the moment I will end by re-stating that the CME-LCH Basis has caused upheaval in the Swap market.
And large swings in volumes and market share back that up.
A significant LCH volume gain seems to have been clawed back by CME.
But it is early days and only time will tell which way volumes will go.
Make sure to subscribe to our blog to stay informed.