Last week I wrote an article on European CCP Public Disclosures, following this I learn’t that in-fact the CPMI-IOSCO Public Disclosure is not limited to European CCPs but is Global. So there is a lot more data to look at.
Today I will focus on the largest Interest Rate Swap CCPs and the largest Credit Default Swap CCPs and make a comparison using a few of the most noteworthy quantitative disclosure fields.
Interest Rate Swaps
Lets start with IRS and the three largest CCPs ranked by Open Interest using CCPView figures as of 30 September 2015, which is the most recent quarter that the CPMI-IOSCO disclosures are available for.
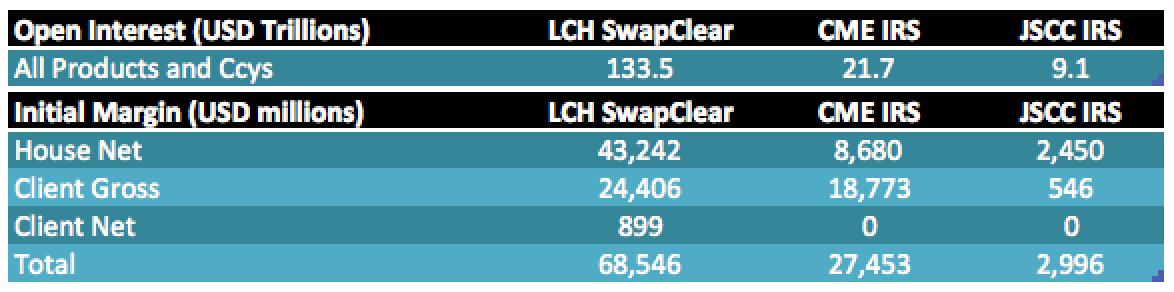
Showing that:
- LCH SwapClear has by far the largest Open Interest at $133.5 trillion
- Followed by CME IRS with $21.7 trillion and JSCC IRS with $9.1 trillion
- Initial Margin at LCH SwapClear is $68.5 billion
- Of which House is 63% and Client is 37%
- IM at CME IRS is $27.5billion, with House 32% and Client 68%
- IM at JSCC IRS is $3billion, with House 82% and Client 18%
IRS – Default Funds and Credit Risk
Lets now compare the Default Funds and Credit Risk disclosures for each of these CCPs.

Showing that:
- LCH SwapClear Default Fund is $8 billion (using USD/GBP of 1.5)
- Pre-funded Member Contributions are more than the Peak Stress Loss of the Largest Two Members
- CME IRS Default Fund is $5.2 billion
- Pre-funded Member Contributions are more than the Peak Stress Loss of the Largest Two Members
- LCH vs CME Relative Size of the Default Funds at 8:5 is much closer than the IM proportion of 5:2
- Probably related to the LCH change in 2013 to improve defaulter pays over all members contribute
- And differences in methodology used to determine the size of the Default Fund
- JSCC IRS Default Fund is $206 million (using JPY/USD of 120), which is lower than I expected
- But partially explained by the fact it is Cover 1 (member default) and not Cover 2, like CME & LCH
- However the size of the Default Fund is less than the Peak Stress Loss of the Largest Members
- [UPDATED] But disclosure 4.4.4 states that there were zero days in the quarter that the Peak Stress Loss if the Largest CM Defaulted exceeded Actual Pre-funded Default Resources. So the difference in the two numbers must be down to a timing issue and a stated transition towards a “defaulter pays” model, which would have the effect of increasing IM and decreasing DF contributions.
IRS – Members and Clients
Turning to members and client disclosures.
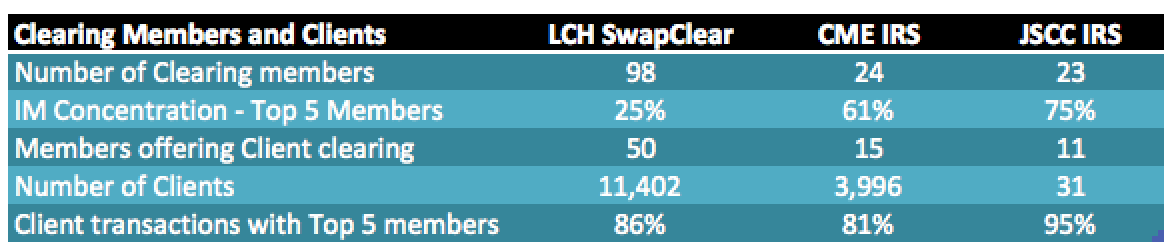
Showing that:
- LCH SwapClear with 98 members has the lowest Top 5 IM concentration of 25%
- CME IRS and JSCC IRS with less members have a higher Top 5 concentration of 61% & 75%
- Number of Clients looks like Client accounts at LCH and CME
- Given that a large client will have multiple CMs and many accounts in each
- I would guess that the 11,402 client accounts at LCH represents 500 to 600 clients
- Client clearing volumes are heavily concentrated with the Top 5 members
- Which is true for all three CCPs
- Suggesting that economies of scale or safety with the largest are key factors
That’s it for IRS, so onward to CDS.
Credit Default Swaps
As before disclosures as of 30 September 2015, but this time the four largest CCPs.
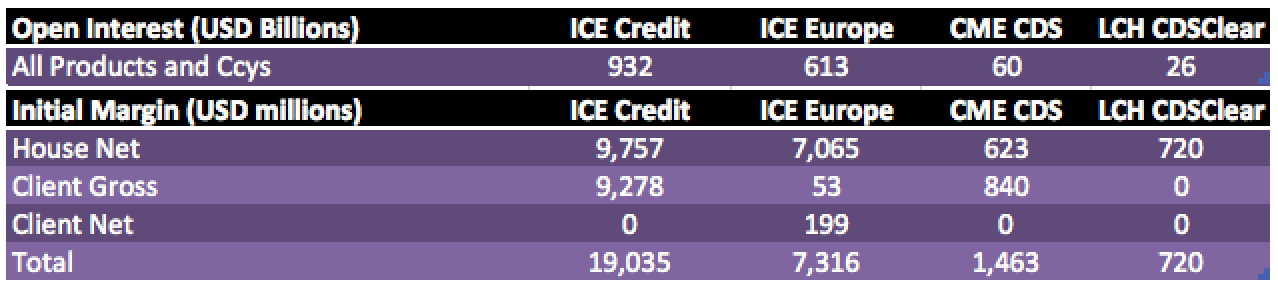
Showing that:
- ICE Clear Credit has the largest Open Interest at $932 billion
- ICE Clear Europe is next with $613 billion
- These two are by far the largest
- Initial Margin at ICE Credit is $19 billion, of which House is 51% and Client 49%
- IM at ICE Europe is $7.3billion, with House 97% and Client 3%
- IM at CME CDS is $1.5billion, with House 43% and Client 57%
- IM at LCH CDSClear is $720 million all House
CDS – Default Funds and Credit Risk
Lets now compare the Default Funds and Credit Risk disclosures for each of these CCPs.
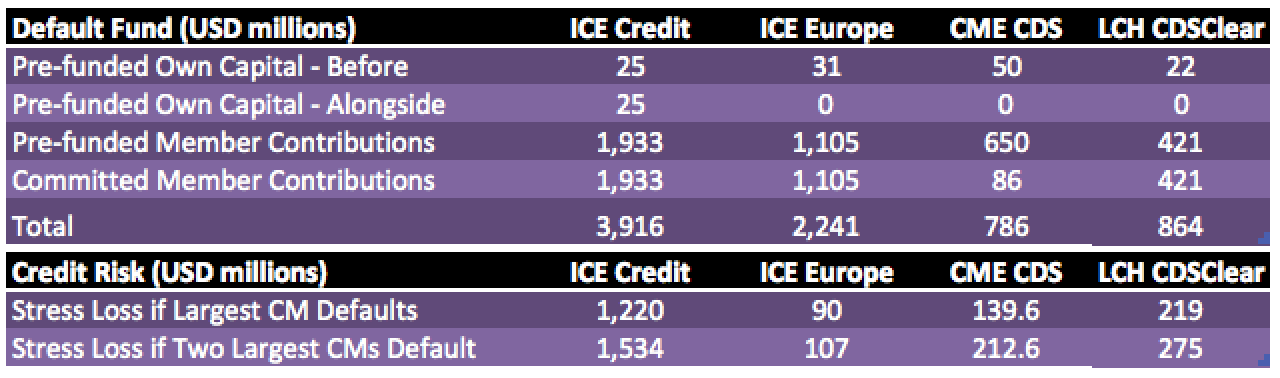
Showing that:
- ICE Credit Default Fund is $3.9 billion
- Pre-funded Member Contributions are more than the Peak Stress Loss of the Largest Two Members
- ICE Europe Default Fund is $2.2 billion
- Peak Stress Loss is much smaller than the Pre-funded Member Contributions, which is surprising
- CME CDS Default Fund is $786 million and LCH CDSClear is $864 million
CDS – Members and Clients
Turning to members and client disclosures.
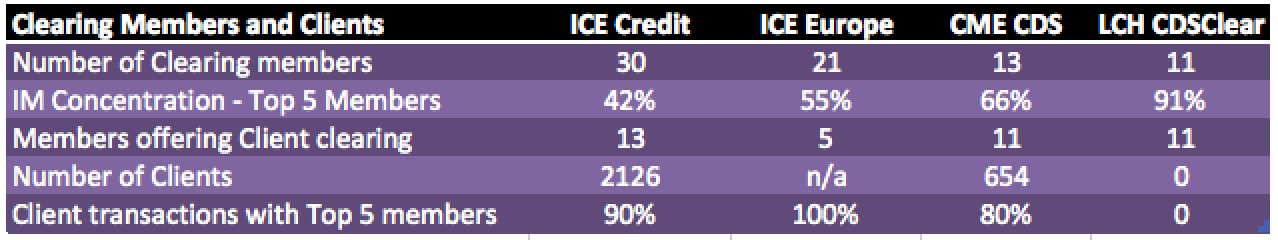
Showing that:
- ICE Credit with 30 members has the lowest Top 5 IM concentration of 42%
- LCH CDSClear with 11 members has the highest Top 5 IM concentration of 91%
- Number of Clients again looks like Client accounts at ICE and CME
- Client clearing volumes are heavily concentrated with the Top 5 members
- Even more so than for IRS
The End
Thats it for today.
I think the public disclosure of these quantitative numbers is great.
It provides transparency to understand the resources of a CCP.
And a comparison between CCPs on a like for like basis.
So far I have only looked at IRS and CDS CCPs.
There are a lot more Futures CCPs, with a lot more data.
But that is a task for a different day.
Thank you for reading today’s blog.
UPDATED the IRS Default Funds and Credit Risk section for JSCC CCP 4.4.4 disclosure on zero number of days that peak stress loss exceeded pre-funded resources