According to the FT, we need a dose of optimism at the beginning of 2024. What about these statistics to provide you with an uplifting outlook for the New Year?
- More cross currency swaps traded in 2023 than ever before.
- 2023 saw 15% more swaps trade than in 2022, which itself was a record year.
- Trade counts have grown by at least 10% every year since 2018.
- Over $6.2Trn of XCCY notional was reported last year, 62% higher than the previous year and the first time since 2019 that over $4Trn has been reported.
- But XCCY swaps are getting shorter.
- Read on for more…..
SDRView Volumes
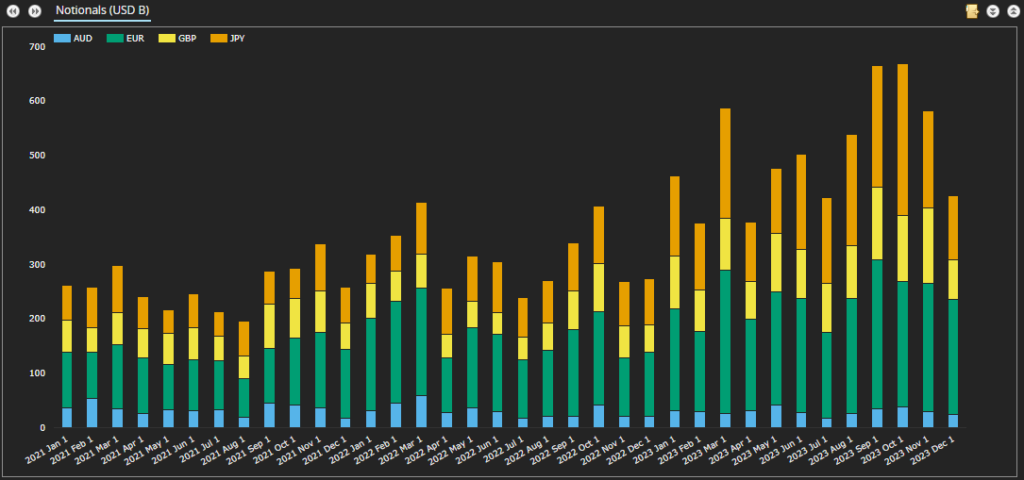
SDRView shows the monthly volumes transacted of Cross Currency Basis swaps. These are, on the whole, the vanilla interbank type of mark-to-market cross currency swaps.
Showing;
- Monthly volumes in XCCY Basis swaps for the past two years. Please check our previous Cross Currency blogs to see the big stories for 2021 & 2022!
- 2023 saw volume records in EURUSD, GBPUSD and JPYUSD (not AUDUSD surprisingly).
- It was the first year that every quarter saw more than $1Trn in notional trade – which is subject to the reporting thresholds, so it is likely that total sizes are understated by ~30%.
- 2023 was a good year for volumes, showing:
- 45% volume growth in EURUSD
- 77% in GBPUSD
- 106% in JPYUSD (i.e. volumes more than doubled in USDJPY!)
But…there is a gotcha!
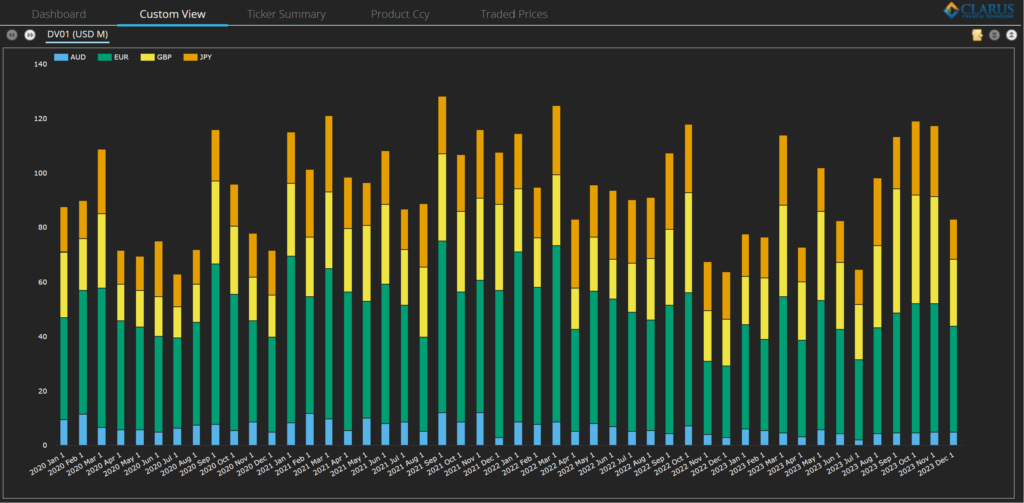
Proving that there is something for everyone in the data, there were no records being made in terms of total DV01 traded.
So enough with the unbridled optimism – it is not really the style of XCCY traders after all! Clearly 2023 was typified by lots of short-dated, large notional trades. The total risk traded was somewhat underwhelming.
SDRView shows the DV01 of cross currency swaps traded:
Showing;
- DV01 traded in 2023 did not break any records.
- 2023 risk traded was almost identical to 2022- within 2%.
- However, both 2022 and 2023 were about 10% down on 2021.
Average Maturities
All of this means that the average maturities of trades was considerably shorter in 2023 than in 2022. Data below:
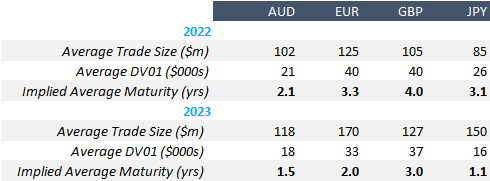
Showing a consistent story across all currency pairs – trading was dominated by the short-end in 2023:
- In EURUSD, average trade size was $170m in 2023, representing $33K DV01 of risk. This implies an average maturity of about 2 years (i.e. $170m of 2Y is equivalent to $33K of DV01 risk). This is considerably shorter than 2022’s average maturity of 3.3 years.
- In GBPUSD, average notional size was $127m equivalent in 2023, but equal to an average risk of $37K DV01. This implies an average maturity of 3 years, again shorter than 2022’s 4Y average.
- JPYUSD saw average notional sizes of $150m and $16K DV01, implying average maturity of just 1.1 years. In 2022, the average maturity was 3.1 years!
- AUDUSD again saw shorter trades in 2023 than 2022. An average trade size of $118m in 2023, and a DV01 of $18k implies an average maturity of 1.5 years – shorter than the 2.1 year average in 2022.
These averages can also be further refined by splitting the data between block trades and “normal” trades – because we know that the overall size of the market is somewhat larger than actually reported.
SEF Trading
In terms of SEF Trading in vanilla XCCY basis, the proportion of SEF trading by trade count has been pretty stable in each month of 2023, with a larger proportion of the market choosing to trade on-SEF than in 2022. Only 18-25% of trades were reported as off-SEF:
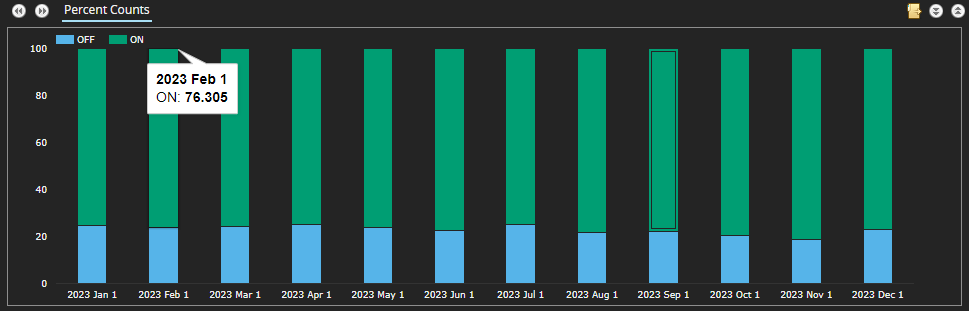
Proportion of XCCY in EUR, GBP, JPY and AUD executed on-SEF by trade count. Source: SDRView
As a reminder, this doesn’t cover the whole global market – so it is difficult to say for sure that SEF trading was more popular in 2023 than in 2022. However, looking over on SEFView, we have the overall 2023 market share stats for Cross Currency Swaps per SEF:
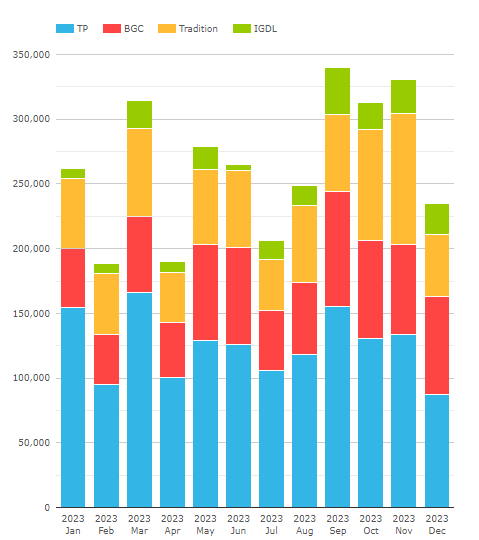
Showing;
- The same 4 SEFs reported volumes in Cross Currency Basis in our four currency pairs in 2023 as they did in 2022 – no change there!
- In notional terms, Tulletts reported the largest market share, at 47%, identical to 2022.
- BGC were second at 24% for the year.
- Tradition in at third with 23%.
Two things to note with this data:
- The Tulletts and ICAP XCCY desks must be sending all of their SEF trades to a single venue.
- This data isn’t necessarily representative of the whole market, only the portion traded on-SEF.
For the portion of the market that is traded on-SEF, we now have trade-level transparency in SDRView as to where a swap has traded.
For the whole of 2023, we can see which platforms Cross Currency Swaps have traded across:
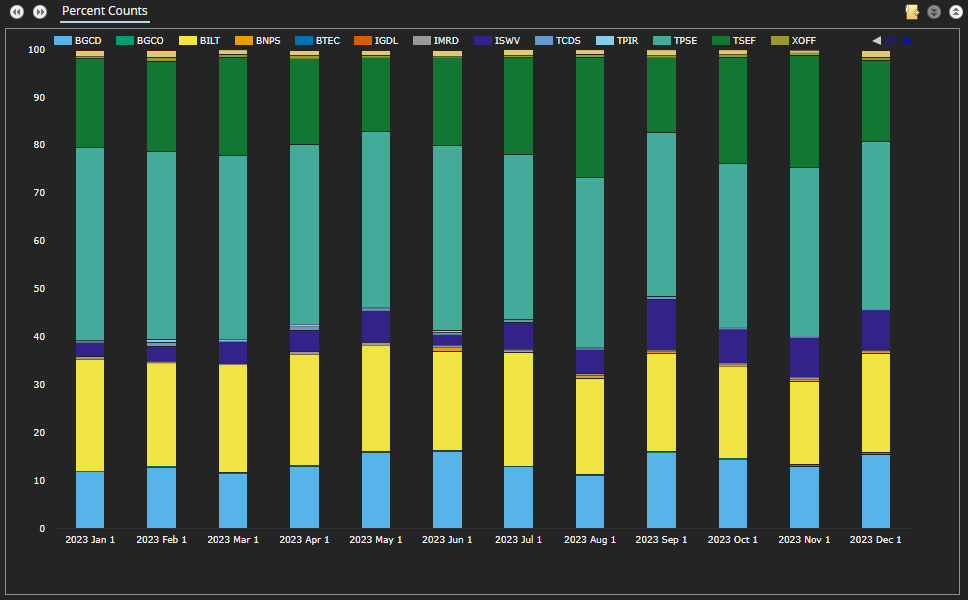
Showing;
- Proportion of trade counts reported per platform in 2023.
- The platforms are identified by so-called “MIC” codes. In plain English, we have:
- TPSE, IMRD, TPIR = Tulletts SEF, TP ICAP UK MTF and TP ICAP Europe MTF.
- TSEF and TCDS = Trads SEF and Trads OTF.
- ISWV = ICAP Voice
- BGCD and BGCO = BGC
This allows us to monitor trades in real-time as they come in on each SEF via SDRView Professional, allowing us to monitor market share by:
- Trade count
- Notional
- DV01
- Block trades
- Tenor
We can do similar in SEFView (the day after trading), which gives us an interesting look at the change in market share per SEF as maturities get longer:
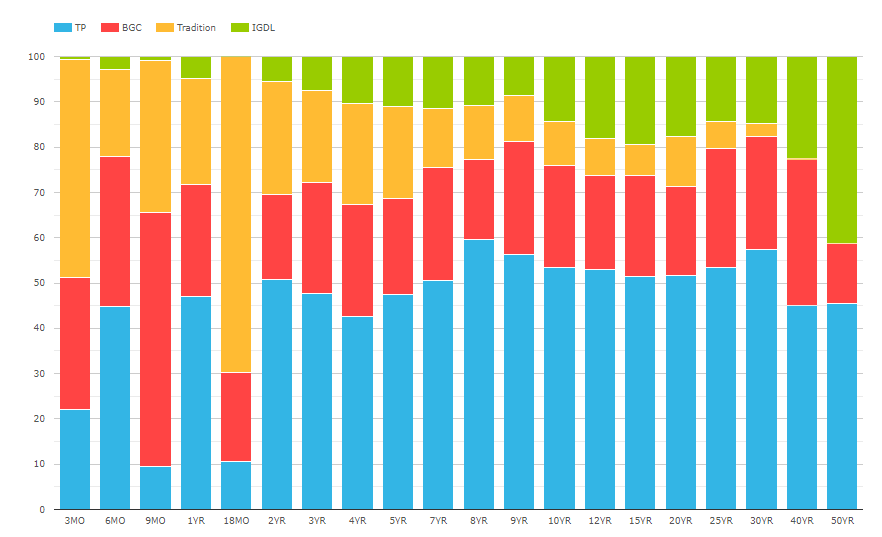
Pretty interesting to see the relative changes in the IGDL and Tradition market shares as the maturity increases.
In Summary
- More cross currency swaps traded in 2023 than ever before, with 15% more trades than in 2023.
- It was a record year for XCCY notional reported, with over $6.2Trn of XCCY trading.
- But the average maturity of a cross currency swap shortened considerably.
- More XCCY swaps executed on-SEF than in 2022 – about 20% more by trade count.
- SEF market share was fairly constant compared to last year.