Will ECB QE affect European Cross Currency swap markets? We need more transparency in European OTC data to definitively answer that question. In this blog, we use 2014 data from the SDRs to first examine what has traded over the past twelve months and then we take a quick look at 2015 data and discover a bias in EUR/USD swaps towards longer maturities. Despite only having announced the policy on January 22nd, is this already down to ECB QE?
Experience Still Counts…
Was 2014 a “regular” year for Cross Currency Swaps? For now, that’s something we cannot answer in isolation – it still takes a market professional with “X” years of experience to be able to put a trading year into any meaningful context. However, as content such as this becomes more and more available, we can build up a real portfolio of “context”. Therefore, following on from US-focused Swaps and Swaptions reviews, let’s look at a market that is more European-focused – Cross Currency Swaps.
Why Cross Currency?
Well, I traded it for over 10 years! But seriously, it is a market that is largely bereft of speculative flows, and instead helps grease the global wheels of capitalism. Cross Currency Swaps allow companies to transfer capital across borders without taking any currency risk. They allow firms to transform a potentially large (and ruinous – I’m looking at you, SNB) FX exposure, into a largely-manageable funding exposure that can be easily related to a real cost of “doing business”. It allows companies to fund overseas expansion in either local or domestic currencies, irrespective of whether the expansion is intended to be a cost-base (e.g. offshoring production) or a revenue-base (e.g. sales expansion into new territories).
Putting that into context
Of course, due to the global nature of the product, the DFA-reporting requirements do not capture the same proportion of the Cross Currency swaps market as e.g. USD Swaps. However, we have to work with what we’ve got at the moment- at least until European reporting requirements and the public dissemination of data are up to the US standards. For now, we have BIS reporting an average daily turnover figure of $54bn per day during April 2013 vs an SDR-derived average of between $5-and-$6bn per day for the whole of 2014. So a worst-case scenario means we see around 10% of the market, although this is likely to be significantly higher in some markets. For example, in Australia, local counterparties can use DF-equivalency to satisfy Australian derivatives reporting requirements, and hence report their AUD/USD trades just once to the DTCC SDR.
The available data from the SDRs is therefore far better than the aggregated weekly amounts we see from the European TRs. The data-coverage we have under DF is certainly significant enough to highlight trends and is useful on a relative basis, but we should try to avoid talking in absolute terms. Please bear this in mind when looking at some of the data below – which would benefit hugely from public trade-level European data…..
Which Products Trade?
For IRS and (single currency) basis swaps, this is a pretty cut-and dried question. However, for Cross Currency Swaps do we see Fixed-Fixed, Fixed-Float or Float-Float (“basis”) structures dominating trading volumes? For 2014, basis was the clear winner at 86% of volumes:
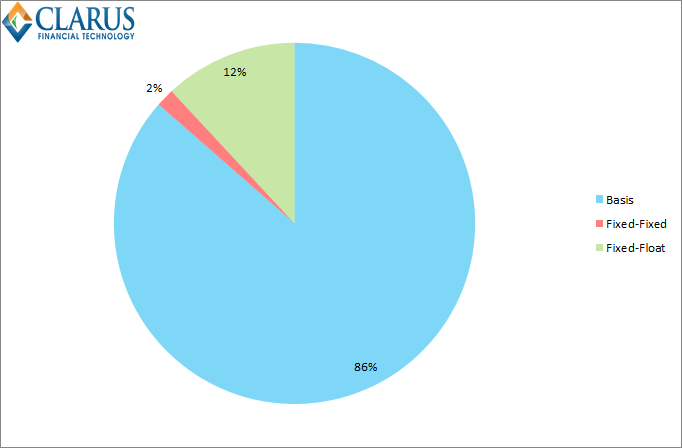
I am inclined to believe this split towards “Basis” is unfairly skewed due to the reporting bias. Many end-users of Cross Currency Swaps will enjoy a reporting exemption, leaving the banks and hedge funds to report their activity. These counterparties always trade basis as it is the most credit-efficient structure.
Which Currency Pairs trade?
We touched upon this previously, but we can see that USD/JPY was the most active currency pair during 2014, averaging over 50% of traded volumes. Remember that these comparisons are done in USD-equivalents and do not take into account maturity:
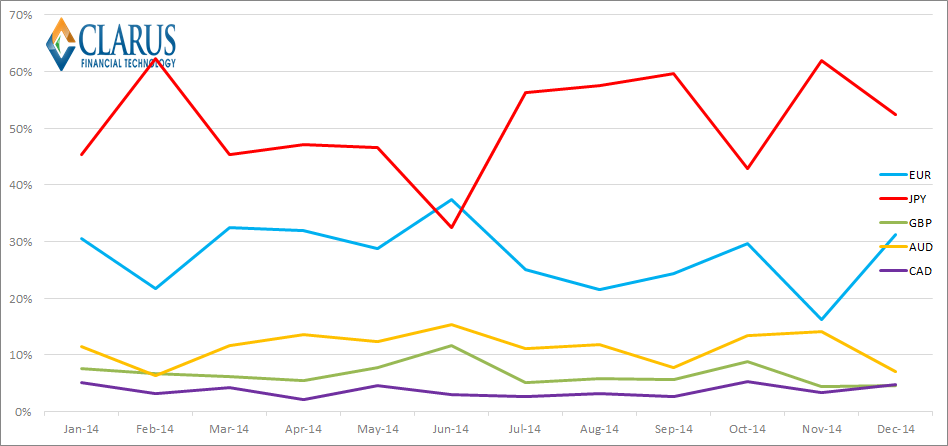
The relative ranking of currencies was fairly consistent throughout the year, with the numbers based on monthly volumes. To be fair, both EUR/USD and USD/JPY are highly volatile data series, so we would be well advised to refrain from drawing any conclusions based on “trends”.
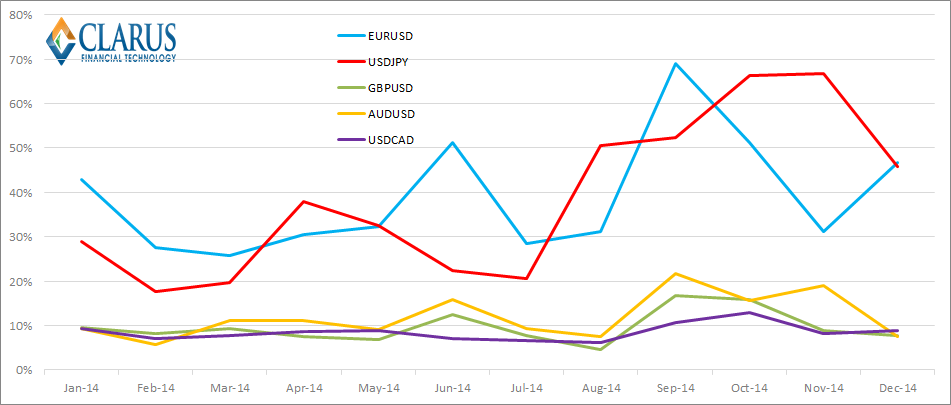
Indeed, this currency split was even more volatile for the on-SEF trades. Obviously, we are now taking an even smaller sample size. Nonetheless, this data is even more relevant for those execution-constrained counterparties. Plus, it is worth pointing out that SEF-derived data is marginally more reliable than the DTCC data, as it is consistently reported in the correct currency! Here we see a two-way tie between EUR/USD and USD/JPY for activity in terms of notional traded:
How times change!
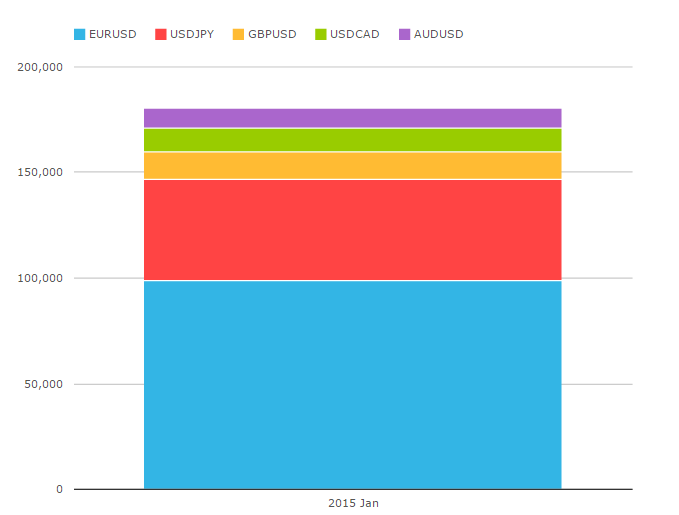
Finally, I wanted to look at the split by tenor, to see if the market share above still holds on a DV01 basis. I took the data from January 2015 – and low and behold, we see a sharp reversal in fortunes! EUR/USD has traded much more – best evidenced in SEFView:
So now I’m left scratching my head a little bit as to whether we can really take January volumes as a representative sample? Below I posit a potential explanation, but first have a look at how different the tenor split has been between EUR/USD and USD/JPY so far this year. The chart below shows the DV01, by percentage, that has traded in each tenor per currency:
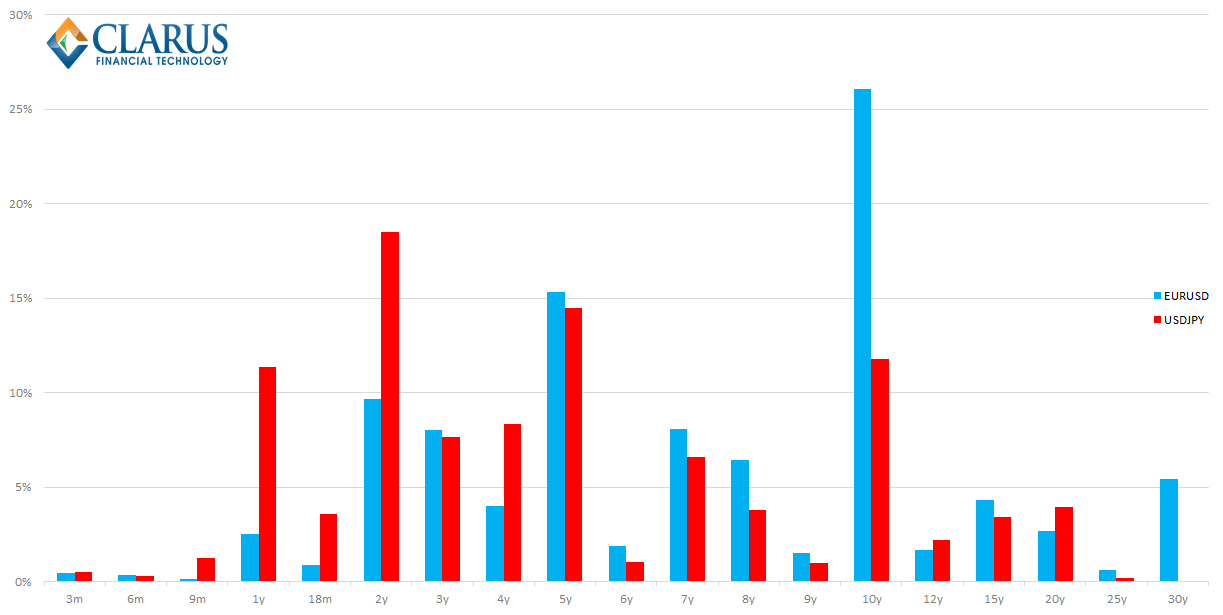
As we can see, EUR/USD has a huge skew towards trading in the 10 year maturity, versus far more risk being traded in the 2 years and shorter maturities for USD/JPY. Whether this is trading that is specific to the month of January could be a vital question for capital markets this year. Why? ECB QE.
One Theory…
I’m left wondering if this maturity skew in EUR/USD markets this year is down to the ECB and the newly announced QE programme. Is it one of the examples of a shift in Euro-denominated bond markets as investors demand positive yields and are therefore forced further out the curve? That could be a crucial theme for 2015 (and beyond….). It’s something that is part and parcel of Cross Currency Swap trading – we have previously seen sharp price trends in long-dated GBP/USD basis whenever the BoE’s APF was extended. Is this 2015 data suggesting this could become a structural feature of EUR/USD cross currency swap markets also? Maybe. To answer that question definitively, we need better data – particularly for European counterparties.
On which note, it is important to acknowledge that early identification of this trend would help both European issuers and investors alike. Whether it is project planning or duration management, if this is a structural change in markets it is important to identify this change as early as possible. Increased transparency in European OTC reporting would allow us to identify this emerging trend earlier and with better accuracy.