Following on from last weeks article on EMIR Trade Reporting and Public Data, I wanted to look at a specific product (Cross Currency Swaps) and see what the EMIR data shows and how this compares to the Dodd-Frank Act data.
Cross Currency Swaps are an important global product with long dated trades in currency pairs such USD/EUR and USD/JPY. The large FX Risk in these products means that they are bi-lateral trades and not cleared by any CCP or subject to clearing or execution mandates.
EMIR DTCC Trade Repository
It so happens that the DTCC EMIR Public data provides a specific report; Table 4b, Cross Currency Swaps by Currency of Denomination. And as the major swap dealers report to DTCC, we may assume that it has the vast majority of the EU volume in this product.
So lets start with what information we can see from this report for the past few weeks.
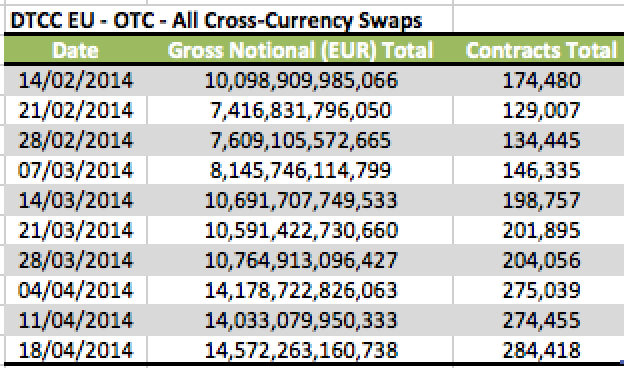
Which shows:
- The outstanding notional on 18-Apr is EUR 14.6 trillion
- From 284,418 trades
- Giving an average trade size of EUR 51 million
- The large differences in prior weeks, can only be explained by improved reporting coverage
- With the last 3 weekly periods seem to show a settled base
- While prior weeks show huge increases that cannot be the result of executed trades
- The change in contracts total for each week is not a good indicator of weekly trade volume
- Due to the fact that we do not know the number of trades maturing or terminated in that week
- And what about Currency of denomination?
- Or which currency pairs have the most volume?
- Unfortunately this is not currently available (despite the report title).
That is all the information we can get on Cross Currency Swaps from any of the EMIR Trade Repositories.
US CFTC Swaps Report
Lets now look at what we can find from the US by looking at the CFTC Weekly Swaps Report, which aggregates data from the US SDRs and has a number of reports specific to Cross Currency Swaps.
Lets look for comparable figures by using reports 10a, 11a & 12a.
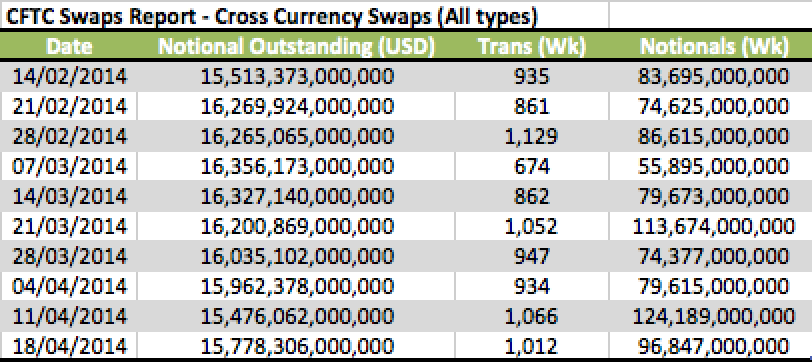
Which shows:
- Outstanding notional on 18-Apr is USD 15.8 trillion
- Compared to the EUR figure of EUR 14.6 trillion or $20 trillion
- Interesting, so ball-park comparable
- But can we sum these two figures to arrive at a global market (US & EU) of USD 35 trillion?
- Probably not.
- Why?
- Because we are not sure that the same trades are not included in both the US and EU figures.
- As USD/EUR is the largest currency pair
- And the majority of USD/EUR will have a US firm on one side and an EU one on the other
- Which I expect means they are reported by each side to their national repository
- And so adding the figures would lead to double-counting
- (If anyone knows any different, please let us know)
- The CFTC Swaps report also provides transaction counts and notionals in the week
- Unfortunately the report says these include new trades, terminations, amendments and novations
- Which means we cannot use these to understand how much volume trades in the week
- We cannot even use these to explain the week to week change in outstanding notional
- (As we do not know the maturing trade volumes)
- It would be much more useful to have the transaction volumes broken out by transaction type
- So new trades, terminations, amendments and novations
- Knowing these we could back out the maturing trades and so explain the week on week change
CFTC Swaps Report – Cross Currency Basis Swaps
What else can we learn from the CFTC Swap reports?
Perhaps a break-down by type of Cross Currency Swaps and a break-down by Currency?
For type, we expect the following three types:
- Basis Swaps, the majority, where both legs are floating (usually Libor 3m)
- Fixed-Float, where one leg is floating and one fixed
- Fixed-Fixed, where both legs are a fixed rate
Swap Report 10b of 18-Apr shows the following.
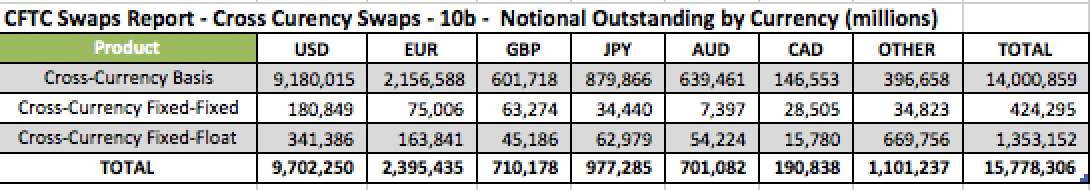
From which we can observe:
- Basis Swaps are $14 trillion or 89% of gross notional outstanding
- Fixed-Float are $1.35 trillion or 9%
- Fixed-Fixed are $424 billion or 2%
- Currencies are shown with USD as the largest
- Followed by EUR
- Then JPY, GBP, AUD
- However this raises a number of questions.
- What does the $9 trillion of Basis Swaps under the USD column refer to?
- Does it include trades where one leg is USD and one leg EUR?
- Or does it exclude these as they are in the EUR column?
- Does it include trades where one leg is USD (so spot pairs)
- In which case only EUR cross pairs (EUR/JPY) are under the EUR column
- Or does it include trades where side1 is USD and side2 any other currency?
- And the same for EUR; side1 is EUR and side2 is any other currency?
- My guess is the last
- (If you know the answer, please let us know)
- If this last is indeed the case then the Currency denomination is not at all useful
- What we need to see is the volume in USD/EUR, USD/JPY, USD/GBP
- And that does not seem to be available in any report.
How can we get an insight into volume by currency pair?
SDRView
Using the USD DTCC real-time public dissemination feed as a source, SDRView is able to construct the daily volume in each currency pair by aggregating side 1 and side 2 currencies appropriately.
While this cannot give us outstanding notional in each currency pair, it can give us the daily or weekly volume in each.
Lets look at the weekly volumes by currency pair, first as trade counts and then as gross notional.
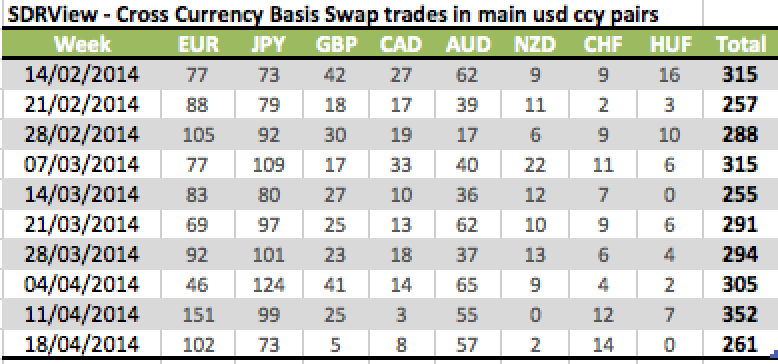
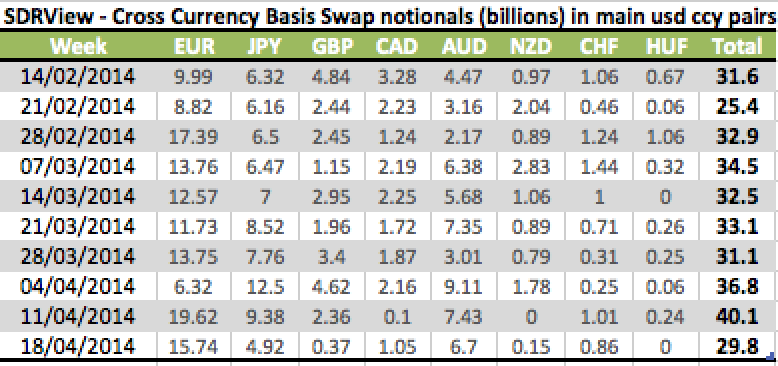
From which we can observe:
- Weekly volume in these 8 pairs is roughly 300 trades and $30 billion
- USD/EUR is the largest currency pair
- With a weekly high of $19.6 billion or 151 trades in the week ending 11/04
- USD/JPY is the next largest pair
- With a weekly high of $12.5 billion or 124 trades in the week ending 04/04
- The other active pairs are USD/GBP, USD/CAD, USD/AUD, USD/NZD, USD/CHF, USD/HUF
- (This is specific to Basis Swaps)
- (For Fixed-Float we would see volume in USD/CNY, USD/MXN, USD/TRY)
- However we need to recall that the gross notionals in the real-time public feeds are capped
- So the actual weekly notional volume is higher
- Can we get an idea how much higher?
- Yes we can.
SEFView
Using SEFView we can see the On SEF Cross Currency Basis Swap volumes reported by the SEFs themselves.
And these volumes are not capped.
Lets construct a table using SDRView On SEF data and SEFView data.
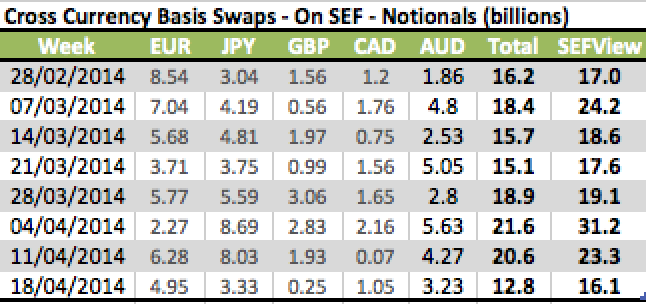
From which we can see:
- A Total column of the SDRView capped notional
- A SEFView column of gross notional
- Showing that the understatements varies week by week
- For the week of 18/04, it is $3.3 billion or 26%
- For the week of 04/04 its is $9.6 billion or 44%
- The share of On SEF varies significantly week by week
- For the week of 18/04, it is $12.8b vs $29.8b or 43%
- For the week of 04/04 it is $21.6b vs $36.8b or 59%
- It varies even more for currency pairs
- Either way for a non-cleared and non mandatory SEF product, these percentages are pretty good
- Showing the benefits of On SEF for a significant chunk of volume overrides the downsides
Summary
Cross Currency Swaps are an important global product in the Interest Rates asset class.
The EU Trade repository at DTCC shows outstanding gross notional of EUR 15.8 trillion, equivalent to USD $20 trillion.
The US CFTC Swap report, which aggregates USD SDRs, shows outstanding gross notional of USD 15.8 trillion.
However we probably cannot simply add these numbers up to get a US and EU total.
As doing so would result in double-counting of these bi-lateral trades where one party is a US one and the other EU.
The CFTC Swaps report provides a lot of additional detail, including product types and currency denomination.
However currency-pair volumes do not seem to be available.
SDRView can show daily or weekly volumes by currency pair.
As these volumes are capped for block trades, we need to use SEFView to see the actual (On SEF) gross volume.
Perhaps one day we will be able to get all the data on volumes that we need from one place.
Perhaps not.