Today I continue my analysis of equity derivatives data within the SDR, to see what other useful nuggets of data lie within there.
Lets pick up from our previous analysis from a couple weeks back. As a refresher, I began by:
- Taking all March 2016 equity data (847,648 trades)
- Removed anything that was post-trade (terminations, increase, etc)
- Removed cancelled trades (harder than it sounds)
This left us with 203,825 trades, distributed as follows across taxonomies:
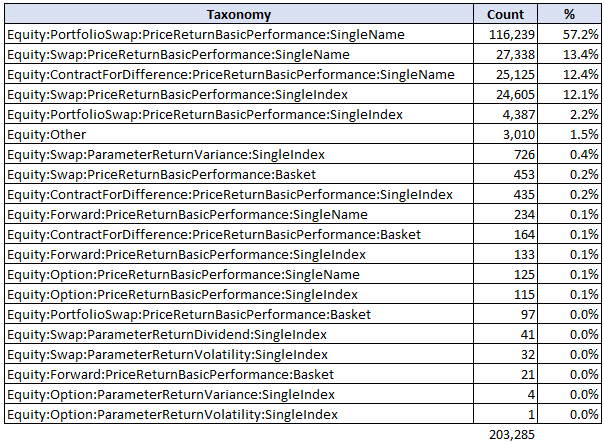
There is so much Single Name trades in the data. I’ll ask again – why is there Single Name data in the CFTC data set? Regardless, let’s begin paring this down to just Index-related trades:
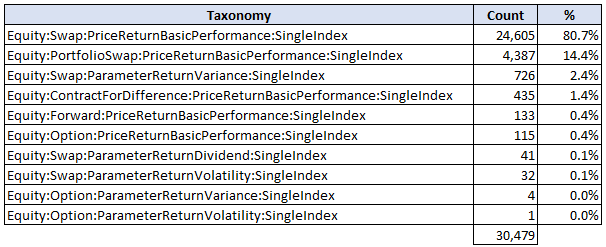
- Remove all Single name trades
- Remove “Other” swap types
- Remove Basket. Shame, but there is zero information on the contents of the basket, so no choice but to remove. Hopefully they really are bespoke baskets.
This should leave us just with Single Index products:
If we then break this down by currency, we find something rather concerning:
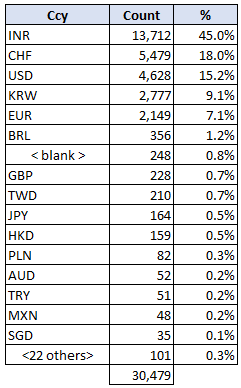
Surprising how much non-USD equity index products are traded. Very surprised that, being US-named trading data, that USD is only 3rd in the list behind Rupee and Swiss.
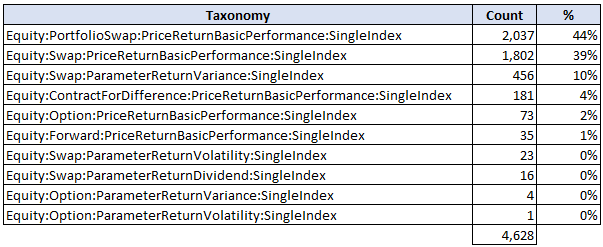
So one last bit of scrubbing, let’s whittle this down to only the 4,628 USD Equity Index Trades done in March 2016:
I was surprised to see that this 4,628 USD single index swaps spanned over 400 indices. The table below shows the top ones. I have looked up the indices that were not obvious to me, and added an index description:
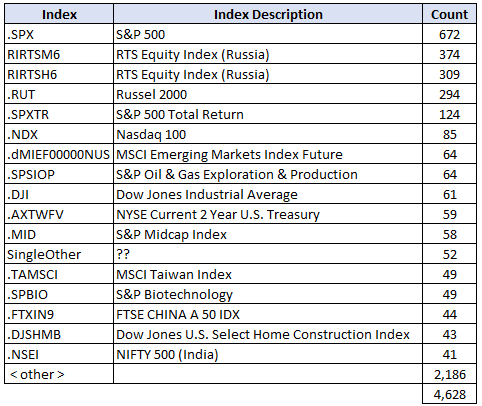
Once again, I am a bit surprised at the results here: 2 of the top 3 USD denominated equity indices are… Russian?! Seems to be the case – a non-deliverable RUB equity index.
It’s all a bit anticlimactic, given that out of the starting universe of 200,000+ valid trades, we find ourselves with not a heck of a lot to look at. Particularly as I had been told recently that there is more equity index trading in the OTC market compared to futures. Clearly this data does not corroborate that.
Even worse, out of the 796 S&P 500 swaps (both SPX and SPXTR) that remain, we already looked at nearly 400 of them last week when we examined Variance Swaps.
The bulk of the remaining S&P 500 swaps are “Price Return” swaps. Let’s try to salvage this analysis by learning about these swaps.
What Is A Total Return Swap?
Fundamentally a Total Return Swap (TRS) is one whereby one party receives the change in asset price (eg S&P 500) in exchange for paying periodic interest payments and/or a fee.
I used an ICAP document to study some of the specifics, and learned there are actually two variations which seems to be:
- Price Return (PRS) – The asset side is only the change in the asset price (S&P goes from 2,000 – 2,100, so returns 100)
- Total Return (TRS) – The asset side includes the change in asset price as well as any other returns (I liken it to appreciation plus any dividends)
It turns out that the index used appears to consider these “other” returns such as dividends:
- The Price Return swaps are based on SPX index (currently ~2,100)
- The Total Return swaps are based on SPXTR index (currently ~3,950)
Any Good Data points?
The data is thin, but a few notable metrics I can glean from the data:
- Average S&P 500 TRS notional: ~45,000,000 USD, with 12 trades above the 250,000,000 cap size.
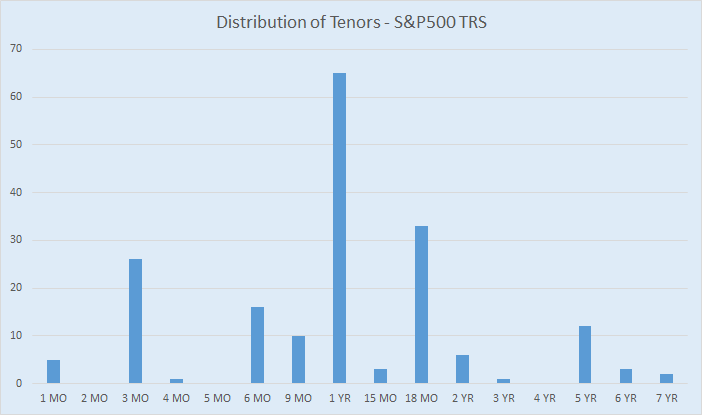
- Many trades do not have maturity dates. The most common tenor being ~ 1Yr (see chart below).
- No trades show an underlying index for the interest rate leg, and often the price for the interest rate leg is quoted as 0.
- Where the rate is not 0, the price, in basis points, ranges from roughly -40 to +40. Hard to say if this is a fixed rate or a spread above LIBOR.
Summary
There is a great deal of equity derivatives data coming out of the SDR. However there seems to be a very limited amount of equity index data for standard indices. I’m left pondering if perhaps some (or most) of the equity index swaps are being reported as “single name”, or portfolio swaps on “custom baskets”, which masks the content of the trade beyond recognition.
If I hadn’t been told otherwise, I would conclude that equity index swaps barely trade.
That is, unless you are looking for swaps data for Russian and Indian indices, for which you might find some useful nuggets of data within here.
We’ll keep looking.