Given the continuing uncertainty around Brexit as the UK government struggles with a parliamentary vote, I thought it was time to re-visit EUR Swap volumes, which I last looked at in early October 2018. I noted then that Eurex market share in the third quarter was 0.96% and little changed from the corresponding quarter a year earlier.
Our customers, who have access to CCPView, are able to track cleared volumes month to month, week to week or day to day and will not be surprised by the below, so for the others here are the details.
Volumes Pick Up
A chart of EUREX EUR IRS volumes (single-sided gross notional) by month for the past 18 months and split by Dealer and Client volumes, shows volumes picking up noticeably in the most recent two months.
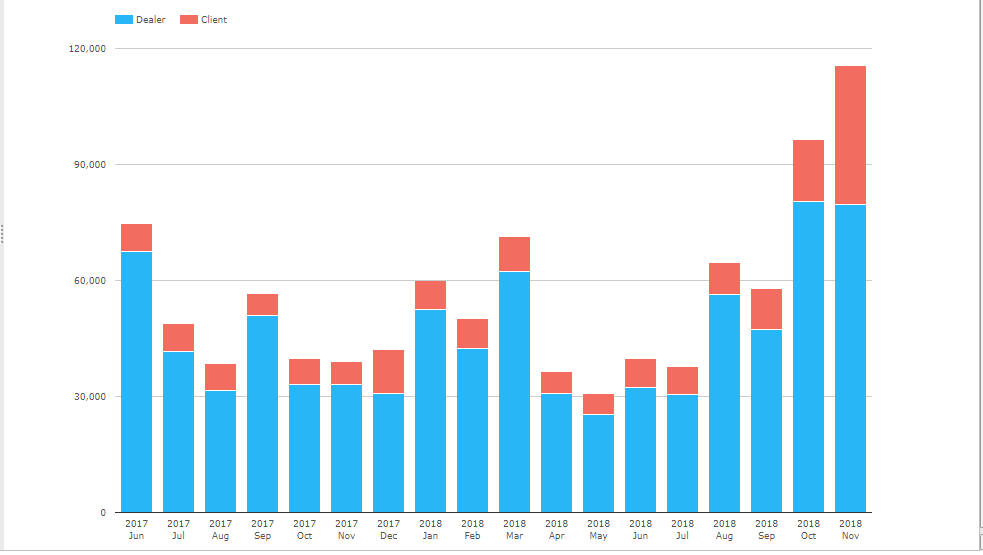
Showing that:
- While Sep 2018 overall volume was similar to Sep 2017
- Oct 2018 and Nov 2018 are significantly up from 2017
- Nov 2018 volume was EUR 116 billion gross notional with EUR 36 billion in client and EUR 80 billion in dealer volume
- This is up 200% from the total of EUR 39 billion in Nov 2017
- Of particular interest is the fact the client volume of EUR 36 billion in Nov 2018 is significantly up from the EUR 5 to 10 billion range in prior months in 2018
- Oct 2018 at EUR 96 billion was the second highest month on record
Looking at weekly volumes for the last 3 months.
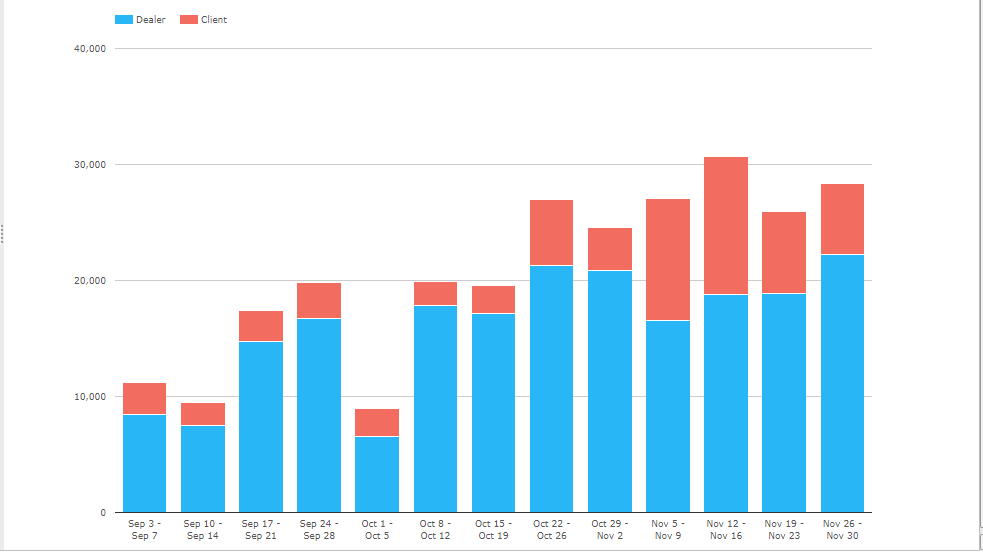
Shows that the pickup in volumes began in the week starting October 22, 2018 with a doubling of client cleared volume from EUR 2.4 billion to EUR 5.7 billion. The highest client volume was in the week starting November 12, 2018 with EUR 11.9 billion.
November 15, 2018 had the highest single-day client cleared volume of EUR 4. 3 billion, while November 22, 2018 was one of the highest dealer volume days at EUR 9 billion.
So we are certainly seeing more active client activity at Eurex since October 22, 2018.
Market Share
Lets now check EUR Swap volumes at LCH SwapClear to confirm that Eurex indeed has a higher market share in October and November as opposed to overall market volume itself being much higher.
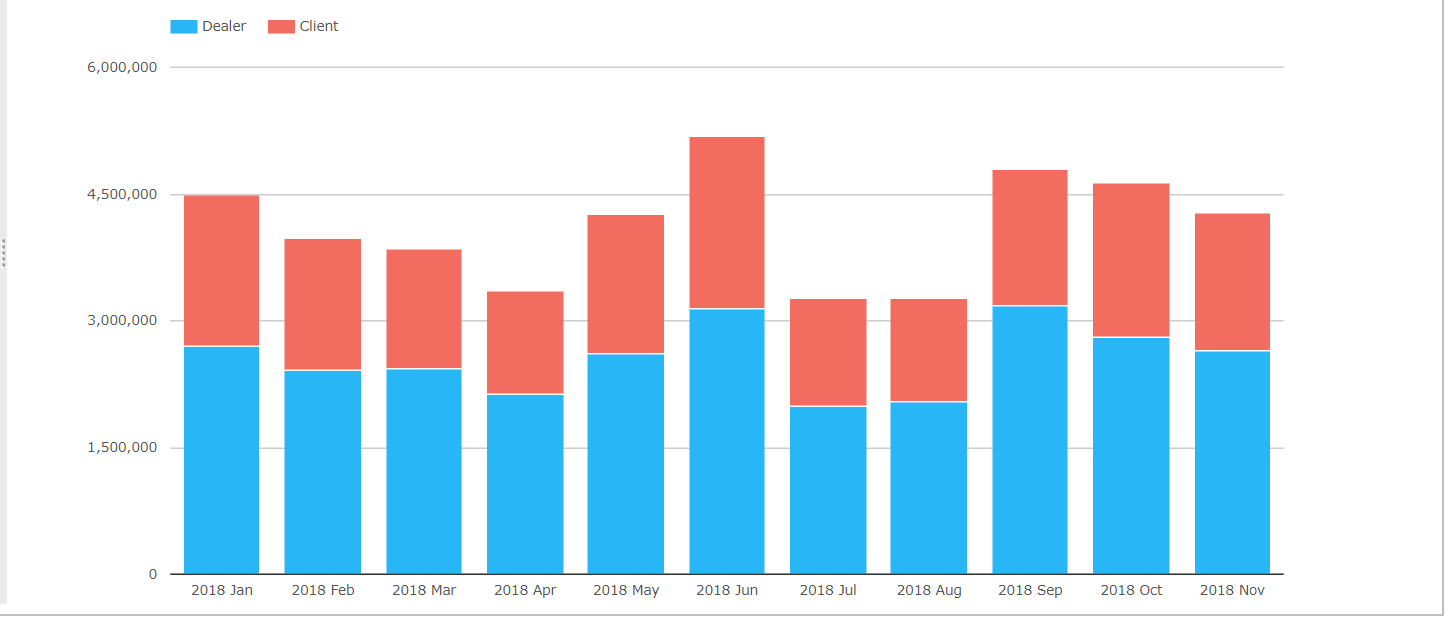
Showing monthly volumes in 2018, split by Dealer and Client as single-sided gross notional, which average EUR 4.6 trillion a month over the most recent 3 months.
We see that Oct and Nov are not higher than Sep, so we can rule out that the Eurex increase is due simply to higher overall volume in the swaps market.
Between Jan and Sep 2018, Eurex volume in EUR IRS has averaged 1.2% market share compared to 98.5% at LCH SwapClear, with a low of 0.7% and a high of 1.9%. In October the Eurex share increased to 2% and in November to 2.6%. The increase is a little more pronounced in client volume, where the Jan-Sep 2018 average of 0.5% has increased to 2.2% in November.
So while LCH SwapClear client volume of EUR 1.6 trillion in Nov 2018 is far higher than the Eurex figure of EUR 36 billion, showing the long way that Eurex has to go to get to 10% or 20% market share, the jump from 0.5% to 2.2% is a significant step.
It will be interesting to see what December 2018 and January 2019 volumes show.
Those of you with access to CCPView won’t have to wait for my next blog to find out.
For those without, surely you need to get access?
Please contact us for a subscription.
Onward.
CCP Basis Spreads
Another point of interest is that the difference in price in EUR Swaps at Eurex and LCH has been volatile in the last few months, as this chart courtesy of Tradition prices shows.
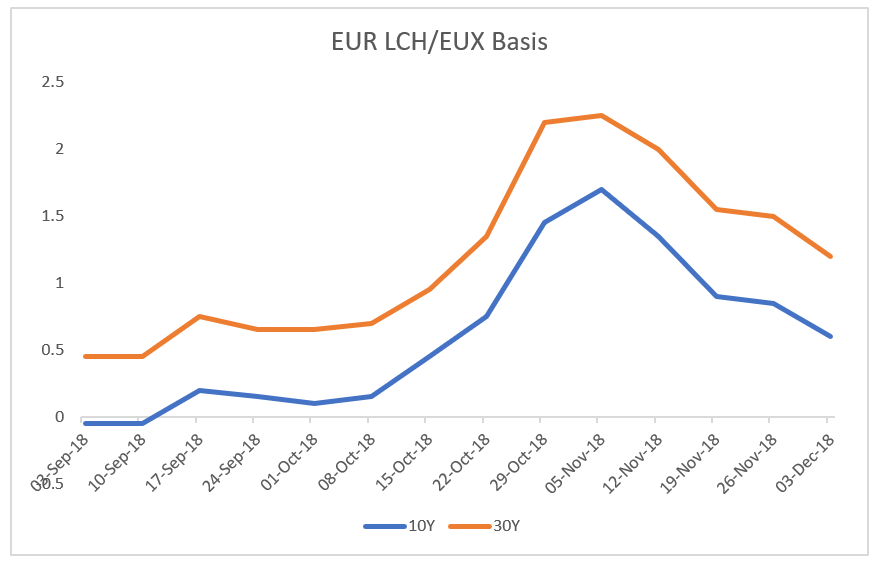
After narrowing down to to zero in the preceding months, it is interesting that on October 15, 2018 the 10Y basis increased to 0.45bps and the 30Y to 0.95bps. On October 29, 2018 these had reached 1.45bps and 2.2bps respectively.
Surely it is not a co-incidence that these are the same weeks with the pick up in cleared volume at Eurex?
Volatility begets volume or is it volume begets volatility?
Not sure which is the cause and the effect here or if in-fact they feed on each other?
The basis then narrowed again to end at 0.6bps and 1.2 bps on December 3, 2018, a high to low move in our 3 month period of 1.75 bps for both the 10Y and 30Y.
Significant enough to cause material PL swings and one to be watched and positions managed.
It will be interesting to see how long the LCH/EUX basis remains volatile and when and at what level it stabilises at.
The End
That’s all I have time for today.
I had wanted to look at the Swap maturity tenors that are cleared at Eurex.
As well as other products; OIS, Basis, FRAs, each with their own trends.
Daily cleared volume in December to date.
Not to mention outstanding notional as well as volume.
But those are now tasks for another day.
If you have CCPView access are welcome to check yourself.
Thank you for reading to the end.