The most recent quarter of FCM data is out. As usual, I’ve pieced together some updated metrics.
If you’ve been keeping up to date with our blogs on this topic, you should remember the running themes:
- Concentration of business in a handful of firms
- Any growth in the business has been in swaps
- European firms shrinking, or not keeping up with growth
Let’s dig in.
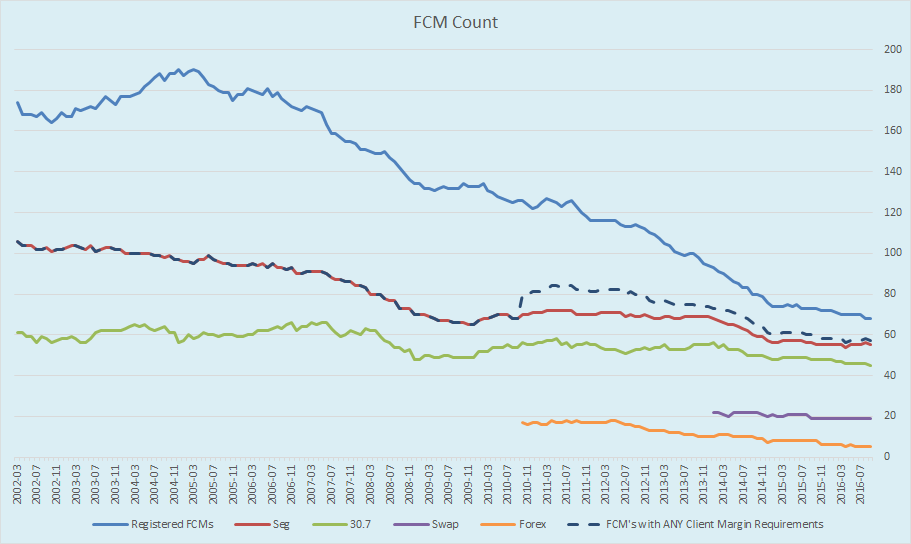
FCM Count
We’ll begin with a count of the registered FCMs every month since reporting began in 2002. There are now only 68 FCM’s, down 2 from last quarter, and of course well off the 2004 peak of 190 firms.
Required Margins
Next we graph the amount of margin held by FCMs, per regulatory bucket.
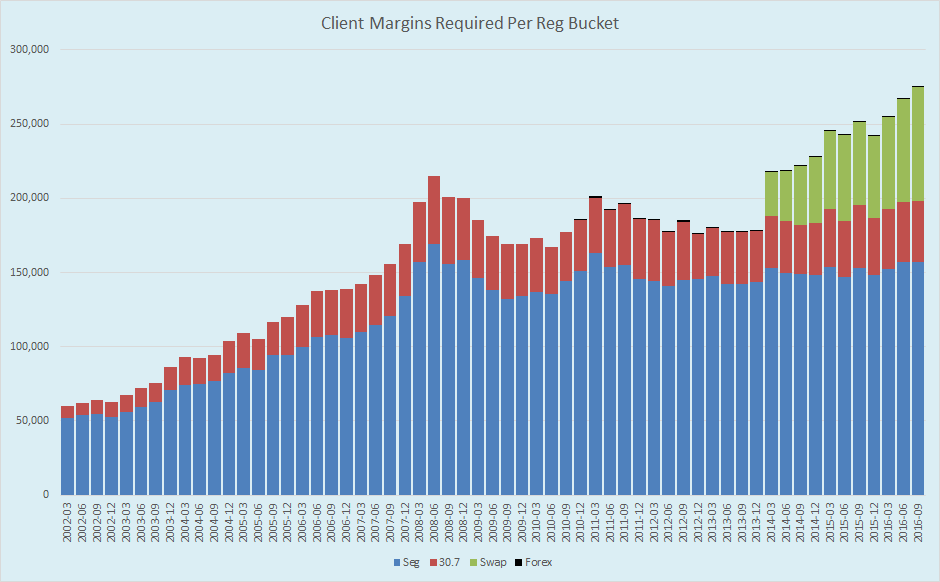
Like the previous quarter, there was overall growth in margins pledged. And like last quarter, the growth has come solely from cleared swaps. As we’ll see later, this swaps number increased from $69bn to $77bn in the quarter.
League Tables
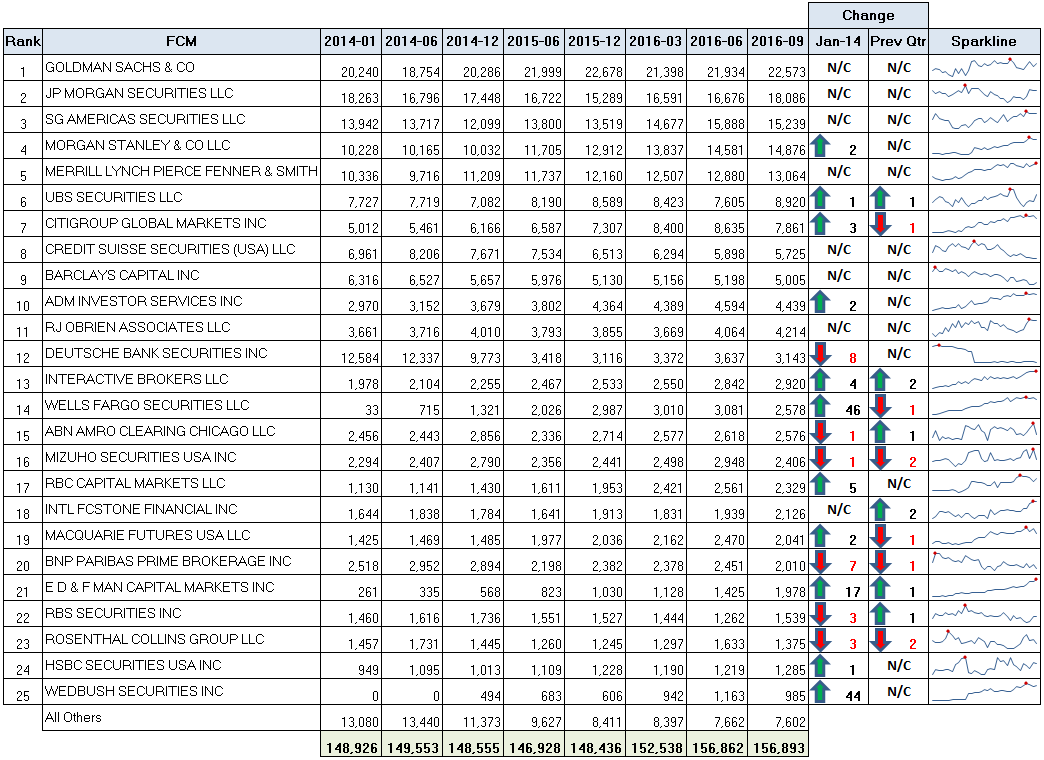
We now turn to the league tables for the industry. Starting with Cleared Swaps:
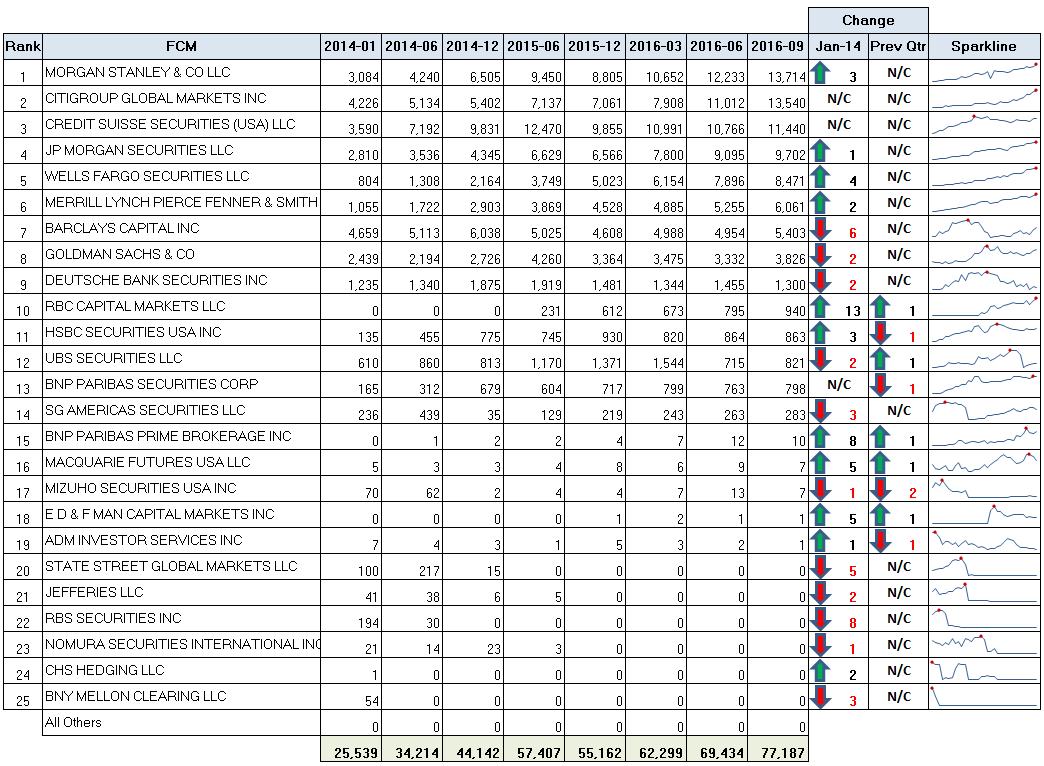
Some things to note:
- I’ve added two Change columns, so we can now see the performance from both January 2014, as well as from the previous quarter (June 2016).
- The only changes in the most recent quarter have been in a few non-US names dropping down a spot.
- Only 19 firms currently have any required margins.
- Only 14 firms have anything significant.
- Only 9 firms have margins over $1bn.
- The Sparklines are mini, monthly charts since Jan 2014. It’s quite easy to make out who the consistent performers are by looking at this.
- The top 3 FCMs now account for 50% of the business, slightly more concentrated than last quarter.
I find the growth in the total swap margins interesting, from $55bn at year end 2015, to $77bn today. I turned to CCPView to corroborate this growth, selecting the 4 main clearinghouses utilized by US FCMs (CME IRS & CDS, ICE, and LCH). The screenshot of CCPView below
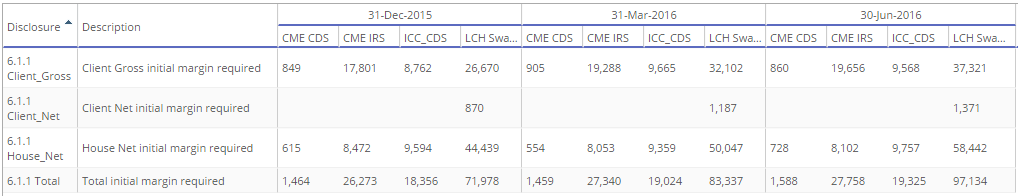
Of course CCPView data is global, so includes margins charged to non-FCM’s (eg European SCM’s), so the global data is much larger. here is a comparison:
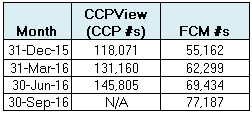
I should also note that CCPView disclosures lag by a full quarter, so we do not have September 2016 as yet. However, it is interesting to see that the growth in US FCM swap margins is growing at a similar pace to global swaps growth. US FCM’s account for a consistent 47% of global required swaps margins for these clearing houses.
Futures and Options
Now onto the Futures & Options (Seg) rankings:
A few points here:
- The top 2 firms increasing their business further
- Concentration of the business slightly increases:
- Top 2 FCMs now over 25% of the business (25.9%)
- Top 10 FCMs still at 73% of total business
Combined League Table
And to wrap up, combining all 4 regulatory buckets, our league table as of September 2016:
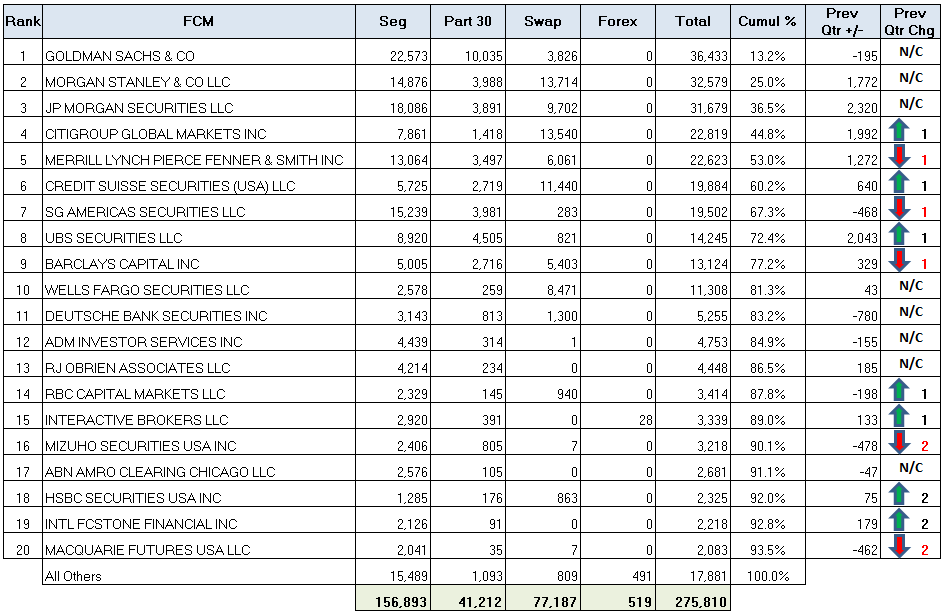
I’ve added a couple columns here to show:
- Change in total required margins from the previous quarter (“Prev Qtr +/-“)
- Change in ranking from previous quarter (“Prev Qtr Chg”)
Just a couple observations:
- Goldman Sachs still clear #1
- Overall concentrations also slightly up:
- Top 5 now 53% of the business (vs 51.9% in June)
- Top 10 now 81% (vs 80% in June)
Summary
The general theme continues from our March and June reports:
- The growth in clearing is in swaps
- European banks stand out as retreating, or not growing as much as US firms
- The business is concentrated within the top 5 or so firms
A bit of a broken record, particularly if you are concerned with the reduction in firms in this space and the increased concentrations. The only optimism would be that the industry is growing in swaps!