- Welcome to a review of Clarus data for 2019.
- Cleared Rates markets are a $2.7trn-per-day market in 2019.
- On top of this, Compression accounts for a further $2trn of activity every day.
- Continued growth in clearing, electronification and compression coupled with a shortening of maturities have been identified by the BIS as key drivers for Rates markets.
This week, the BIS released their most recent Quarterly Review. It includes detailed analysis of the latest Triennial Survey from April 2019. I encourage all of our readers who have an interest in the data behind our markets to take a read. There are important insights in subjects close to this blog, including Compression, Clearing and FX markets.
After reading the report (which cites Clarus a number of times by the way!) I was left wanting to run some high-level numbers of our own as we approach the end of the year.
Therefore, let’s take a look at what has happened with our data over the past 12 months.
Cleared OTC Markets are Huge
We take for granted the transparency offered by Clearing. However, it is well worth noting that we wouldn’t even know the basics, such as which are the most traded currencies, without the daily transparency provided by CCPs via CCPView.
In cleared Interest Rate Derivatives over the past 12 months, we have seen the following volumes:
Showing;
- Cleared volumes are huge, and in June 2019 hit an all-time monthly record of $70trn in a single month.
- However, it’s not like we hit record volumes every single month. For instance, November 2019 saw lower volumes than November 2018.
- Total volumes over the past 12 months were $686trn (ADV of $2.7trn, monthly average $57.2trn).
- As the BIS highlight, more of the market is now Clearing than ever before.
And in terms of the top 10 currencies traded in 2019:
- USD accounted for 50% of volumes ($342trn in the past 12 months, $1.4trn ADV).
- EUR at 24% ($165trn/ADV $0.7trn)
- GBP at 10% ($68trn/ADV $0.3trn)
- AUD at 6% ($40trn/ADV $0.16trn)
- JPY at 3% ($18trn/ADV $0.07trn)
- CAD
- SEK
- MXN
- CNY
- NZD
I was certainly surprised to see MXN and CNY so far up that list. Look out for blogs on those markets coming soon for deeper dives into the data.
On-SEF Trading
The BIS report mentions electronification a few times, highlighting it as a key trend in both FX and IRD markets. What better way to track the electronification than tracking on-SEF trading?
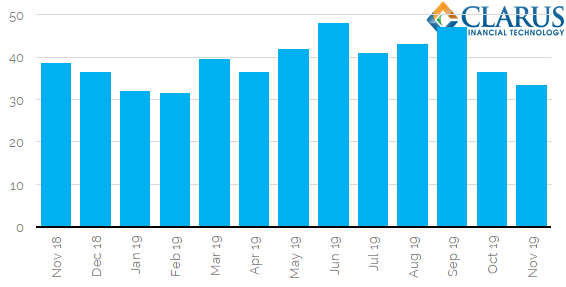
Looking at SDRView, we see the following percentage traded on-SEF for vanilla Fixed-Float interest rate swaps:
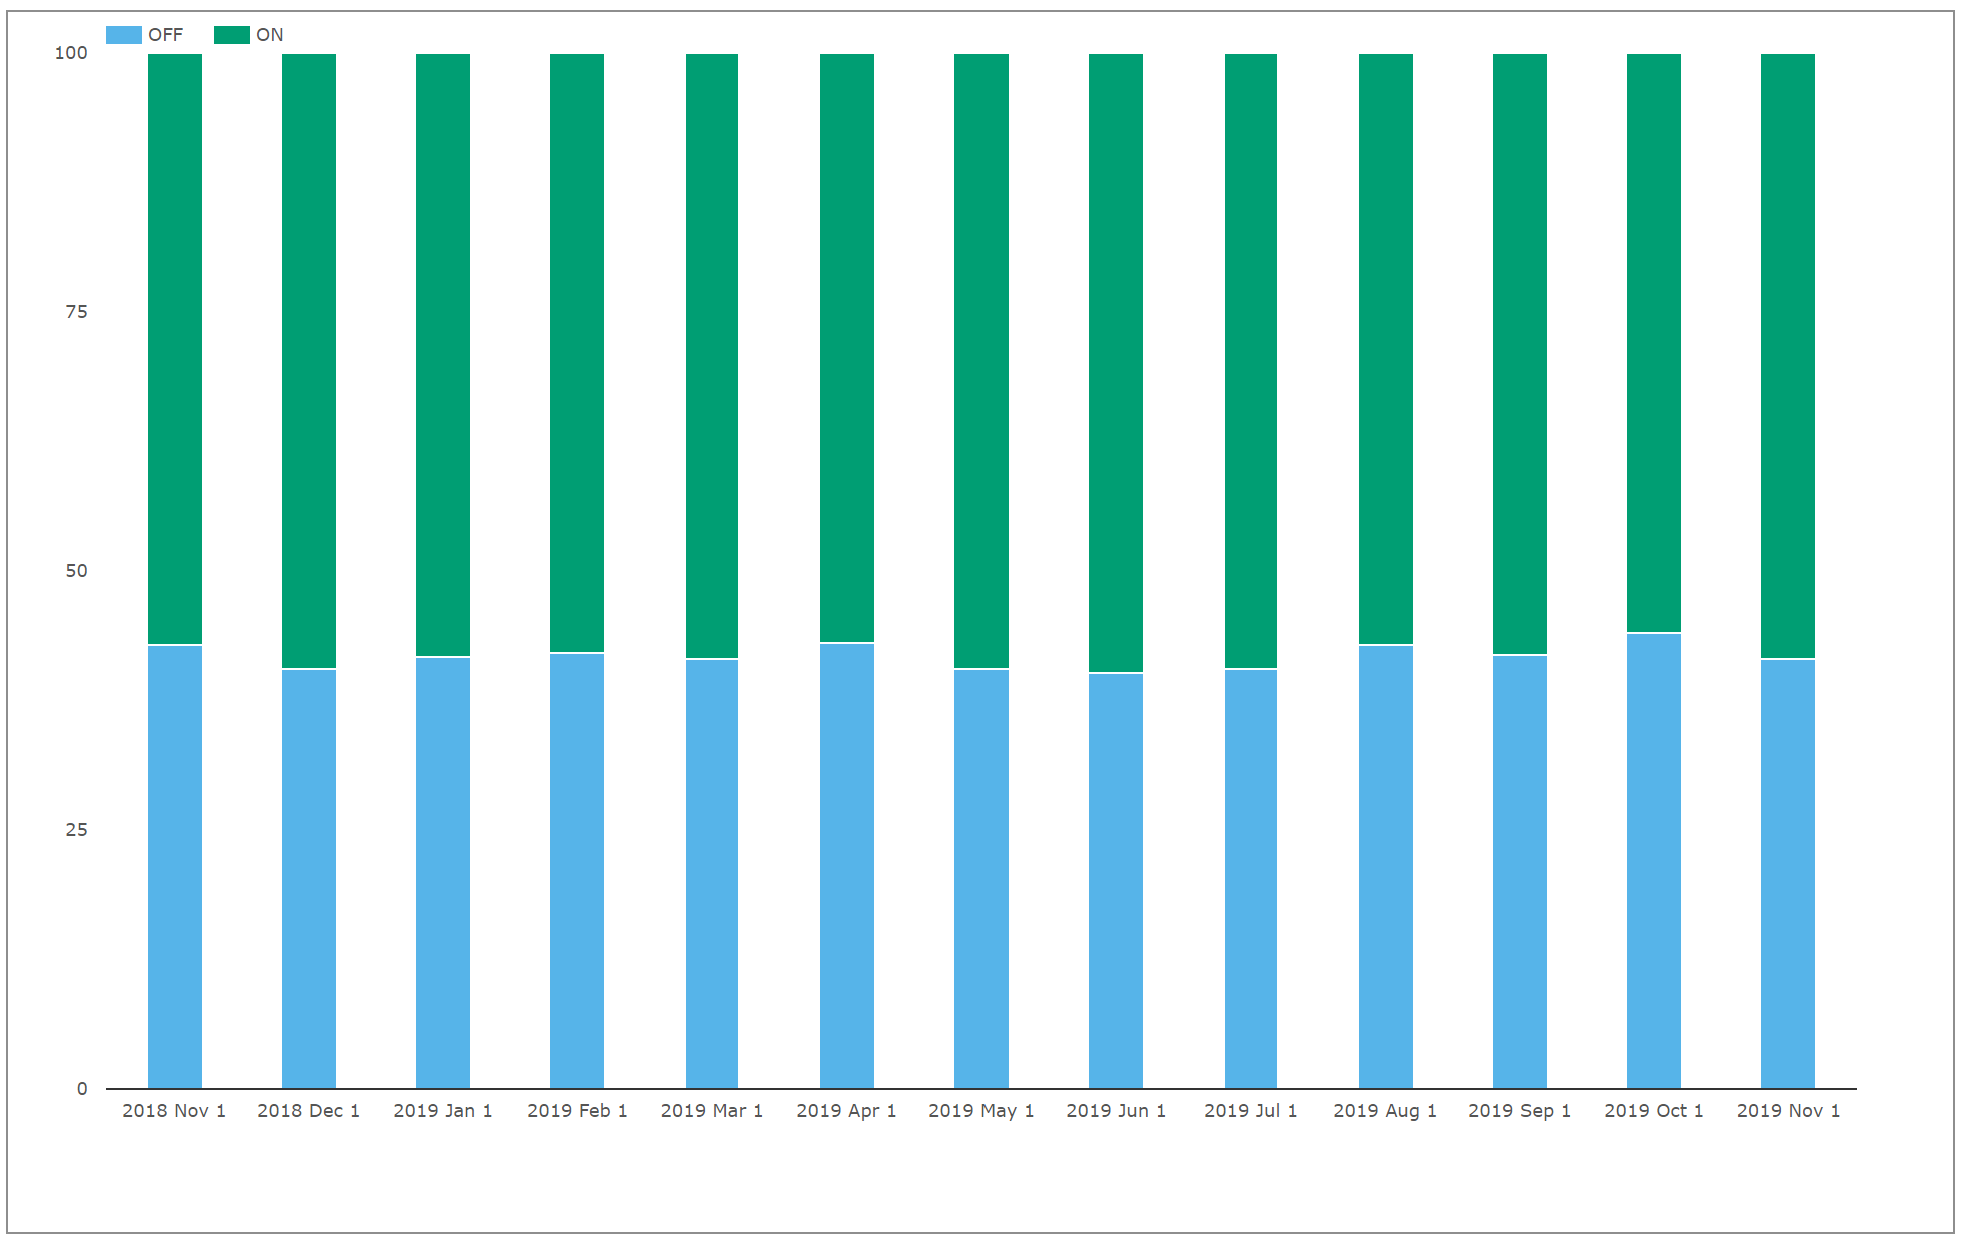
So, we started the year at 58.3% trading on-SEF. And… 58.5% traded on-SEF in our most recent month! Not much of a trend to report there.
The goal of this week’s blog is to point out high level numbers, but I cannot resist drilling down a little into the detail. For example, the same chart for OIS trades shows that 72.6% of OIS is still trading OFF-SEF. This shows how much work is still left to be done in the potential electronification of Rates markets.
Running the same chart for CDX trades in USD:
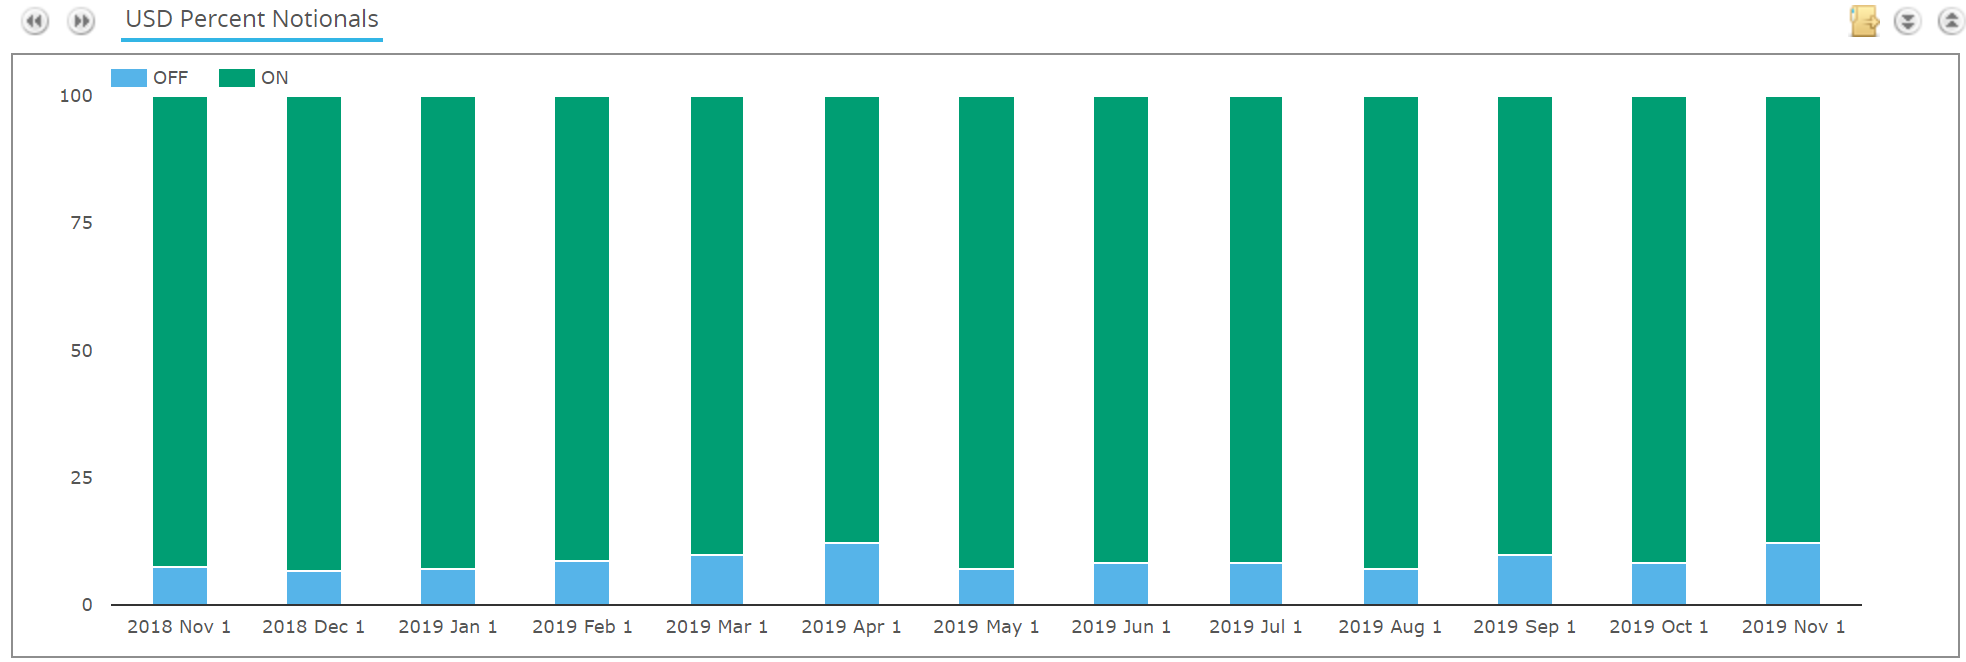
In the past 12 months, 91.2% of CDX have been executed on-SEF, further highlighting the gap that SEFs in Rates markets still have to fill.
FX SEF trading is an interesting one to round up this section with:
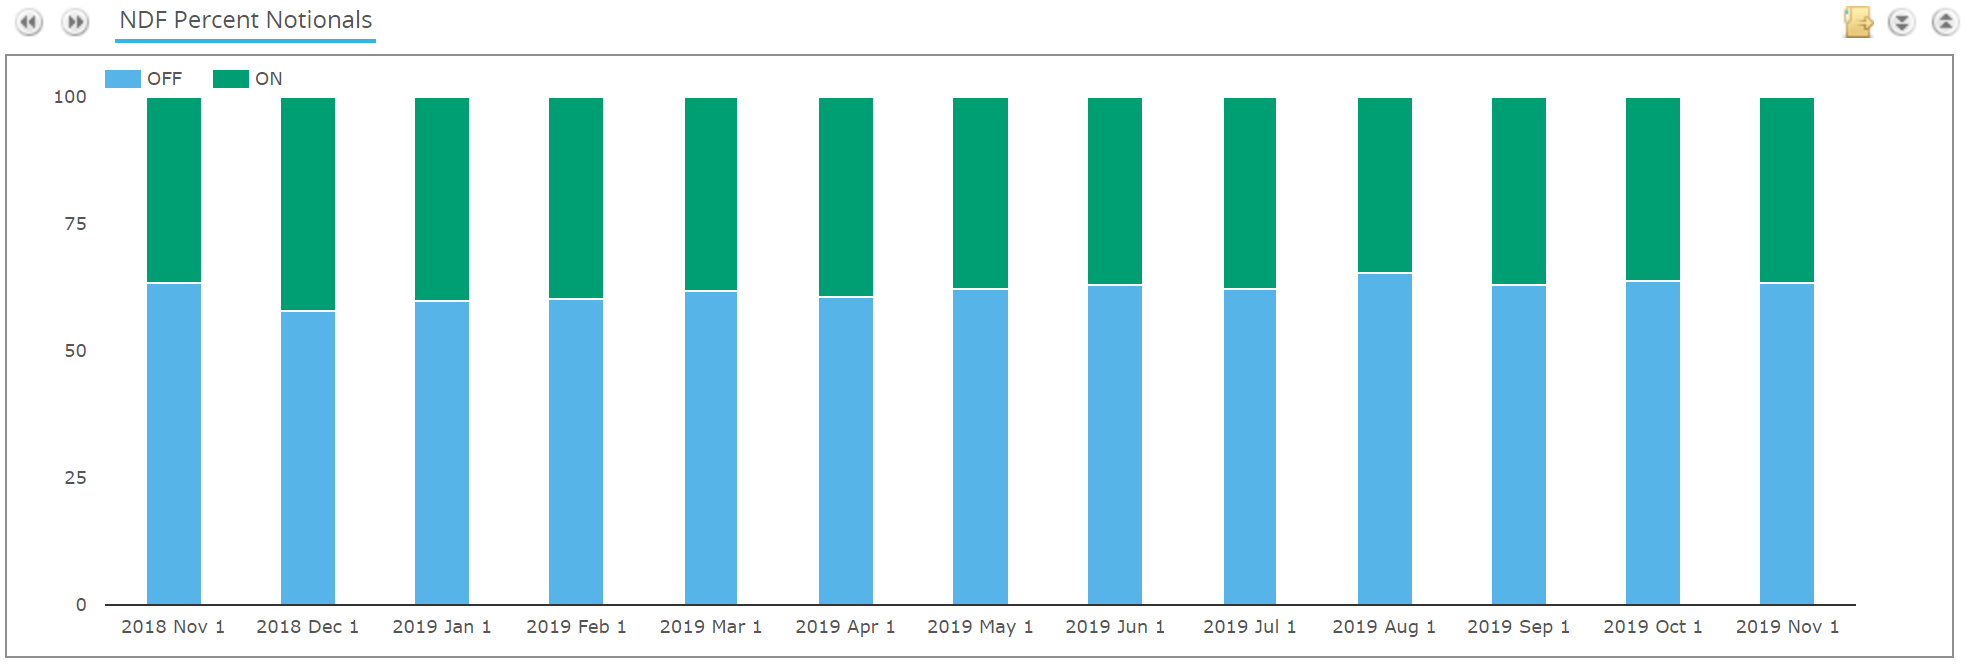
When we look at USD vs BRL, CNY, INR and KRW we find that 62% of trades are traded on-SEF. Okay, this is only a portion of the overall NDF market, but it is still striking that a greater proportion of NDFs trade on-SEF than IRS.
From every chart I see, it looks like IRS trading on-SEF can only increase from here. I wonder whether it will take a precise catalyst to change?
Compression
The continued rise of Cleared volumes means that Compression continues to grow (Compression is more effective in a cleared environment thanks to standardisation of valuations and a single-node for netting).
There is a fascinating section from the BIS on Compression:
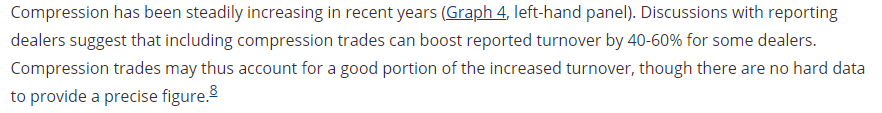
Please take the time to read the whole article, which explains how these portfolio-maintenance activities can inflate the reported turnover volumes in the BIS Triennial data. It’s another reason that we prefer the transparency of CCP data, and even better from trade-level transaction reporting.
We can monitor compression volumes in a couple of ways – both from SDRView data and from CCPs themselves.
For simplicity, here are the reported Compression volumes from the LCH SwapClear website;
Showing;
- On a single-counted basis, SwapClear are compressing almost $50trn in the most active months.
- That is over $2trn every single day in compression! And this is only one CCP in one asset class.
- Compare this activity in compression to our first chart on the blog, which showed an ADV of $2.7trn in normal Rates trading at CCPs.
- Compression is a huge market!
Shorter Maturities?
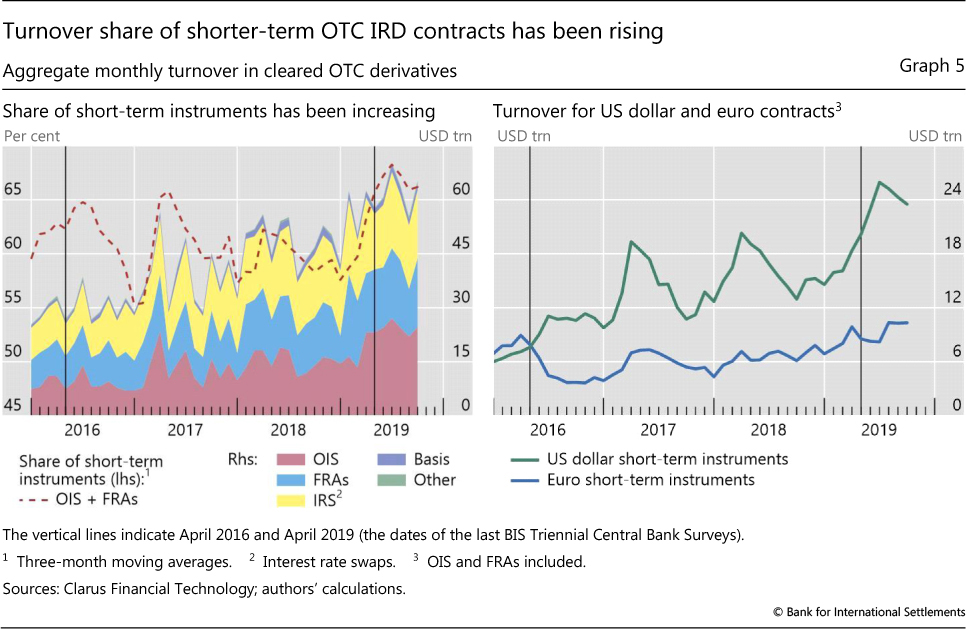
The BIS report that shorter dated instruments such as FRAs and OIS gained in popularity over the period 2016-2019:
Even during 2019 alone, we’ve probably seen something similar. Looking at maturities traded at LCH SwapClear, the end of the year saw 75% of notional traded in the 2 year tenor:
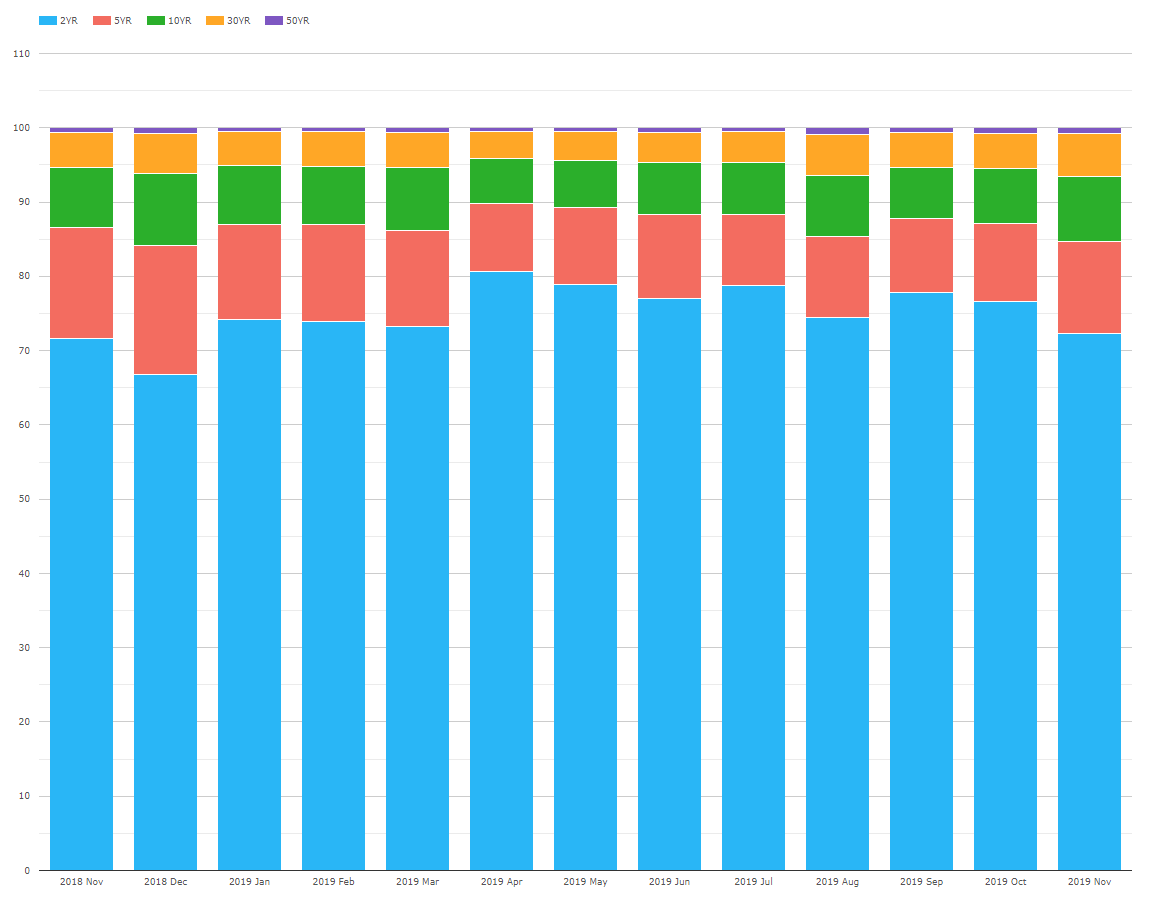
Showing;
- The split of trading activity in all IRDs per month by tenor at LCH SwapClear. It covers all currencies.
- It is difficult to say for certain that there has been a structural shift towards shorter dated products.
- However, the last quarter saw 75% of trades in the 2 year tenor. This is somewhat higher than we saw in the same quarter last year.
- For our users, I would recommend combining this time-series with our ParDV01s from our Microservices to estimate the split of risk being traded. This will be a more accurate measure than notional.
In Summary
Cleared Rates trading accounted for an ADV of $2.7trn in 2019, of which 50% was in USD. The BIS state that the four key drivers for these large volumes were:
- More Clearing.
- Electronification. 58% of vanilla fixed-float interest rate swaps were transacted on-SEF in the US during 2019.
- Compression. More Clearing is leading to more compression. This adds a further $2trn per day to the $2.7trn already trading. This improves efficiency and reduces capital for all market participants.
- Shorter Maturities. Trading activity may have shifted towards shorter-dated products.