I last looked at the market share of cleared swaps in major currencies in my July article in Risk, which covered the period up to 2Q 2018. In today’s article I will bring that analysis up to date and follow the structure of my start of the year article, 2017 CCP Market Share Statistics.
In CCPView we collect volumes and outstanding notional for all CCPs that clear swaps and I have used this for the data and charts below.
USD Swaps
Lets’s start with the largest currency and look at volumes for all USD Swaps, including IRS, OIS, Basis, Zero Coupon, Variable Notional and Inflation.
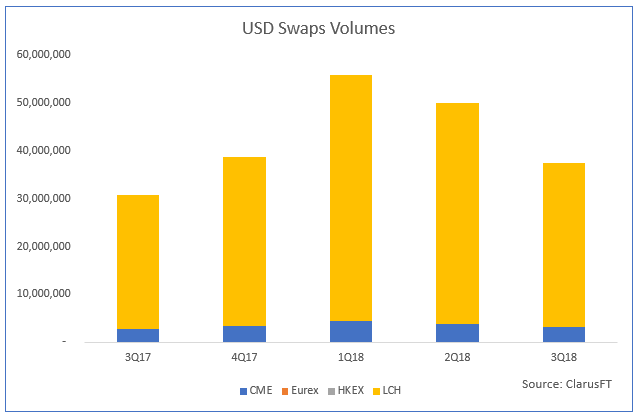
Showing single-sided quarterly gross notional in millions of USD:
- 3Q18 with $37.4 trillion notional, up 21% from 3Q17
- LCH SwapClear with $34 trillion and 91.3% market share in 3Q18
- CME OTC IRS with $3.3 trillion and 8.7% market share in 3Q18
- HKEX with $4.8 billion and Eurex with $1.1 billion in 3Q18
Market share unchanged over this period.
EUR Swaps
Next volumes for EUR Swaps; IRS, OIS, Basis, Zero Coupon, Variable Notional and Inflation.
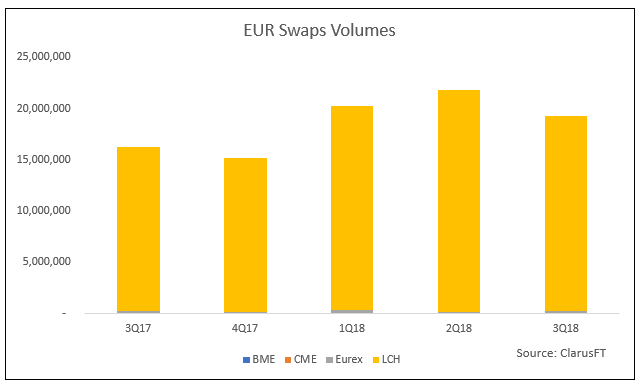
Showing single-sided quarterly gross notional in millions of EUR:
- 3Q18 with EUR 19.3 trillion notional, up 18% from 3Q17 and 60% of USD Swaps
- LCH SwapClear with EUR 19.1 trillion and 98.9% market share in 3Q18
- Only LCH is visible in our chart
- Eurex with EUR 184 billion and 1% market share in 3Q18
- CME with EUR 34 billion and 0.2% market share in 3Q18
- BME with EUR 6 million in 3Q18, far below its EUR 230 million in 3Q17
No material gain at Eurex, which had 0.93% market share in 3Q17 and has 0.96% in 3Q18.
Perhaps a little surprising as over the summer months the LCH/EUX CCP Basis has narrowed significantly to the point that since August end, it has been flat out to 10Y; implying a balance between supply and demand of payers and receivers at Eurex.
Eurex have reported significant gains in IRD volumes this year, which we can get an insight into if we include FRAs and switch from volumes to outstanding notional.
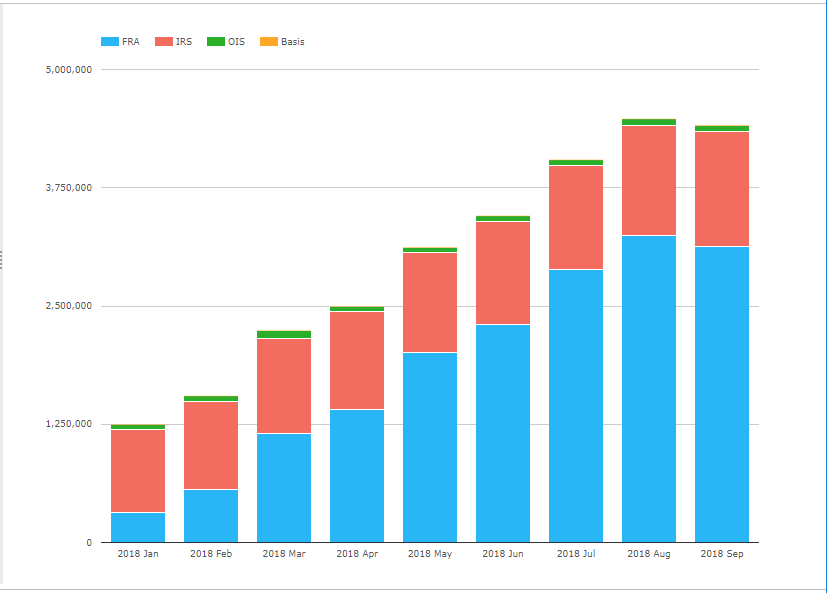
Showing:
- The steep increase in IRD open interest at Eurex since Jan 2018
- Driven by increasing amounts of FRA volumes
- Generally I ignore FRA volumes as these are not price-forming trades, but the result of the automated NEX Reset or TP-Match services
- But no doubt they generate significant clearing fees
It is interesting to note that Sep 2018 is the first month that FRA outstanding notional has dropped, probably due to earlier FRAs maturing. This means that further growth in IRD volume and outstanding notional will have to come from IRS or OIS and not FRAs.
It will be interesting to see what October and November data shows for Eurex volumes.
You can wait for my next blog on this topic or subscribe to CCPView to check yourself.
JPY Swaps
Volumes for all JPY Swaps, including IRS, OIS, Basis, Zero Coupon, Variable Notional.
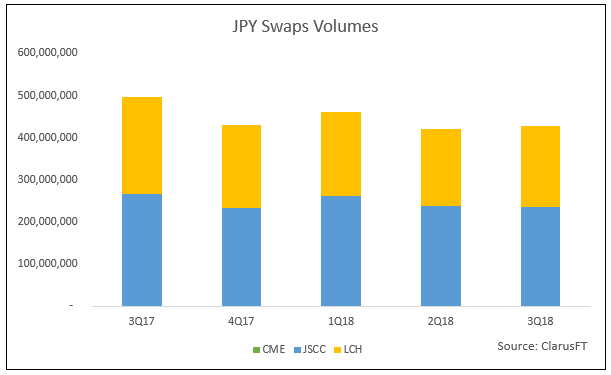
Showing single-sided quarterly gross notional in millions of JPY:
- 3Q18 with JPY 427 trillion notional, down 14% from 3Q17 and 10% of USD Swaps.
- JSCC with JPY 235 trillion and 55% market share in 3Q18
- LCH with JPY 191 trillion and 45% market share in 3Q18
- CME with JPY 800 billion in 3Q18
3Q18 volumes are down from a year earlier, market share remains unchanged, JSCC with 54%-56%.
AUD Swaps
Volumes for all AUD Swaps, including IRS, OIS, Basis, Zero Coupon, Variable Notional.
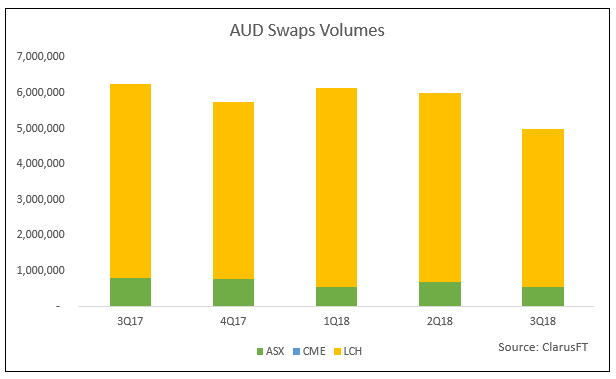
Showing single-sided quarterly gross notional in millions of AUD:
- 3Q18 with AUD 5 trillion notional, down 20% from 3Q17 and 10% of USD Swaps.
- LCH with AUD 4.45 trillion and 89% market share in 3Q18
- ASX with AUD 540 billion and 11% market share in 3Q18
- CME with AUD 6 billion in 3Q18
Again 3Q18 volumes are significantly down from a year earlier and market share remaining consistent over the period, with LCH in the 86% to 91% range.
CAD and GBP Swaps
In CAD and GBP Swaps LCH SwapClear has greater than 99% market share, so will dispense with the charts, except for noting that CAD volumes in 3Q18 were CAD 6.7 trillion, up 48% from a year earlier, while GBP volumes were £8.7 trillion, up 28% from a year earlier and 30% of USD Swaps.
LatAm Swaps
Next BRL, MXN, CLP, COP Swaps.
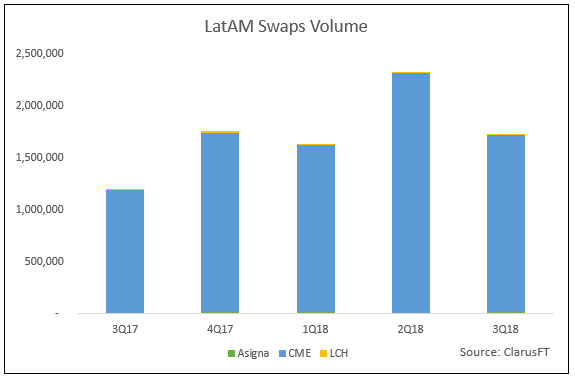
Showing single-sided quarterly gross notional in millions of USD:
- 3Q18 with $1.73 trillion notional, up 45% from 3Q17
- CME with $1.7 trillion and 98% market share in 3Q18
- Asigna with $17.5 billion in 3Q18, all in MXN Swaps
- LCH with $16.2 biillion, again all in MXN Swaps
3Q18 volumes are significantly higher than a year earlier and market share consistent with CME at 98%.
For more details on the new LatAm currencies launched by CME, see Non-Deliverable Swaps Clearing Volumes.
AsiaPac Swaps
Next CNY, HKD, INR, KRW, MYR, NZD, SGD Swaps.
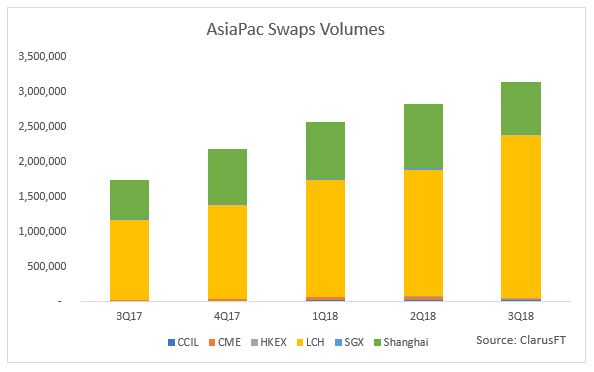
Showing single-sided quarterly gross notional in millions of USD:
- 3Q18 with $3.1 trillion notional, up 80% from 3Q17
- The growth due to LCH launching new NDS ccys and increasing existing ccys
- LCH with $2.3 trillion and 74% market share in 3Q18
- For LCH NZD, HKD, SGD are the largest and similar, followed by KRW, INR, CNY
- Shanghai with $740 billion, all in CNY and 24% of 3Q18 overall volume
- (hopefully our units are correct here, not easy to decipher Chinese characters)
- CME with $23 billion in 3Q18, with KRW and INR the largest
- CCIL with $20 billion in 3Q18, all in INR
- SGX with $18 billion in 3Q18, mostly SGD, with some THB & MYR
- HKeX with $6.4 billion in 3Q18, in HKD and CNY
- Note this excludes the $9 billion of Cross Currency Swaps in CNY/USD that were cleared at HKEx in 3Q18
An increasing quarterly trend, driven largely by LCH SwapClear volumes and new currencies. For more details on the new Asian currencies launched by LCH and CME, see Non-Deliverable Swaps Clearing Volumes.
EMEA Swaps
And finally CHF, CZK, DKK, HUF, NOK, PLN, SEK, ZAR Swaps.
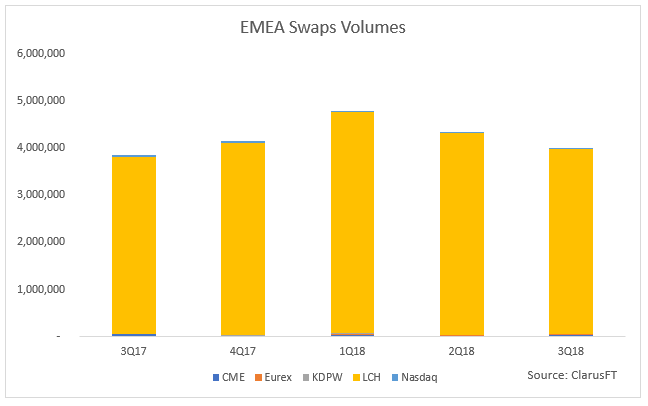
Showing single-sided quarterly gross notional in millions of USD:
- LCH SwapClear dominating with large volume in each ccy, with SEK, CHF and ZAR the largest
- 3Q18 with $4 trillion notional or 18% of EUR Swaps
- LCH SwapClear with $3.9 trillion or 98% market share in 3Q18
- CME with $42.5 billion in 3Q18, with some volume in every currency
- Nasdaq with $17 billion in 3Q18, all in SEK
- KDPW with $8 billion in 3Q18, all in PLN
- Eurex with $3.3 billion in 3Q18, all in CHF
That is it for the charts today.
Swap Maturities
Now we know that different Swap types and currencies have differences in the maturities that are commonly traded, so for USD IRS the largest tenor is 10-years, while for OIS it is less than 1-year.
I don’t have time in this blog to go into the tenor data.
For those interested, please consider subscribing to CCPView.
Alternatively for insights into EUR Swaps, see my article, EUR Swaps by Tenor.
Final Thoughts
LCH SwapClear dominates the majority of currencies with 90% plus share in each.
The only exceptions are JSCC in JPY and CME in LatAm.
There is a lot of press currently about Brexit and EUR Clearing.
Just today ISDA put out a paper on the cliff edge effects in a no deal brexit scenario.
Today the FT has “BoE warns EU that £41tn of derivatives at risk after Brexit” (subs required).
Earlier this week Risk had, EU clients facing axe from UK CCPs (subs required).
And from the charts above, it is clear that more than just EUR Swaps are a concern.
European members and clients at LCH SwapClear are trading many European and Asian currencies.
Most of which are not offered by a European CCP.
The potential disruption to the Swaps market is alarmingly high.
Time for regulators to reach a resolution.