- CFTC data shows a sharp increase in NDF clearing since July this year.
- September 2019 was a record month for the notional of NDFs cleared.
- BIS data shows that NDF markets doubled in size between April 2016 and April 2019.
- Is Phase 4 of the Uncleared Margin Rules accelerating the uptake of NDF clearing?
SDRView
A quick glance at NDF markets via our SDRView app shows the following in 2019:
Showing;
- Average weekly volumes of $455bn in notional. This is across 32 currency pairs, all versus USD.
- A peak weekly activity of $590bn.
- This is for activity of US Persons only.
The most recent BIS Triennial Survey from April 2019 shows that the daily volume of NDFs transacted was $258bn vs USD:
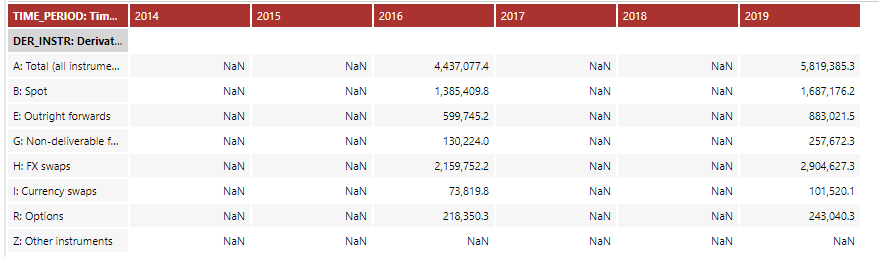
Let’s call this a weekly volume of $1.29trn. Using SDRView April data therefore suggests that US Persons data captures about 32% of the overall global market. This seems pretty much in line with calibration work we have done previously.
CCPView
And yet. When we look at the clearing rate for NDFs from SDRView data, it is extremely low. The chart shows that only 3% of the market is cleared.
This is evidently wrong when we look at cleared volumes in CCPView for the same 32 currency pairs vs USD:
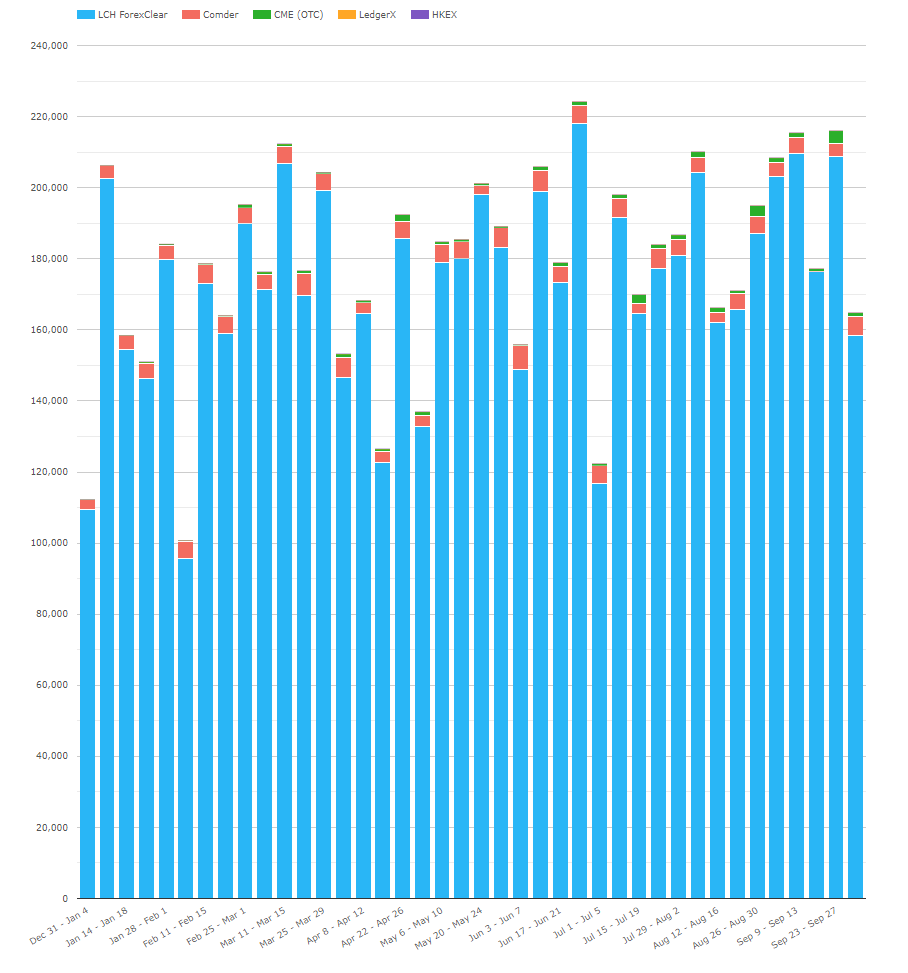
Showing;
- Average Weekly volumes of $176bn on a single-counted basis.
- Comparing to the latest BIS data, this suggests a clearing rate for the global market of around 12%.
What the chart above doesn’t show precisely is that September 2019 was an all time record month for NDF clearing:
Is this evidence of another UMR-driven spike in Cleared volumes as Phase 4 counterparties are captured by the rules? Let’s keep an eye on the data to see.
CFTC Data
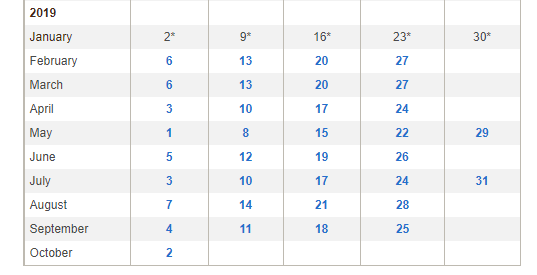
In our round-up of NDF data, we also note that the CFTC releases a weekly swaps report. You can find the archive below:
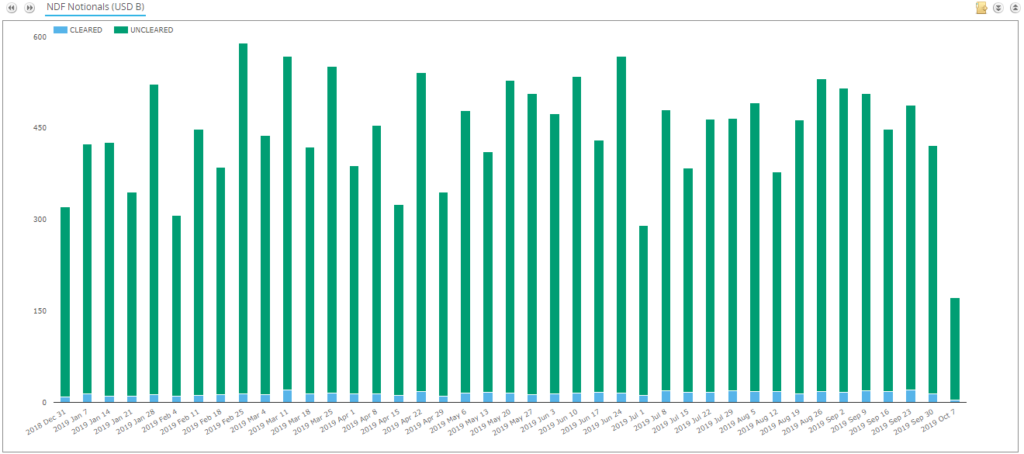
In 2019, the CFTC have been splitting the NDF data into Cleared and Uncleared. Interestingly, whilst the source of this data is also from SDRs, it deviates significantly from our SDR records. Therefore, please note:
- The explanatory notes suggest that cleared volumes are single-counted.
- Cross-checking the CFTC’s Cleared volumes to our global cleared volumes in CCPView, suggests that the CFTC Cleared volumes cover virtually 100% of CCP NDF volumes.
- However, the total volumes reported by the CFTC are somewhat higher than we see in SDRView. Strange.
- We will confirm the treatment directly with the CFTC. For clarity, we believe in single counted volumes.
- SDRView does not show these trades as “Cleared” because NDF clearing is typically a post-trade activity.
What the data does show is an important trend.
There is a significant and increasing Clearing Rate for NDFs:
NDF Clearing Rate from CFTC Data
Showing;
- A marked increase in cleared NDFs from the middle of July 2019.
- The most recent data shows the highest clearing rates, reaching 29% (assuming single-count methodology).
- Cleared volumes as reported in this CFTC data have increased significantly since July (+80% on a four week rolling average).
In Summary
- There is some evidence of a Phase 4 UMR uplift in Cleared NDF volumes.
- September 2019 was a record month for Cleared NDF volumes.
- Data shows Clearing Rates as high as 29%.
- NDF markets are thriving. Average daily volumes as reported by the BIS have nearly doubled in the past three years.