Today I will look at Swaps volumes in the most recent 3 months using the format of my Nov 2017 Swaps Review article.
- USD IRS price-forming volumes are up 10%
- USD IRS On SEF Compression volumes are up 50%
- USD OIS volumes are up 35%
- EUR, GBP, JPY IRS On SEF Compression volumes at record highs
- D2C SEF volume growing 42% from a year earlier
- Tradeweb retains the top spot from Bloomberg
- TrueEx with good consistent volume each month
- D2D SEF volume is flat
- IGDL, TP and Tradition all neck and neck
- CME–LCH Switch volumes steady
- Global Cleared volumes up 24% from a year earlier
- LCH SwapClear responsible for the 24% increase
- In Asia, volumes of AUD OIS are down
- In LatAm, CME volumes are up 17%
- Cross Currency Swaps at HKEX
Onto the charts, data and details.
USD IRS ON/OFF SEF
Using SDRView the gross-notional volume of On and Off SEF USD IRS Fixed vs Float price forming trades (Outrights, SpreadOvers, Curve/Flys).
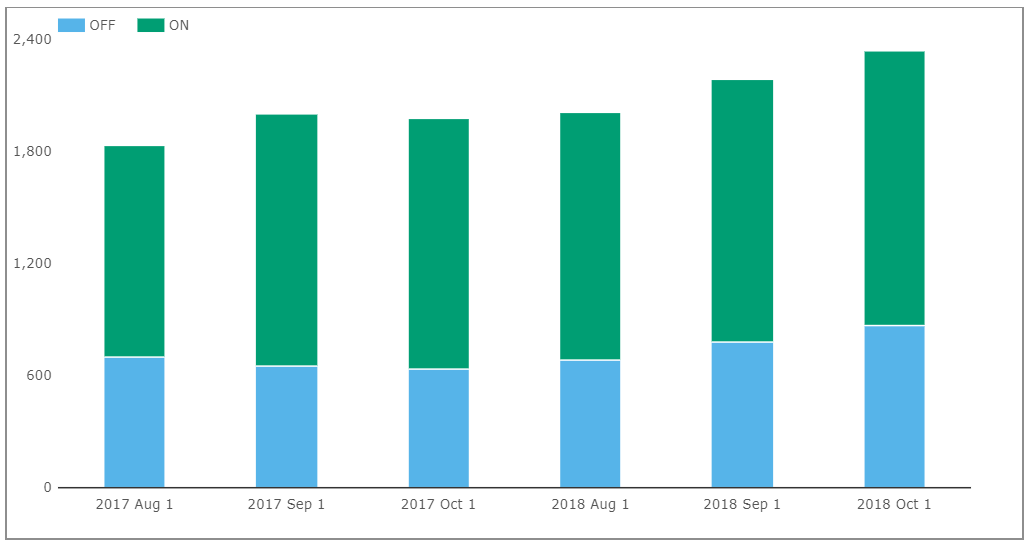
- On SEF volume in Oct 2018 is > $1.5 trillion and > $4.2 trillion in the recent three month period, which is up 10% from the corresponding period in 2017
- (capped trade rules understate this as the full size of block trades is not disclosed)
- Off SEF volume in Oct 2018 is > $870 billion and > $2.3 trillion in the recent three month period, which is up 17% from 2017
- And On SEF vs Off SEF is 64% to 36%, similar to a year earlier
Next On SEF non-price forming trades; SEF Compression and Rolls.
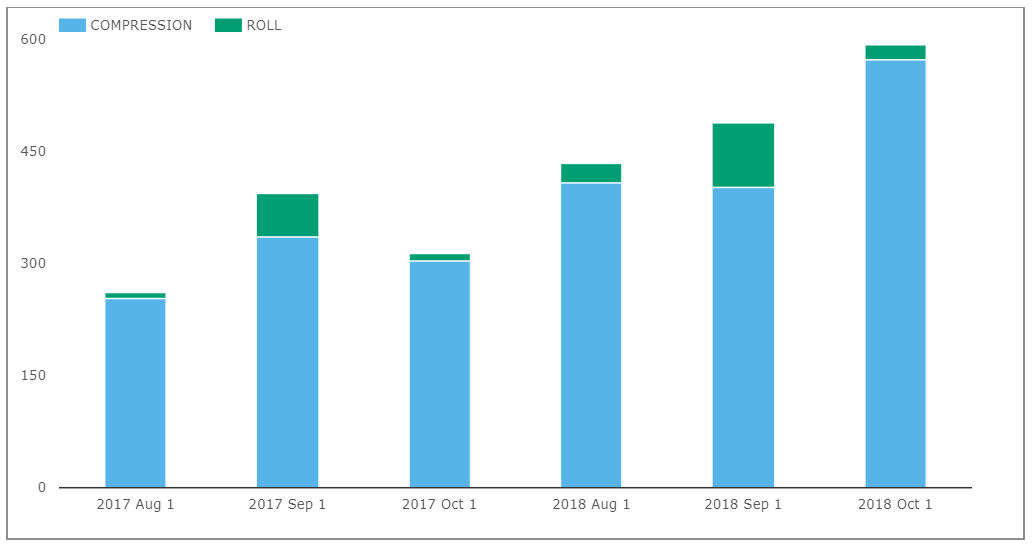
- SEF Compression in Oct 2018 was > $570 billion, close to the all time high in Feb 2018 of > $595 billion
- SEF Compression in the recent three month period is 55% or $490 billion higher than a year earlier
- Roll volume of > $87 billion in Oct 2018, is 47% higher than Oct 2017
The recent three month period in 2018, showing excellent growth in SEF Compression and Roll activity over the corresponding months in 2017, while price forming trading volume is 10% higher with Oct 2018 a strong month.
USD Swaps Daily Briefing
Our Daily Briefing of 30-Oct-2018 for USD shows:
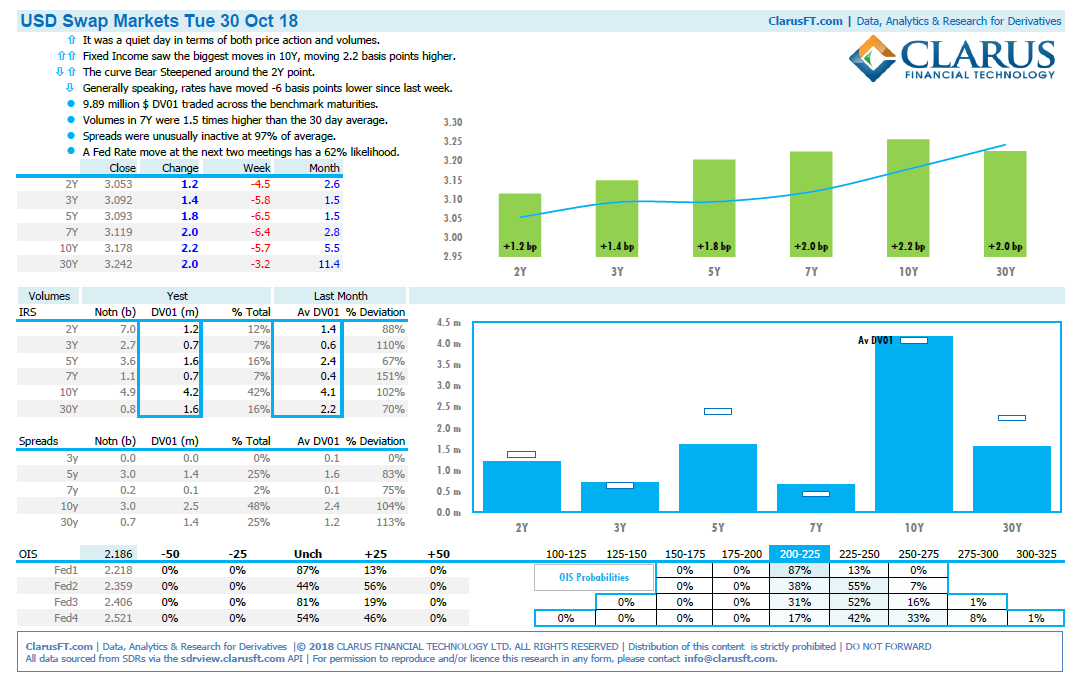
- Swap rates up in the month, all tenors wit rates > 3%
- 10y Swap rates 3.24%, up 11 bps in the month
- Volume vs the Monthly Average for major tenors in DV01 terms
- SpreadOver Volumes
- Fed Rate Rise probabilities, signalling a further +25 bps in Dec 2018
All in an easy to understand format; read and digest a days activity in a few minutes.
You can sign up for a free subscription here.
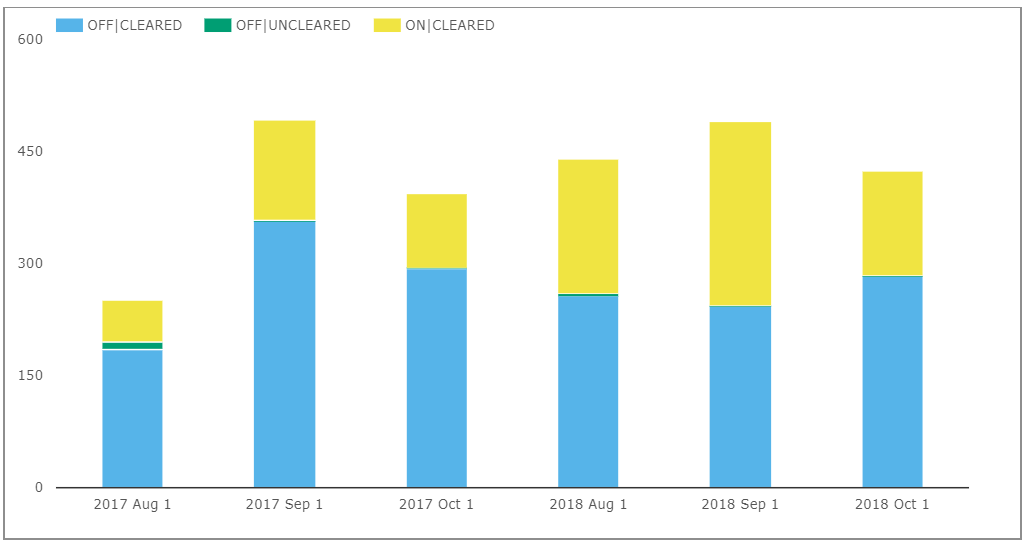
USD OIS Swaps
Next USD OIS Swaps volumes for outright trades.
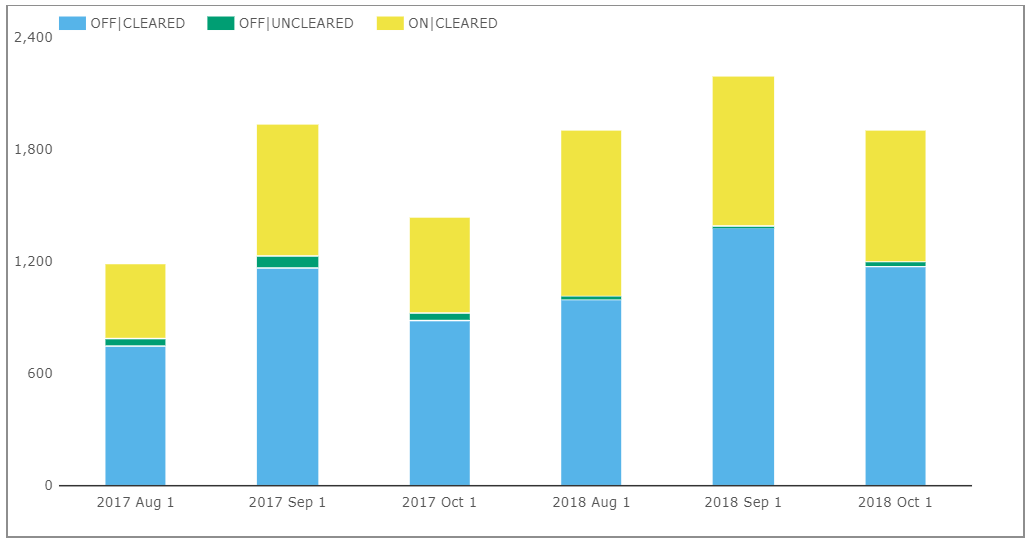
- Off SEF Cleared gross notional is the greatest each month, followed by On SEF Cleared
- Uncleared decreasing a lot, down to >$25 billion in Oct 2018 from > $44 billion a year earlier (capped trade rules understate this as the full size of block trades is not disclosed)
- Oct 2018 On SEF Cleared is > $705 billion, 38% higher than Oct 2017
- Oct 2018 Off SEF Cleared is > $1.17 trillion, 33% higher than Oct 2017
- An overall gross notional of > $1.9 trillion
Next Roll trade volumes for the same period.
- Off SEF Cleared in Oct 2018 is > $280 billion
- On SEF Cleared in Oct 2018 is > $140 billion
- Overall gross notional of > $420 billion
The overall USD OIS gross notional of outright and roll volume in Oct 2018 is > $2.3 trillion.
EUR, GBP, JPY Swaps
Next On and Off SEF volumes of IRS of price forming trades in the other three major currencies.
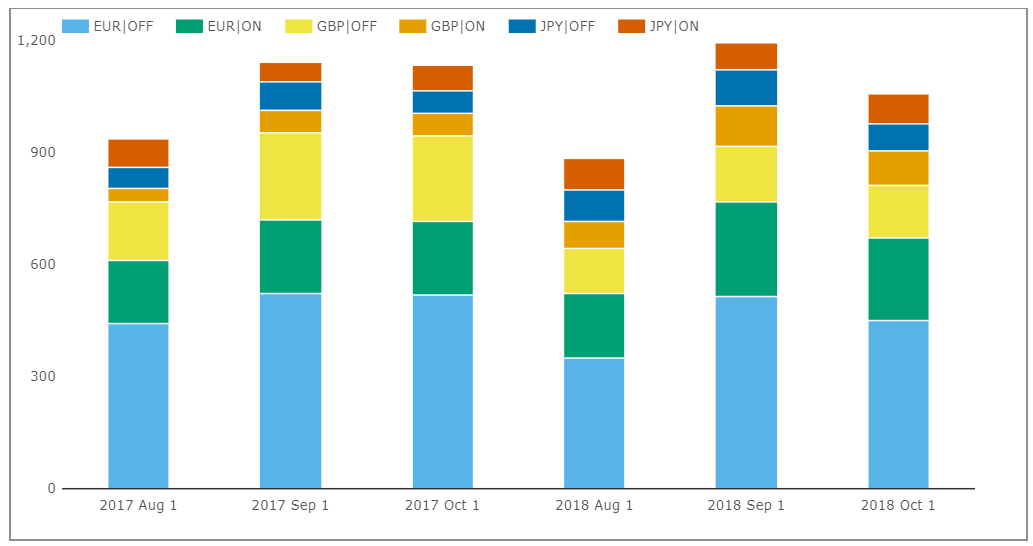
- Volume in Oct 2018 is > $1 trillion
- 6% lower than Oct 2017
- While Volume in Sep 2018 at > $1 trillion is 5% than a year earlier
- EUR Off SEF is the largest each month with > $450 billion in Oct 2018
- GBP Off SEF is the next with >$140 billion in Oct 2018
- EUR On SEF next with > $220 billion
- Overall On SEF at > $400 billion is 26% of the USD IRS On SEF of $1.5 trillion
A much higher portion of EUR, GBP, JPY IRS is transacted Off SEF than USD IRS.
Next On SEF Compression activity.
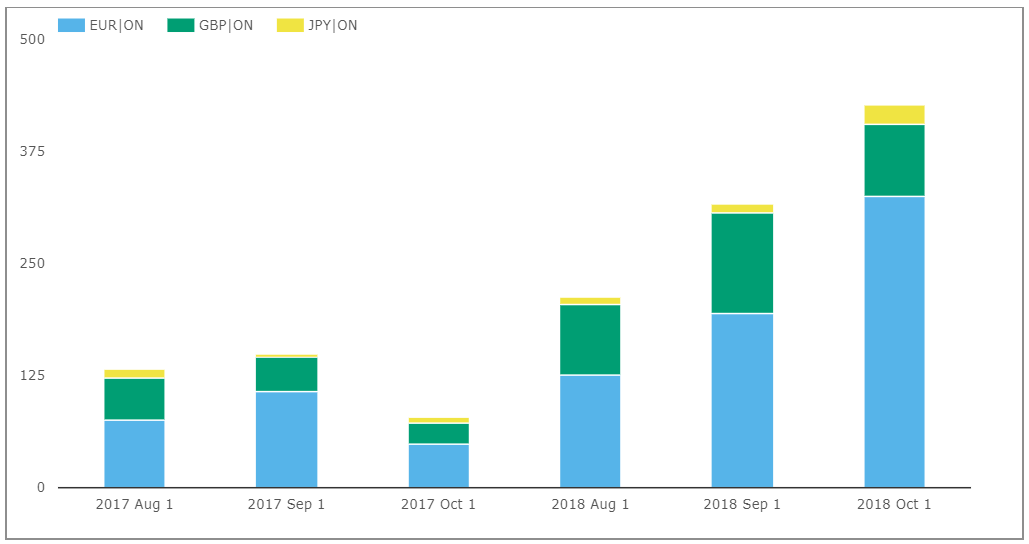
- Volumes much higher than the 2017 months
- EUR volume in Oct 2018 is > $320 billion
- GBP volume in Oct 2018 is > $80 billion
- Overall volume in the month is > $425 billion
- An all time record month, the previous being Jun 2018 with $350 billion
- Oct 2018 volume is 75% of the USD IRS Compression volume of $570 billion
- Again a record percentage comparison
Similar to USD, the three major currencies, showing excellent growth in SEF Compression l activity over the corresponding months in 2017, while price forming trading volume is slightly lower.
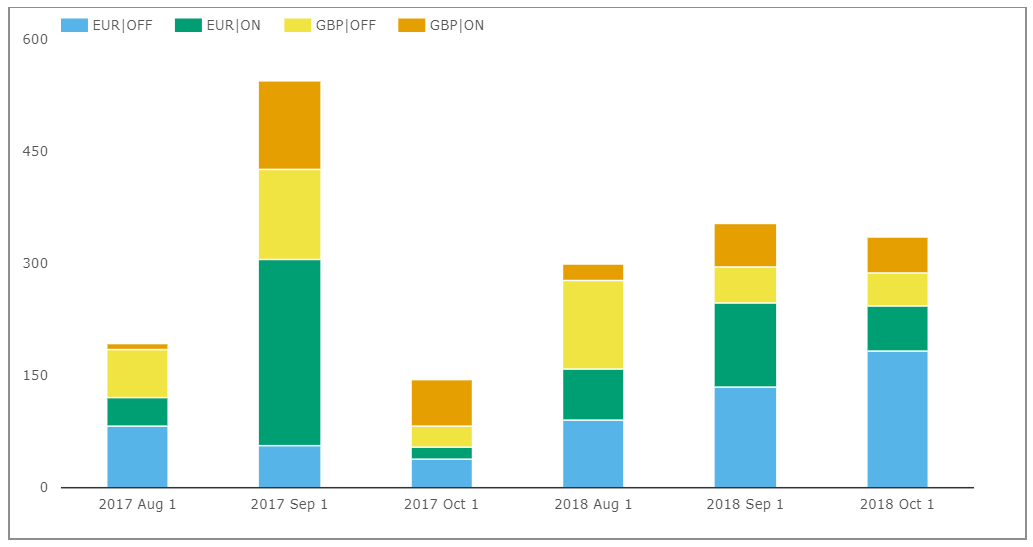
EONIA, SONIA, TONAR
Next lets check how volumes in EONIA, SONIA and TONAR have performed.
First for outright trades.

- Overall Volume in Oct 2018 was > $820 billion, slightly up from Oct 2017
- EUR Off SEF is the largest most months and significantly higher than a year earlier
- GBP Off SEF is next but down from a year earlier
- On SEF volumes are tiny compared to Off SEF
Second Roll trade volumes for the same period.
- Aug, Sep and Oct 2018 with similar amounts of > $300 billion
- EUR OffSEF is the largest at > $180 billion in Oct 2018
- GBP On SEF and Off SEF with similar amounts of $45 billion
In Oct 2018, total OIS volume in EUR, GBP, JPY of > $1.15 trillion, is lower than the > $1.4 trillion in IRS.
SEF Market Share
Turning next to SEFView and SEF Market Share in IRS including Vanilla, Basis and OIS Swaps.
DV01 (in USD millions) by month for USD, EUR, GBP,, JPY and by each SEF, including SEF Compression trades for the three months up to Oct 2018.
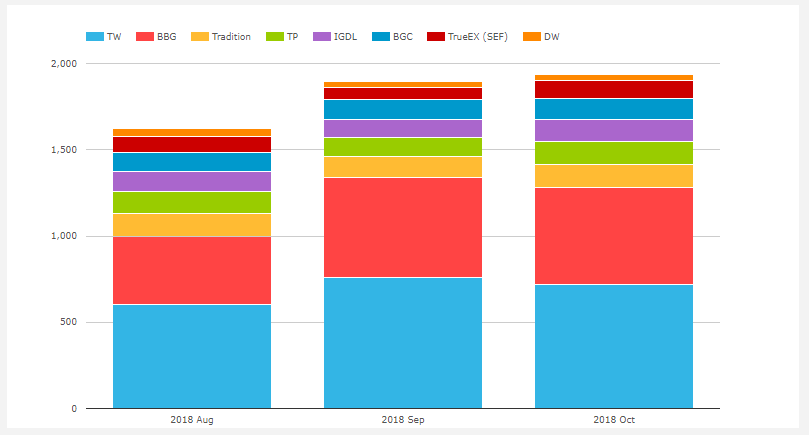
- Oct 2018 volume at $1.94 billion DV01 , is up 26% from Oct 2017
- (with 2 days still to go in Oct 2018) and similar to Sep 2018 volume
- Tradeweb is the largest SEF in each month with $717 million DV01 in Oct 2018
- Bloomberg is next with $564 million in the month
- TrueEx with $103 million
- The D2C total is $1.38 billion, while D2D is $550 million
- Which are up 42% and down 1% respectively from Oct 17
- IGDL, TP and Tradition all neck to neck with $130 million DV01 each in Oct 2018
- BGC with $122 million and DW with $34 million
The D2C SEFs continuing to increase volume significantly, in-contrast to the D2D ones.
CCP Basis Spreads and Volumes
In SEFView CME Cleared Swap volume at the D2D SEFs is CME–LCH Switch trade activity.
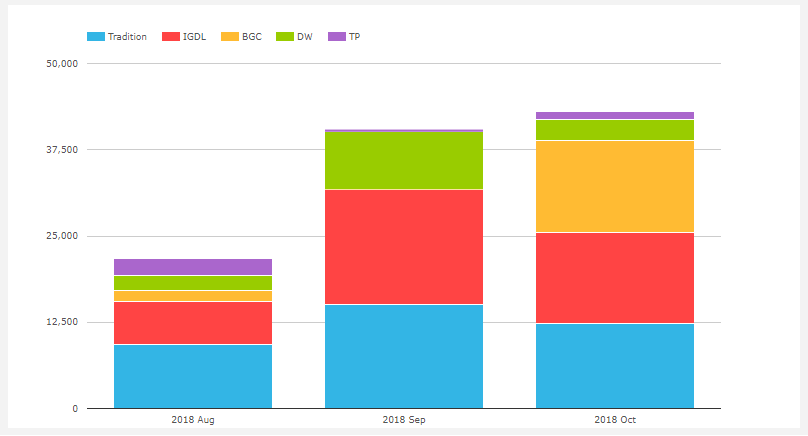
- Cumulative volume in these 3 months was $105 billion gross notional
- This is up 17% from the $90 billion in the corresponding period in 2017
- The largest SEFs over this period are Tradition and IGDL, same as in 2017
- BGC and DW both showing significant gains of $6 billion each compared to 2017
- TP is the only SEF with lower volume compared to the same months in 2017
- BGC’s large showing in Oct 2018, stemming from $9billion in 1Y on 19-Oct-2018 and $2 billion in 3Y on 2-Oct-2018
The CME-LCH Switch continuing to actively trade with the 10Y basis at 2.90 bps, similar to the level a year earlier.
Global Cleared Volumes
Next CCPView and Global Cleared Swap Volumes of EUR, GBP, JPY & USD Swaps (IRS, OIS, Basis, ZC, VNS).
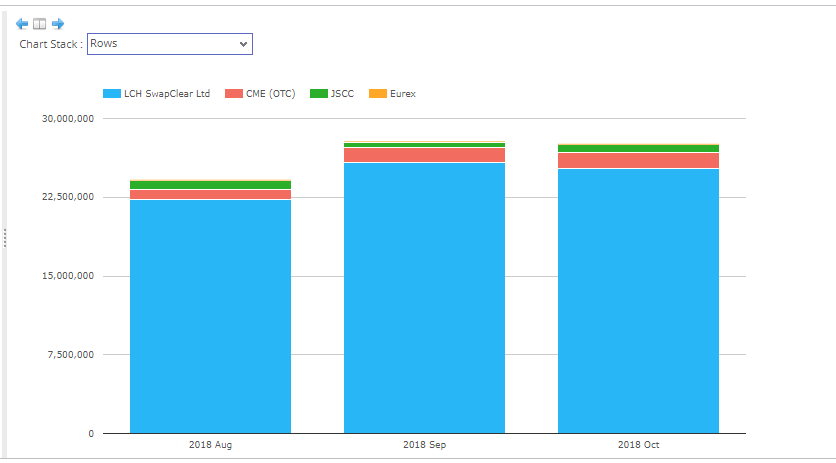
- Overall Global Cleared Volumes in Oct 2018 of > $27.6 trillion (with 3-days to go in the month) and similar to the volumes in Sep 2018
- Overall volumes in these 3 months are 24% higher than the same period in 2017
- LCH SwapClear with > $73 trillion in these 3 months, is up 24% or $14.4 trillion from the same period in 2017
- CME with > $3.9 trillion in this period, is up 28% or $850 billion
- JSCC with $2.2 trillion is down 7% or $150 billion (in USD terms)
- Eurex with $270 billion is up 59% or $100 billion (in USD terms)
Global Swap markets continuing to see strong growth in volumes.
Asia and LatAm
Next the volume of AUD, HKD, SGD Swaps (including Vanilla, OIS, Basis, Zero Coupon).
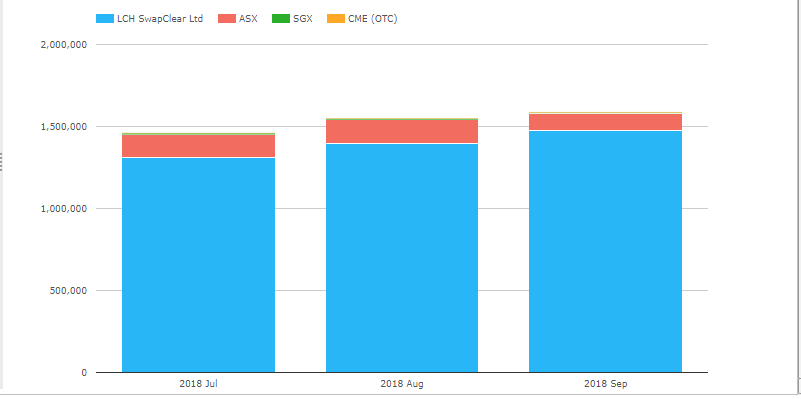
- As ASX and SGX only publish their volume monthly, we do not yet have Oct 2018, so we will take the three months July, August, September
- LCH SwapClear with $4.2 trillion in these 3 months, down 16% from a year earlier
- ASX with $394 billion in these months, down 36%
- Both drops driven by much lowed AUD OIS volumes compared to 2017
- SGX with $18 billion down 12%
- CME with $10.6 billion, down $44 billion
And next the volume of MXN and BRL Swaps.
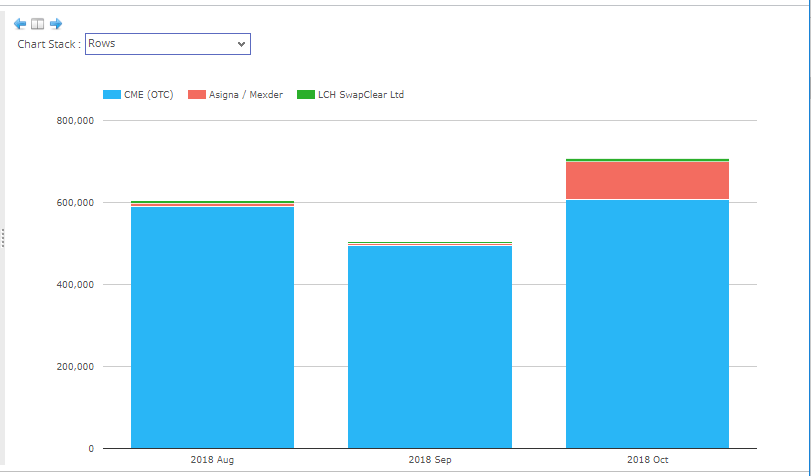
- CME with $1.7 trillion in these 3 months, up 17% of $245 billion from a year earlier
- Asigna/Mexder with $105 billion, with a much higher month in Oct than before, driven by large volume on 23-Oct and 26-Oct (with 3 days still to go in the month) and up from $15 billion in the corresponding 3 months in 2017
- LCH SwapClear with $19 billion, up from $13 billion a year earlier
Cross Currency Swaps
Finally lets look Cross Currency Swaps, which only HKEX offer as a cleared product.
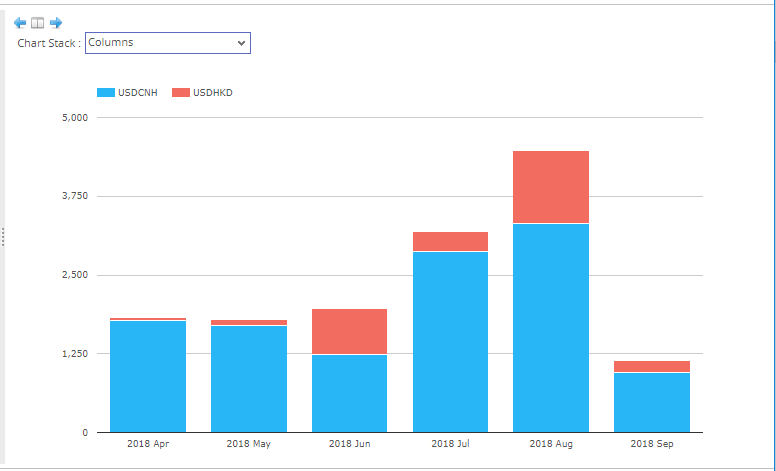
Volumes showing a new monthly high of $4.5 billion in Aug 2018, with CNY (offshore) the largest currency each month and HKD starting to clear each month.
It will be interesting to see how volumes in cleared Cross Currency Swaps develop given the large FX settlement risk in these products has been an obstacle to clearing.
That’s it for today.
Thanks for staying to the end.
Our Data products have all the charts and data that I have used today.
Please contact us for a trial if you are interested in these.