
This blog reviews Q2 2026 US-reported volumes and D2D platform market shares of major currency cross-currency swaps risk-trading, continuing the quarterly series from Q1 2026 cross-currency swap volumes and market shares.
Key takeaways
In Q2 2026 major currency cross-currency basis swaps:
- Year-on-year (YoY) notional volumes were down 4.3%, trade counts were down by 17%, but average trade sizes increased by 15%.
- EUR took the lead in notional volume from JPY, while JPY led in trade count and CAD led in average trade size.
- GBP bucked the overall YoY decline with 48% growth in notional volume, mostly through increased average trade size.
- Notional volumes shifted YoY by 0.9% of the total from off-platform to D2D platforms.
- Tullett Prebon (Tulletts) led in D2D platform share of DV01 traded with 51.7% – down 4.8 points YoY, as ICAP and BGC gained share from Tulletts and Tradition (Trads).
Read on for deeper supporting analysis and some charts and data created in SDRView.
Blog scope
From all US-reported cross-currency swaps, this blog focuses on major currency risk-trading of basis swaps which was 86.1% of the Q1 2026 total. We do this by excluding from the Q1 2026 total the 5.7% from fixed-fixed and fixed-float swaps, the 8.1% from non-major currency basis swaps and the 0.1% from major currency basis swap compressions (which are not risk-trading).
We use SDRView to aggregate trade notional, DV01, and count and compute average trade size from US-reported trades, which are a large representative subset of global market volumes.
Volumes by major currency
Note: throughout the blog, for example, “AUD cross-currency swaps” is shorthand for “USD versus AUD cross-currency swap”.
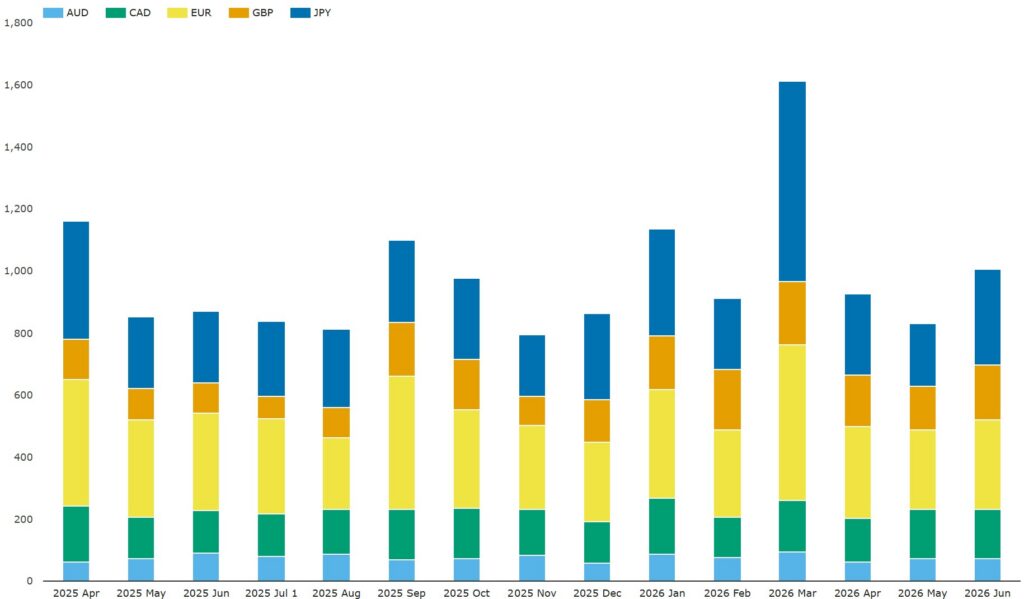
Chart 1: Volumes of US-reported major currency cross-currency basis swap risk-trading (notional USD billions). Source: SDRView
Chart 1 shows that Q2 2026 monthly notional volumes returned to 2025-like levels after the exceptional March 2026 numbers. Aggregating to quarter-level, Q2 2026 notional volumes were $2.76 trillion – down 4.3% YoY and down 25% QoQ.
- EUR took back the lead from JPY with $842 billion – down 19% YoY.
- JPY was next with $767 billion – down 8.8% YoY.
- GBP had $488 billion – bucking the overall decline by growing 48% YoY but declining 15% QoQ.
- CAD saw $461 billion – up 2.3% YoY but down 4.3% QoQ.
- AUD showed $203 billion – down 9.4% YoY.
We see steeper declines when we look at the same activity by trade count.
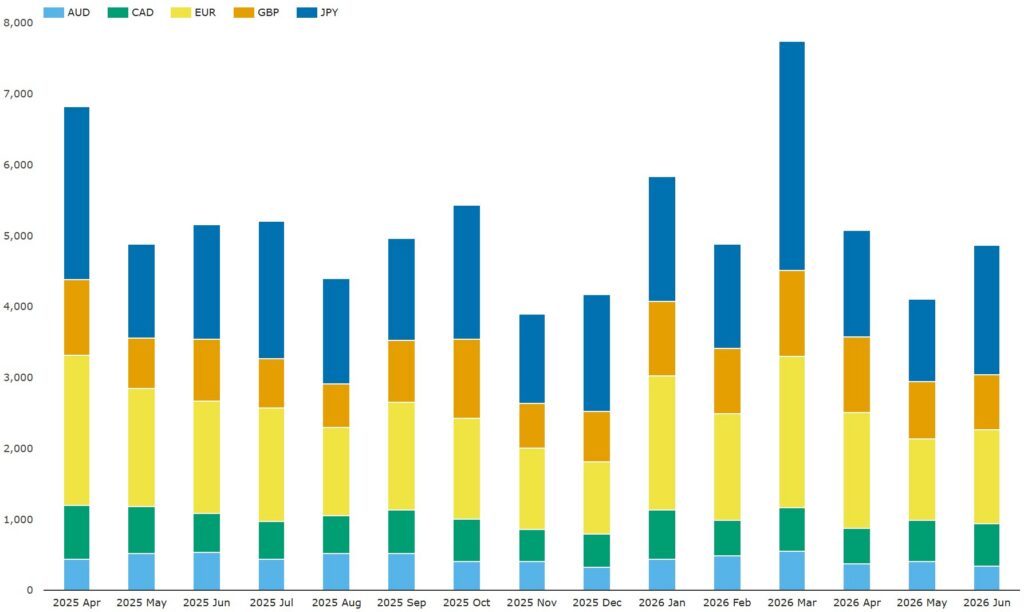
Chart 2: Volumes of US-reported major currency cross-currency basis swap risk-trading (trade count). Source: SDRView
Chart 2 shows that Q2 2026 monthly trade counts also returned to 2025-like levels after the exceptional March 2026 numbers. Aggregating to quarter-level, Q2 2026 trade counts were 14,037 – down 17% YoY and down 24% QoQ.
- JPY had the highest trade count with 4,489 – down 17% YoY.
- EUR was next with 4,096 – down 24% YoY.
- GBP saw 2,662 – up 0.8% YoY but down 16% QoQ.
- CAD showed 1,674 – down 15% YoY.
- AUD had 1,116 – down 25% YoY.
The smaller YoY decreases in notional volume than in trade count imply increases in average trade sizes.
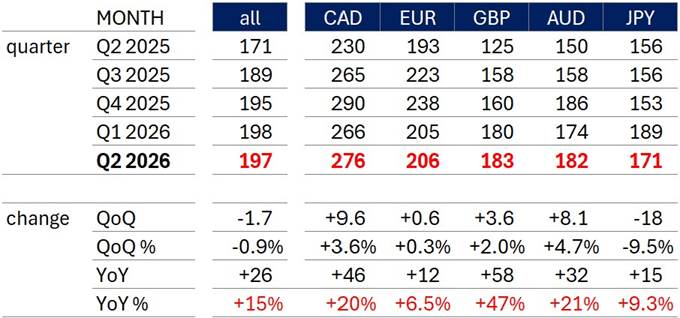
Table 1: Average trade size of US-reported major currency cross-currency basis swap risk-trading ($ millions). Source: SDRView
I computed average trade sizes by dividing SDRView notional volumes by SDRView trade counts. Table 1 shows that Q2 2026 average trade notional across the five currencies was $197 million – up 15% YoY but down 0.9% QoQ. By currency:
- Interestingly, CAD had the largest average trade size at $276 million – up 20% YoY.
- EUR was $206 million – up 6.5% YoY.
- GBP average trade size grew fastest with $183 million – up 47% YoY.
- AUD saw $182 million – up 21% YoY.
- JPY slipped behind GBP and AUD with $171 million – up 9.3% YoY but down 9.5% QoQ.
Note that both SDR-reported trade notional, as well as the trade DV01 derived from it by SDRView, may be under-estimated where the notional of a trade exceeded the SDR-reporting trade notional caps.
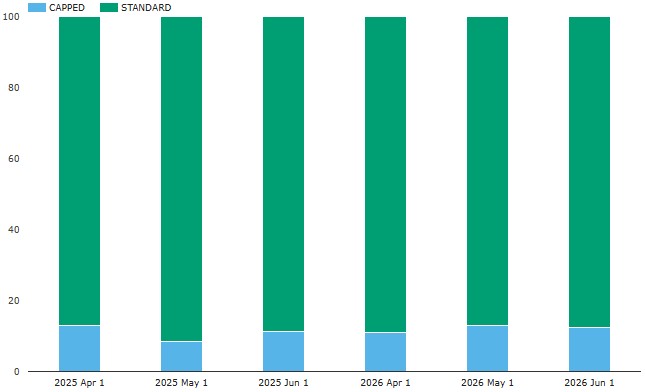
Chart 3: Split between capped and uncapped US-reported major currency cross-currency basis swap risk-trading (percentage of USD notional). Source: SDRView
Chart 3 shows that Q2 2026 month-by-month capped percentages were slightly up from Q2 2025. Calculating at quarter-level, Q2 2026 saw 12.1% of notional from capped trades – up from 11.1% in Q2 2025. At this level, cross-currency swaps are relatively much less capped in SDR-reporting than, for example, rates overnight index swaps (OIS) which are usually capped for between 25% and 30% of notional reported.
On- or off-platform
What is the short-term trend between D2D platforms and off-platform?
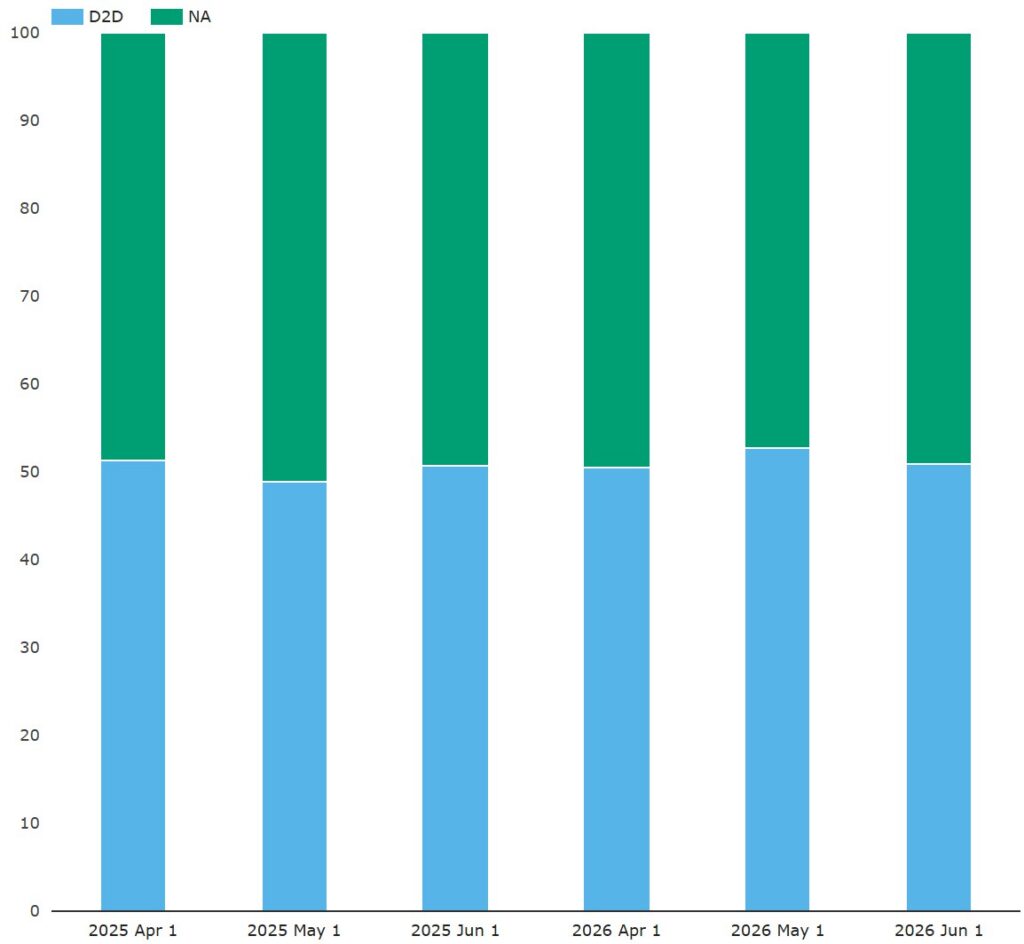
Chart 4: Split by platform type of US-reported major currency cross-currency basis swap risk-trading (percentage of notional). Source: SDRView
Chart 4 shows that platform type shares shifted slightly to D2D platforms from off-platform (NA) between Q2 2026 and Q2 2025. (For avoidance of doubt, no trades were reported for D2C platforms or single dealer platforms). Computing shares at quarter level from downloaded notional volumes shows that D2D platforms were 51.3% of the total in Q2 2026 – up 0.9 points YoY.
D2D market share
For D2D platform market shares we use traded DV01 as our metric instead of traded notional as platform revenue is often based on traded risk.
To find more reference information about each platform in the chart, google “MIC code XXXX”, where XXXX is platform ID in the chart key.
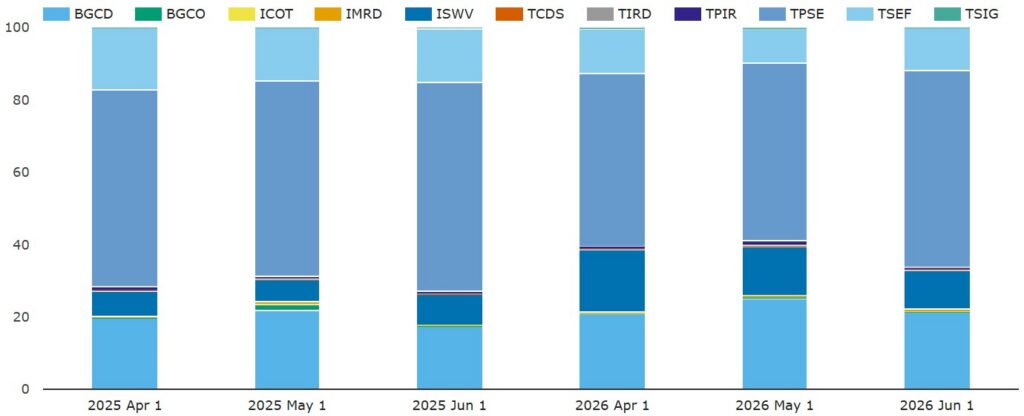
Chart 5: Platform shares of US-reported D2D platform major currency cross-currency basis swap traded risk (percentage of DV01). Source: SDRView
Chart 5 shows the shares of D2D platform major currency cross-currency basis swap traded DV01 traded in the months of Q2 2025 and Q2 2026. Re-calculating at quarter level, Q2 2026 D2D platforms’ shares were as follows:
- Tulletts (led by TPSE) had the largest share with 51.7% – down YoY from 56.6%.
- BGC (led by BGCD) had 22.6% – up YoY from 20.1%.
- Trads (led by TSEF) saw 11.3% – down YoY from 15.7%.
- ICAP (led by ISWV) took 14.5% – up YoY from 7.7%.
In summary, in 2025 ICAP gained 6.8%, BGC gained 2.5%, Tulletts lost 4.8%, and Trads lost 4.4%.
Now let’s look at platform shares by currency.
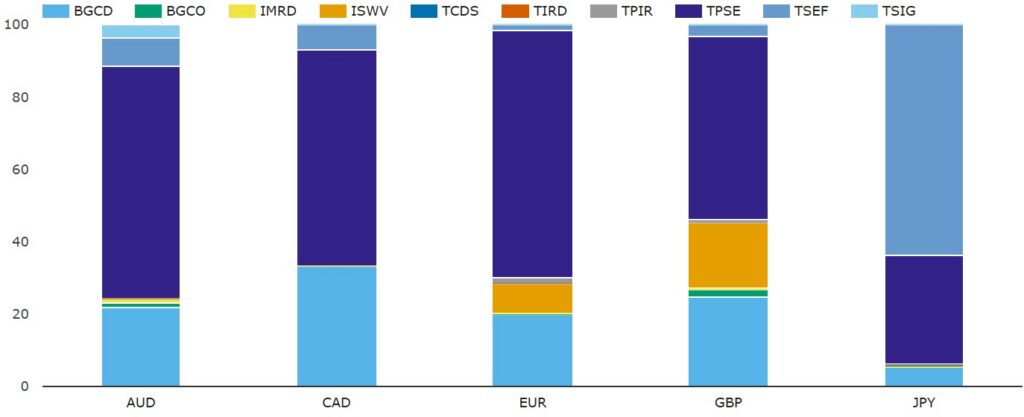
Chart 6: Q2 2025 platform shares per currency of D2D platform major currency cross-currency basis swaps traded risk (percentage of DV01). Source: SDRView
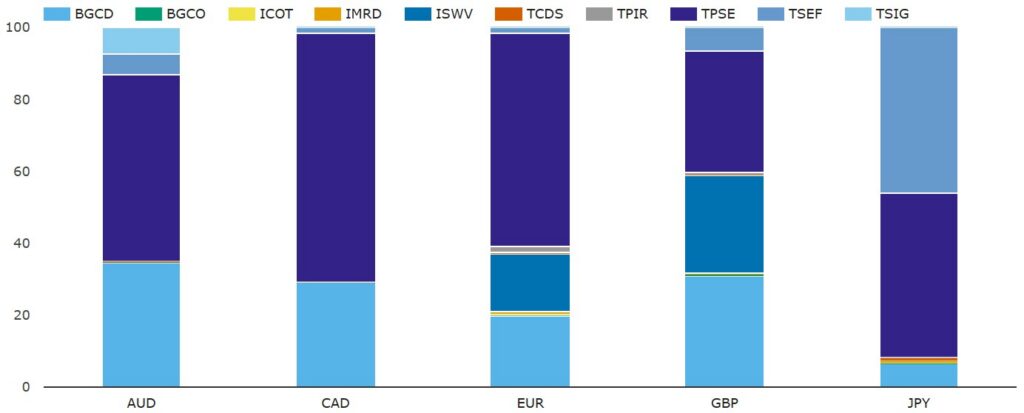
Chart 7: Q2 2026 platform shares per currency of D2D platform major currency cross-currency basis swap traded risk (percentage of DV01). Source: SDRView
Note: the color coding is slightly inconsistent between Charts 5 and 6. The main visible material difference is in the color of ICAP’s ISWV which is orange in Chart 5 and mid-blue in Chart 6.
Charts 6 and 7 illustrate that Tulletts led in all five currencies in Q2 2026. Compared with Q2 2025, Tullet’s lead in Q2 2026:
- Decreased in AUD by 8.5 points to 59.5%, while BGC’s second-place share increased by 11.5 points to 34.6%.
- Increased in CAD by 9.2 points to 68.8%, while BGC’s second-place share decreased by 4.0 points to 29.3%
- Decreased in EUR decreased by 8.6 points to 61.4%, while BGC’s second-place share decreased by 0.1 point to 20.1%.
- Decreased in GBP by 16.9 points to 34.9%, while BGC’s second-place share increased by 4.8 to 31.4%.
- Was new in JPY as they overtook Trads by increasing share by 15.9 points to 46.6%, while Trads share decreased by 17.7 points to 46.1%.
In summary, Tulletts share decline of 4.8 points noted under Chart 4 came from decreases of 8.5 points in AUD, 8.6 points in EUR and 16.9 points in GBP offset by increases of 9.2 points in CAD and 15.9 points in JPY.
End note
Skip back to the top to reread the key takeaways if you like.
We used seven charts and one table for a complete overview, but there is a lot more data in SDRView.
Please contact us for information on our data products, or for more details on any of the above analysis.