- RFR Adoption has now increased to 67% of the market.
- This blog shows how Clarus subscribers can replicate the analysis for themselves.
- Changes in published CCP data necessitate an amended methodology for the calculation.
This blog is unashamedly targeted at our data subscribers. Specifically, those of you interested to replicate our RFR Adoption Indicator. Read on for your “cut out and keep” guide to RFR data.
A Bit of History
Clarus and ISDA teamed up way back in 2020 to “help derivatives market participants keep tabs on progress to shift to RFRs ahead of the end of 2021”. ISDA published the final RFR Adoption Indicator report at the end of 2023, whilst I have periodically checked-in on progress on the blog for the past 16 months.
I am pleased to say that nearly five years on, we still have clients asking about the RFR Adoption Indicator and how to run it for themselves.
Due to changes in the data being published by CCPs (mainly the fact that LCH stopped publishing SOFR volumes – tut tut), it is no longer possible to calculate the Adoption Indicator using the identical methodology that we used from 2020-2024.
However, where there is a will, there is a way!
This Is The Way
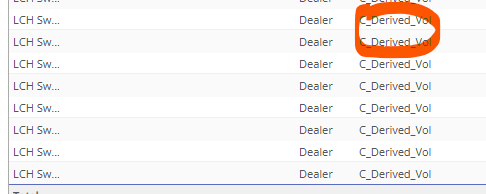
We have recently started to publish new data in CCPView. SDR data is considered largely representative of global markets, therefore we now include the tenor profile from SDR data for any CCP that does not publish their own tenor data. We believe this adds transparency to the market, with the new tenor data clearly marked as “derived” data in CCPView.
The SDR tenor profile is populated using “*” to denote the derived tenors – e.g. 2Y* rather than 2Y, and the data itself is flagged as “derived”:
DV01 of OTC IRD and STIRs
The first step is simple – we calculate the DV01 traded across all OTC and ETD Rates instruments for the eight currencies covered – AUD, CAD, CHF, EUR, GBP, JPY, SGD and USD. This is a single query in CCPView:
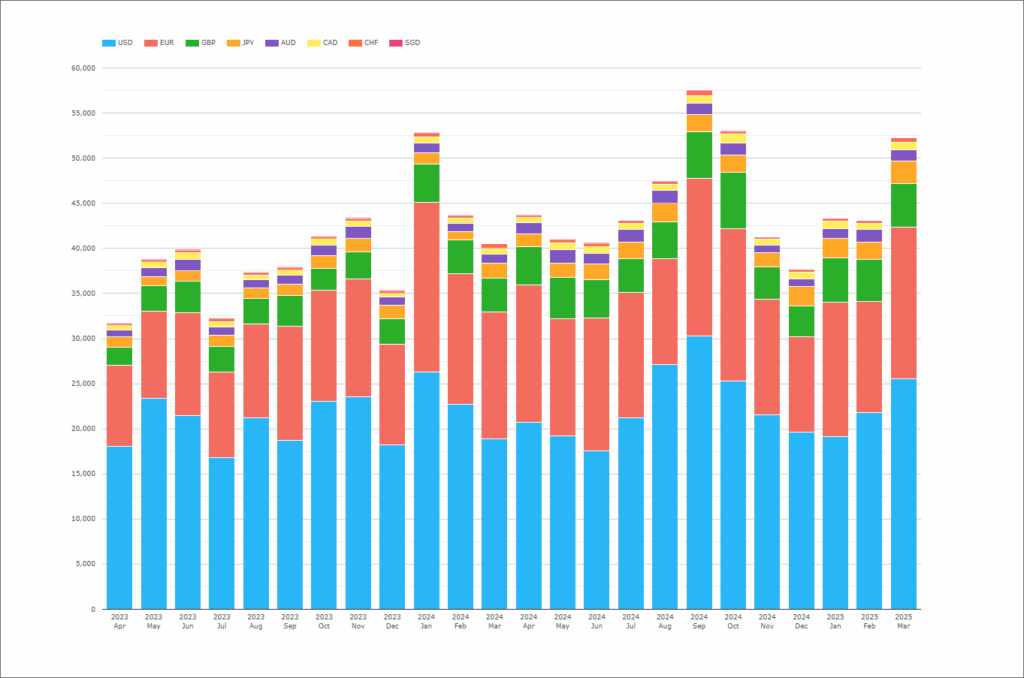
This provides the “denominator” in the equation, providing a total size of market in each of the 8 currencies.
DV01 of OTC OIS and STIRs ex USD
Next up, we work on the numerator. This is straightforward for 7 of the currencies, as it is simply the DV01 traded in OIS and STIRS referencing the RFRs:
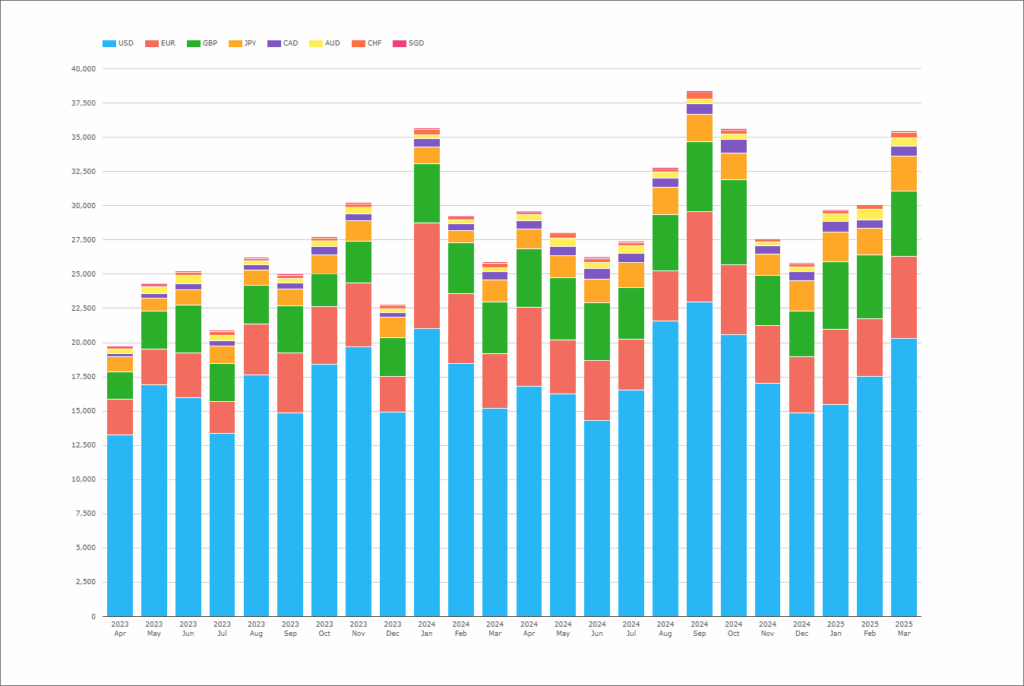
For USD, the story is a little more complex because two OIS markets exist – SOFR (the RFR) and EFFR (“Fed Funds”, not an RFR). Fortunately, we can calculate the risk versus these two indices individually.
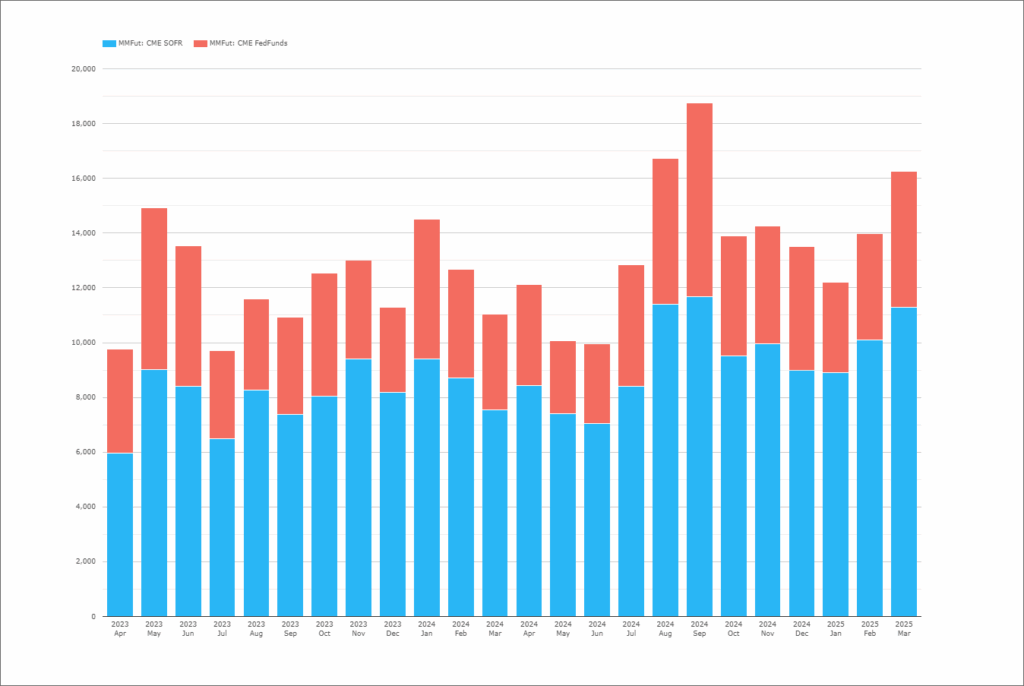
USD Futures
From CCPView, we know the exact DV01 risk traded in each of the futures contracts – therefore we can apportion Fed Funds and SOFR risk accordingly:
USD Swaps
Swaps are a bit trickier, as we must again turn to SDR data. This is because some CCPs do not split out their OIS volumes by index. However, we can calculate the split in SDR data between Fed Funds and SOFR indices:
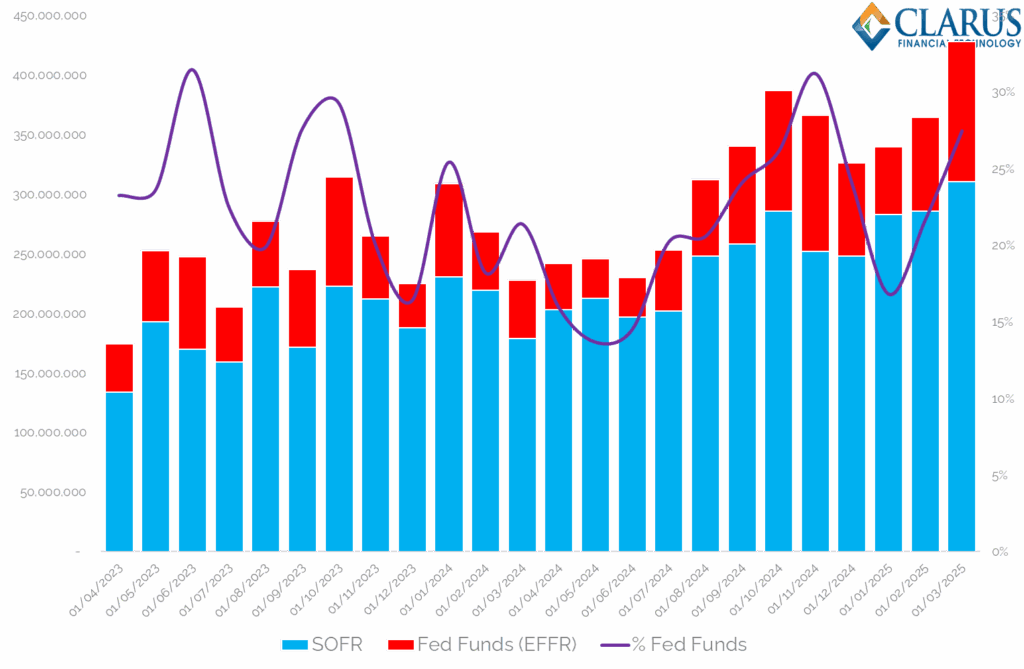
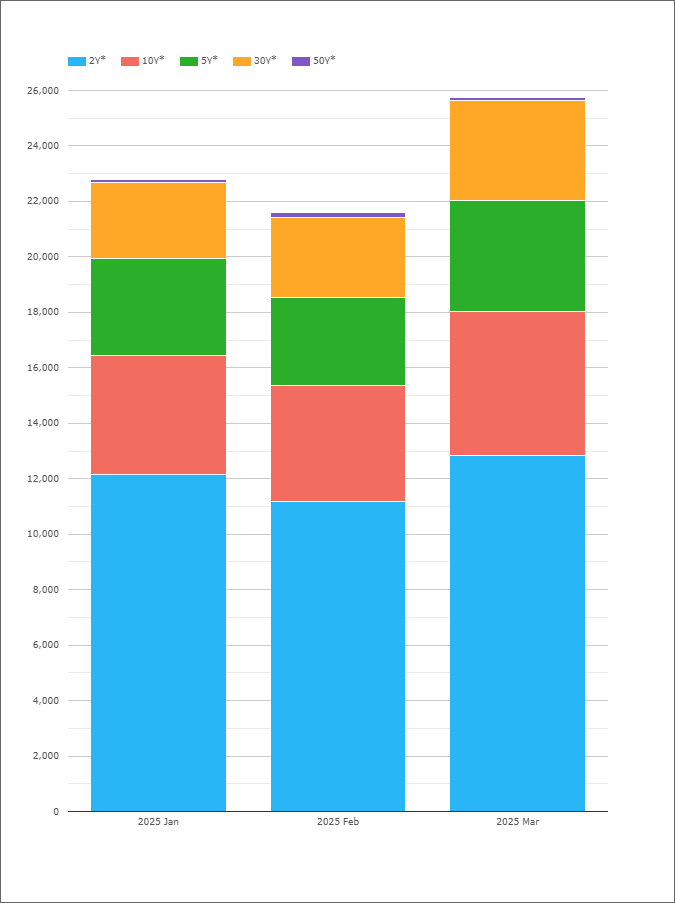
DV01 of SOFR and Fed Funds OIS reported to US SDRs. Source: SDRView
Showing;
- DV01 of USD OIS reported to US SDRs each month.
- Importantly, the DV01 calculated here uses the same methodology as we used in the RFR Adoption Indicator. This means that any OIS shorter than 2Y is grouped into a generic “2Y” tenor bucket.
- This increases the DV01 of Fed Funds swaps, because most of the swaps are just 4-6 weeks in length. However, it reconciles with the RFR Adoption Indicator, suiting our purposes here.
- There is a large amount of variation month-on-month in the relative amount of Fed Funds risk traded. Anything from 14% to 31% of risk might be versus Fed Funds.
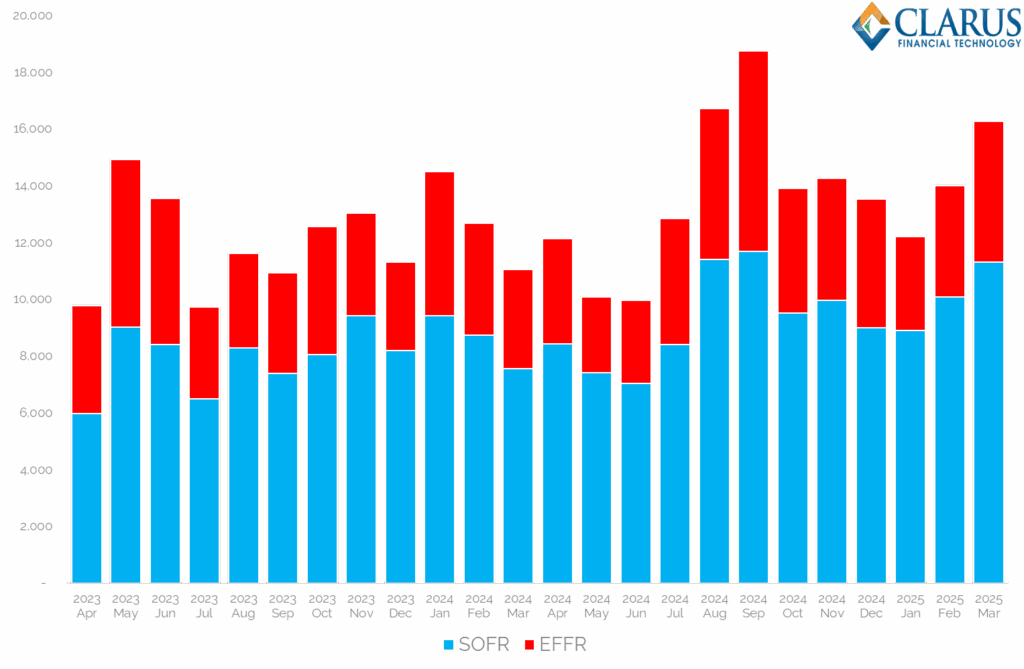
We can therefore use this same split between Fed Funds and SOFR to calculate the split of DV01 of all USD OIS. In CCPView, we run the total DV01 of OTC OIS for USD and use the split from the chart above:
Final Calculation
This analysis provides us with all of the steps necessary to calculate the RFR Adoption Indicator:
- DV01 risk of all OIS and STIRs vs RFRs in AUD, CAD, CHF, EUR, GBP, JPY & SGD.
- Add to this the DV01 of SOFR Futures.
- And finally add the DV01 of all USD OIS multiplied by the percentage of SOFR trades from the SDR.
- This is the numerator.
- Divide this by the DV01 of all OTC IRD and STIRs in AUD, CAD, CHF, EUR, GBP, JPY, SGD & USD (the denominator).
This slightly different calculation reconciles extremely well with the old data-series and allows us to extend the time-series to today:
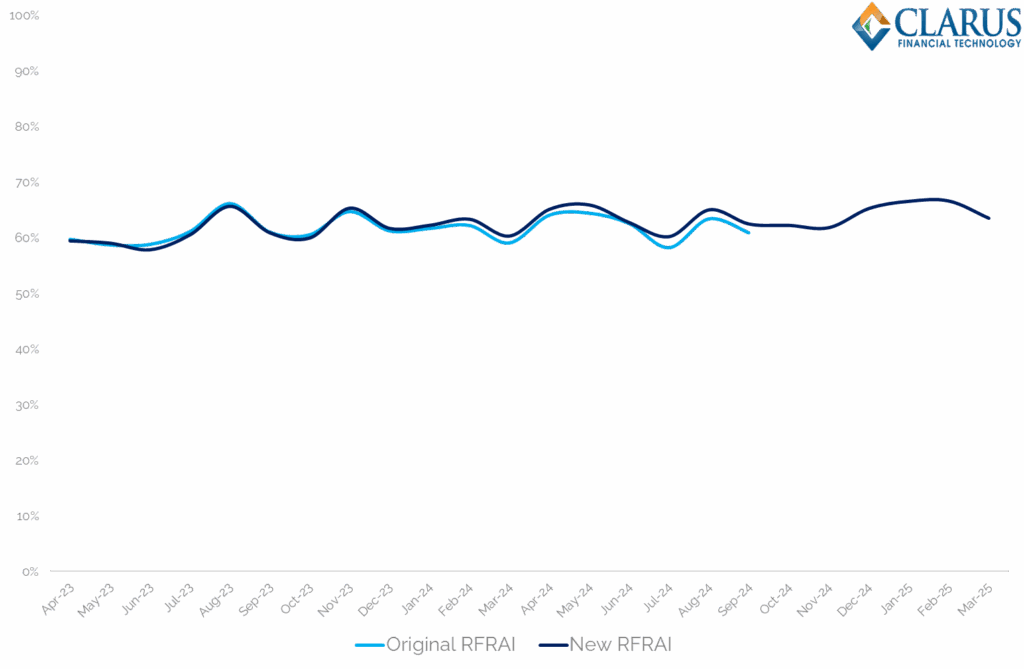
Showing;
- The new calculation is within 1.9% of the original methodology.
- The new calculation allows us to extend the data set to include current data.
- We find that in the past six months, the RFR Adoption Indicator has ranged from 62-67%, hitting a new high at the beginning of this year.
In Summary
- Context & Background: Clarus subscribers can replicate the RFR (Risk-Free Rate) Adoption Indicator, originally created in partnership with ISDA in 2020. Although the original methodology can no longer be used due to changes in CCP data publication, interest in the indicator remains strong.
- Updated Methodology: A new approach uses SDRView data and CCPView to derive tenor profiles and calculate DV01 (dollar value of a basis point) across interest rate derivatives in eight currencies. For USD, special care is taken to separate SOFR and Fed Funds risk using SDR data, maintaining consistency with the original indicator.
- Result & Accuracy: The revised method closely aligns with the original indicator, differing by no more than 1.9%, and enables continued tracking of RFR adoption. Recent data shows that RFR-based trades make up 62–67% of cleared IRD DV01, with a new high recorded early this year.