In part 1 of this blog, we promised to follow up with part 2. Here it is.
Key takeaways
- Inspecting daily volume plots of H1 2025 IBOR SPS by currency and platform id from SDRView, we see convincing evidence of over $1 trillion of SPS activity from reset optimization runs reported to SDRs as D2D platform type.
- The evidence indicates this activity comes from the reset optimization runs of Reset, Matchbook, and, apparently, Tradition.
- Combining the IBOR SPS stats in this blog with FRA stats from part 1, we get a total of $26.1 trillion of trading activity from reset optimization runs in H1 2025, comprising:
- $25.0 trillion FRAs ($24.24 trillion in EUR, $731 billion in CZK, DKK, HUF, NOK, PLN, and SEK).
- $1.1 trillion IBOR SPS ($804 billion in AUD, $206 billion in ZAR, $71 billion in NZD).
Background
In Part 1, we estimated that, of the $31.1 trillion SDR-reported FRA activity in H1 2025, reset optimization-driven FRA spike days from OSTTRA’s Reset service and Tullett Prebon’s Matchbook service (formerly “tpMatch”) totaled $25.0 trillion.
Single-period (interest rate) swaps, or SPS, are a natural alternative to FRAs for reset exposure hedging. The two services’ websites indicate they generate both FRAs and SPS. Today, we examine SPS activity spike days to complete our reset optimization volume analysis.
SDR-reported SPS
In recent years, the cessation in publication of term interbank offered rates (IBORs) by order of regulators has effectively ended term interest reset exposure hedging with FRAs or SPS in USD, GBP, JPY, CHF, CAD, THB, and SGD. Along a similar timeline, SPS were promoted as an improvement over FRAs because they result in cash interest payment on the same day as the corresponding cash flows in IRS portfolios hedged, or because they could be processed using existing IRS infrastructure. Therefore, for the currencies that remain non-IBOR transitioned, we should examine the relative volumes of FRAs and SPS.

Chart 1: H1 2025 US-reported relative volume of FRAs and SPS by non-EUR currency (USD notional volume percentage). Source: SDRView
Chart 1 shows that the market has chosen either FRAs or SPS for each currency. I excluded the FRA-dominated EUR to allow the profile of other currencies to be visible at a larger scale. Of the currencies with notional volumes over $2 billion in H1 2025:
- FRAs were chosen for CZK, DKK, EUR, HUF, NOK, PLN, and SEK – the same currencies with FRA spikes in Part 1 of this blog.
- SPS were chosen for AUD, BRL, CLP, CNY, COP, HKD, ILS, INR, KRW, NZD, and ZAR.
Let us examine SPS volumes by platform type. For clarity, I have excluded trades on RFR indexes to exclude a small volume of misreported trades with OIS indexes and IRS product type.
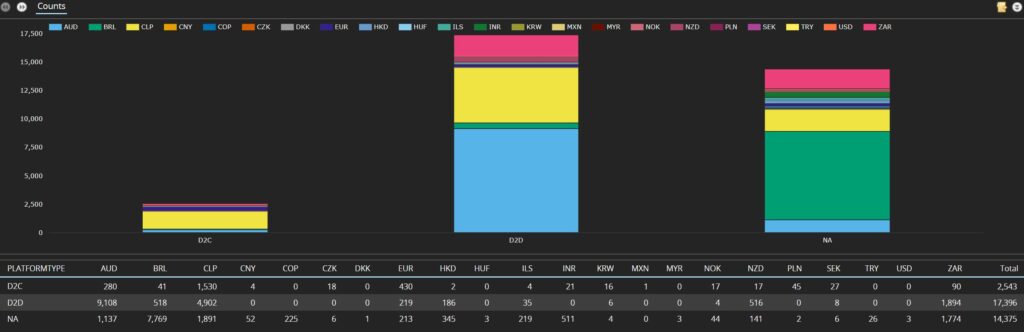
Chart 2: H1 2025 US-reported IBOR SPS trade counts by platform type and currency (USD billions). Source: SDRView
Chart 2 shows a total of over 33,000 IBOR SPS trades.
- Off-platform (NA) totaled over 14,000 trades with trades in all currencies, except MXN and MYR.
- D2C platforms totaled over 2,000 trades, reflecting relatively lower interest in reset exposure hedging among buy-side firms.
- D2D platforms totaled over 17,000 trades, of which 99.7 percent were in AUD, BRL, CLP, EUR, HKD, NZD, and ZAR, and the rest were in ILS, KRW, SEK, and NOK.
Next, we look at the D2D subset of the above cut by platform id and currency.
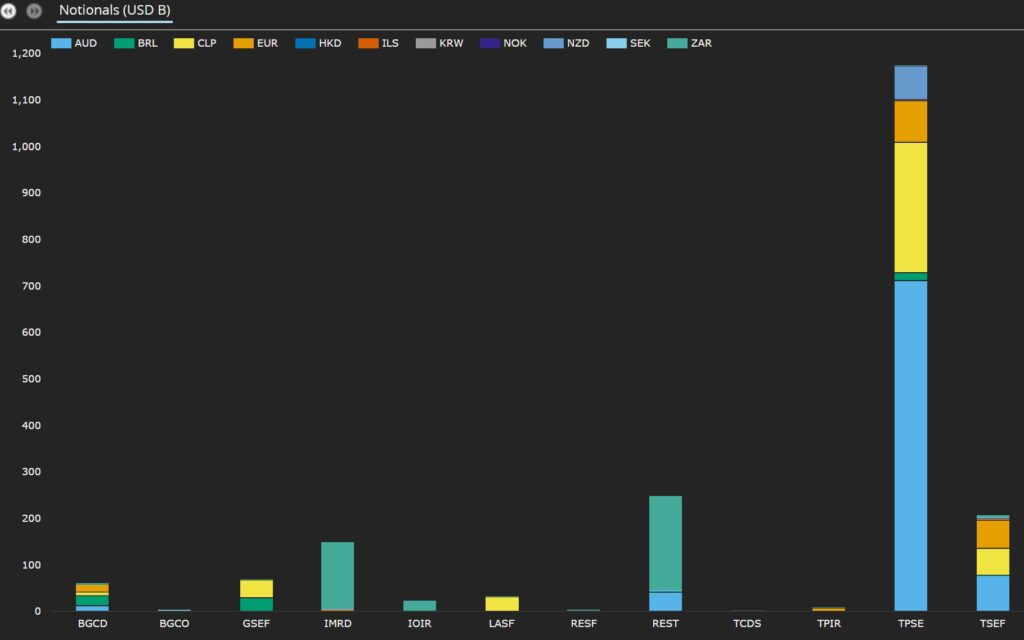
Chart 3: H1 2025 US-reported IBOR SPS trade notional volumes by platform and currency (USD billions). Source: SDRView
Chart 3 shows the same $1.98 trillion of IBOR SPS, of which 99.5 percent comprised the seven biggest currencies.
- TPSE (including Matchbook) was the largest with $1.17 trillion (59 percent of the total), including – in size order – $711 billion AUD, $278 billion CLP, $91.2 billion EUR, $71.4 billion NZD, $18.0 billion BRL, and $1.7 billion HKD from our seven currencies.
- Other Tullett’s platforms were $183 billion (9.2 percent), including $170 billion ZAR, $11.1 billion EUR from our seven currencies.
- Reset (REST, RESF) is next with $252 billion (12.8 percent), including $206 billion ZAR, $41.6 billion AUD, and $4.5 billion HKD from our seven currencies.
- Tradition (mainly TSEF plus TCDS) had $209 billion (10.5 percent), including all seven currencies except HKD.
- BGC (BGCD, BGCO) had $132 billion.
- Latam SEF (LASF) had $31.7 billion (1.6 percent), all CLP.
We now plot the same data by date and currency. The clearest way to see patterns is to plot each currency separately. I will spare you a lot of charts by saying that only three of the eleven currencies with D2D SPS showed a pattern of spike days: AUD, NZD, and ZAR.
We start with AUD.

Chart 4: H1 2025 US-reported D2D platform AUD BBSW SPS trade notional volumes by date and platform (USD billions). Source: SDRView
Chart 4 shows that, in H1 2025, AUD Bank Bill Swap Rate (BBSW) SPS had:
- 23 Matchbook (TPSE) spike days (dark blue bars totaling $687 billion – between $2.29 billion and $71.2 billion per day, typically on Mondays).
- 12 Reset (REST, RESF) spike days (pale gray bars totaling $41.6 billion – between $293 million and $7.68 billion per day, typically on Wednesdays)
- 20 Tradition (TSEF) volume days (dark orange bars totaling $73.1 billion – between $47 million and $30.1 billion, typically on Tuesdays). I have no Tradition website information confirming these are reset optimization runs, but that would be a natural inference from the chart.
- Activity on non-spike days was led by Tullett (TPSE) with a total of $19.8 billion, followed by BGC (BGCD) (pale blue bars) with a total of $11.2 billion.
Next, we come to ZAR.
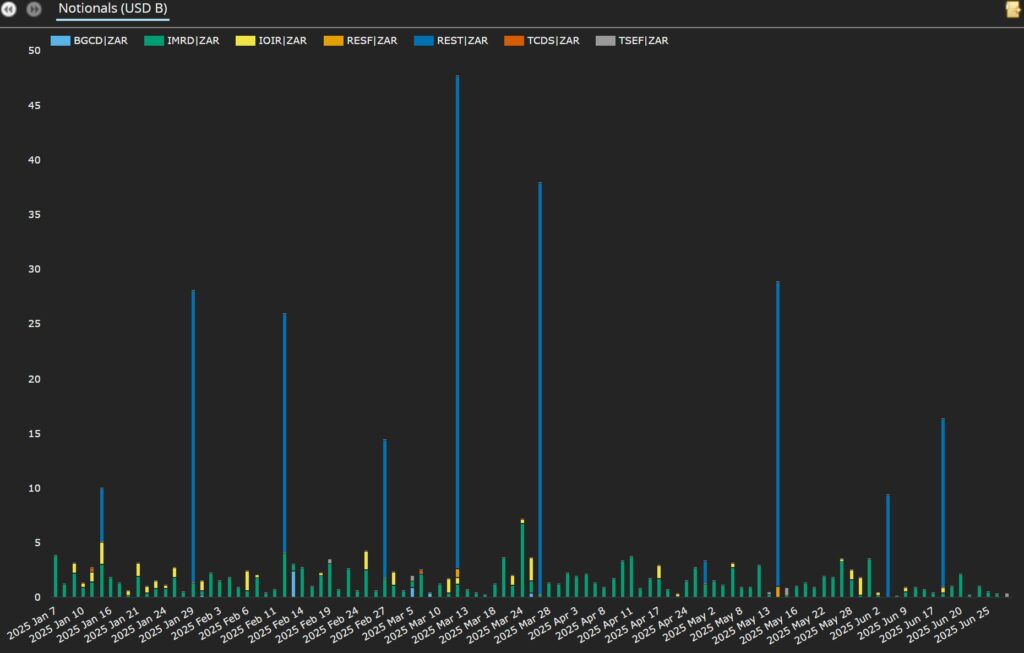
Chart 5: H1 2025 US-reported D2D platform ZAR JIBAR SPS trade notional volumes by date and platform (USD billions). Source: SDRView
Chart 5 shows that, in H1 2025, ZAR JIBAR SPS had:
- 10 Reset (REST, RESF) spike days (dark blue and orange bars totaling $206 billion – between $2.1 billion and $45.9 billion, typically on Wednesdays)
- Activity on platforms without spike days was led by IMRD (green bars) with a total of $144 billion, followed by IOIR (yellow bars) with $25.3 billion. Both are Tullet platforms.
Note that JIBAR is due for cessation at the end of 2026.
Finally, we have NZD.
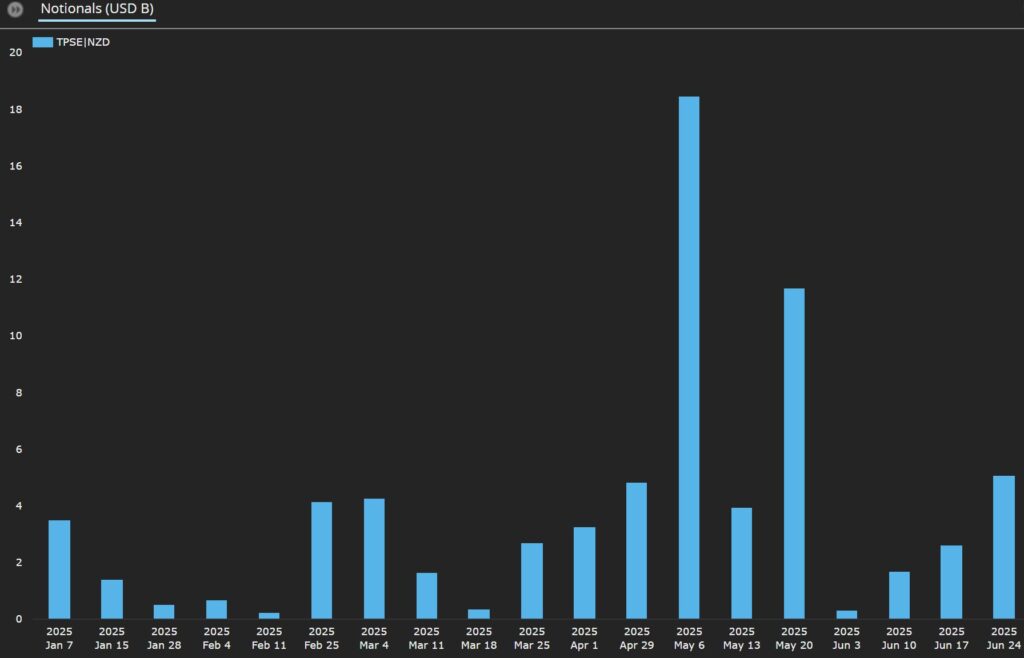
Chart 6: H1 2025 US-reported D2D platform NZD BKBM SPS trade notional volumes by date and platform (USD billions). Source: SDRView
Chart 6 shows that, in H1 2025, NZD Bank Bill Reference Rates (BKBM) SPS had 19 Matchbook (TPSE) spike days (pale blue bars between $226 million and $18.5 billion, typically on Tuesdays). There was no activity on other days.
Summary of parts 1 and 2
Today, we unearthed reset optimization activity in IBOR SPS totaling $1.08 trillion.
Combining the stats across parts 1 and 2, we get a total of $26.3 trillion of activity from reset optimization runs. This breaks down by currency and platform as follows:
- $24.3 trillion EUR FRAs – $18.1 trillion from Reset (typically on Tuesdays), $6.2 trillion from Matchbook (typically on Thursdays).
- $731 billion other currency FRAs – all from Reset (typically on Wednesdays). The other currencies were CZK, DKK, HUF, NOK, PLN, and SEK.
- $804 billion AUD SPS – $687 billion from Matchbook (typically on Mondays), $75.8 billion from Tradition (mostly Tuesdays), and $41.6 billion from Reset (typically on Wednesdays).
- $206 billion ZAR SPS – all from Reset (typically on Wednesdays).
- $71 billion NZD SPS – all from Matchbook (typically on Tuesdays).
End note
- To recap the key takeaways, jump back to the section near the top.
- We expect to update regularly on reset optimization in the future.
- Contact us if you are interested in using SDRView.