Good Friday marked the end of the 29th week of SEF trading. As with most holiday weeks, volume dropped off. But how about the larger trend over the past 6 weeks?
DATA
Lets first look at SEFView for the most recent 6 weeks:
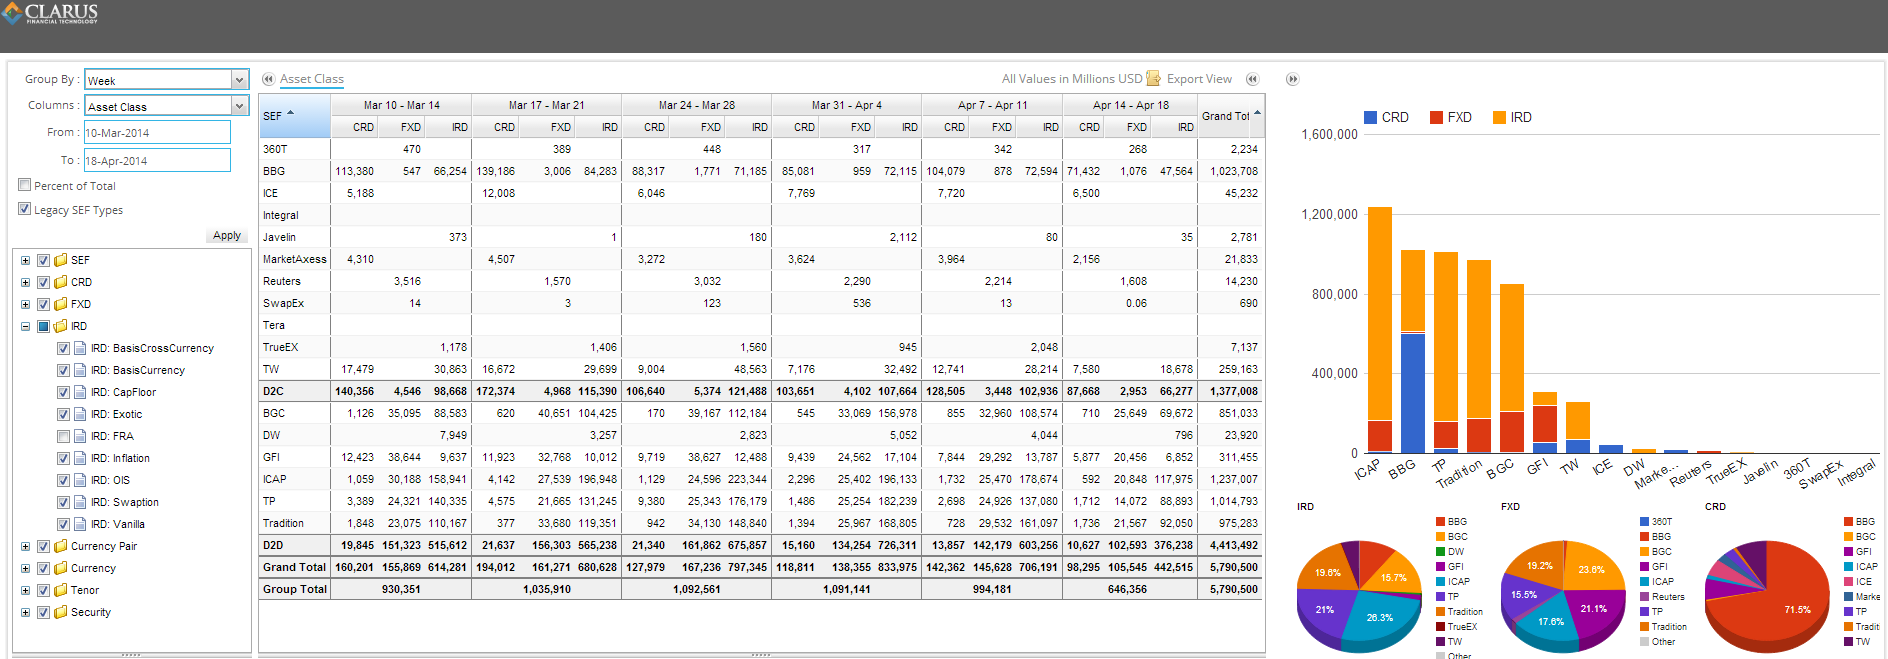
So we’ve seen a few things over these 6 weeks:
- CRD activity peaked the week of March 17
- IRD activity peaked the week of March 31
- Total SEF activity peaked through the last 2 weeks of March, and has come well off. One would hope this is mostly due to the holiday week
Sticking to this 6 week period, I then removed FX and chose only vanilla IRD and all CRD:
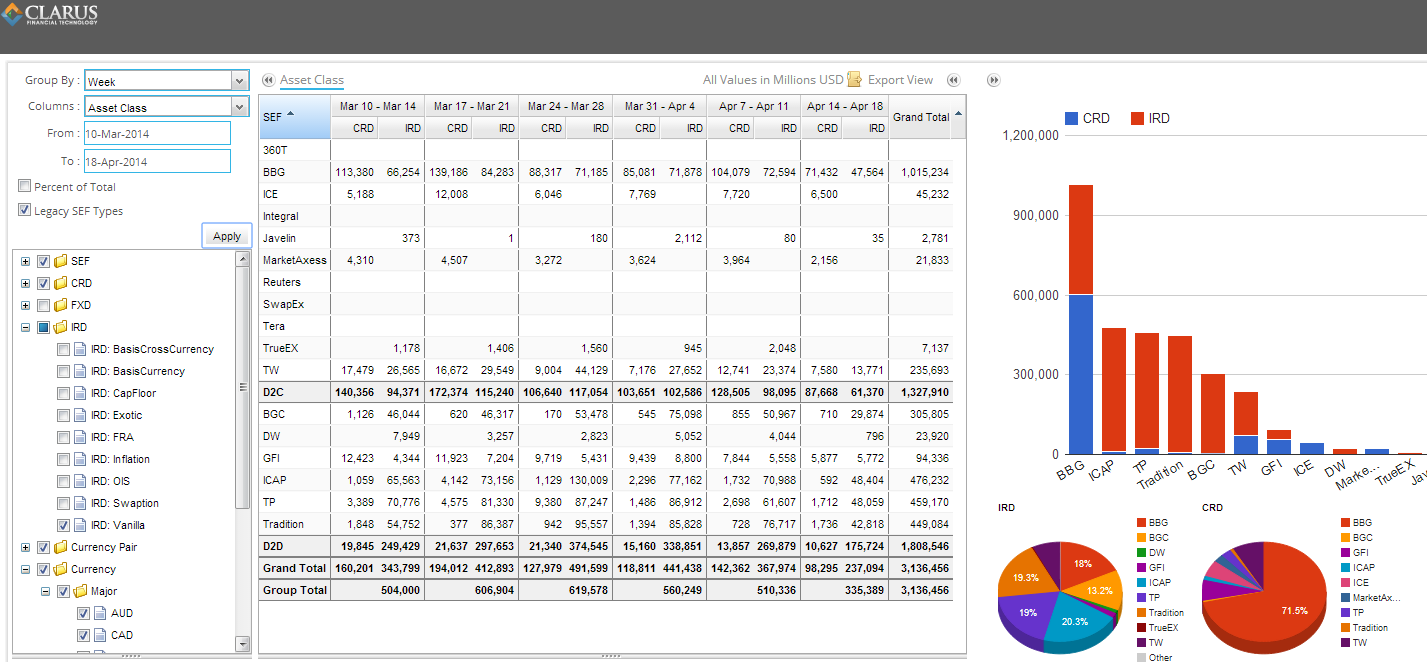
This data is a familiar picture and once again confirms the initial dominance Bloomberg SEF has in the Client space.
OUTSIDE THE BOX
We’ve looked at USD and EUR activity quite a lot in our blogs, given that these (and GBP) constitute the MAT products. Removing these, one might expect to see not a whole lot. And you wouldn’t be too far wrong, however these (non-USD and non-EUR) figures represent roughly 15% of total activity. One perhaps obvious outcome is that this removes all credit derivatives. What is somewhat surprising is that this now drastically changes the landscape:
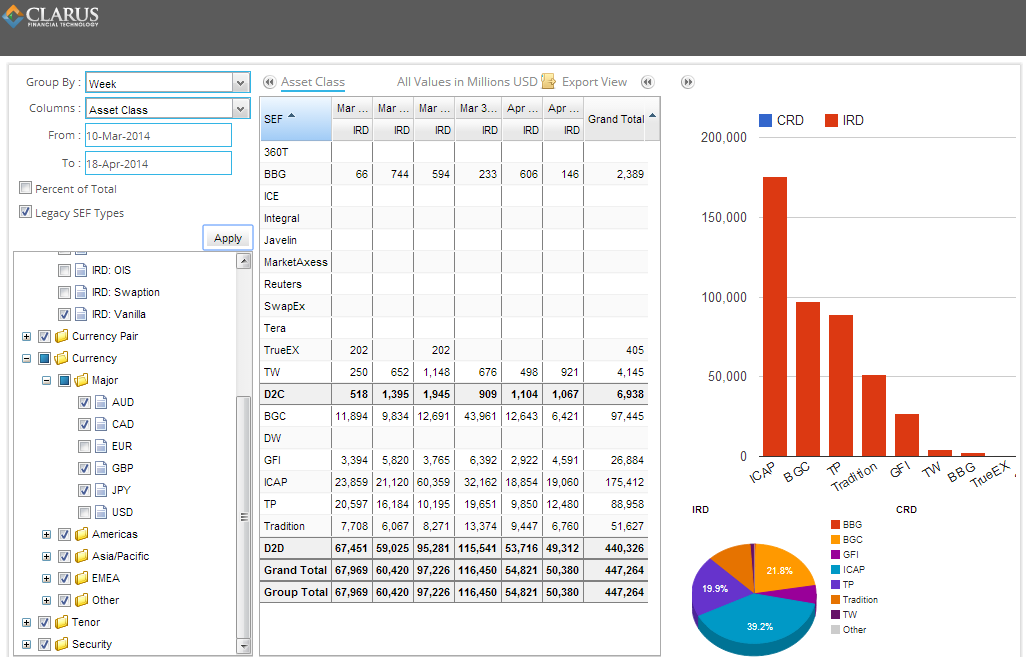
The IDB’s now have a clear edge over the competition. Of course the next logical thing to do is to look at which currencies are the biggest culprits. Remember all the previous caveats, Vanilla IRD, previous 6 weeks:
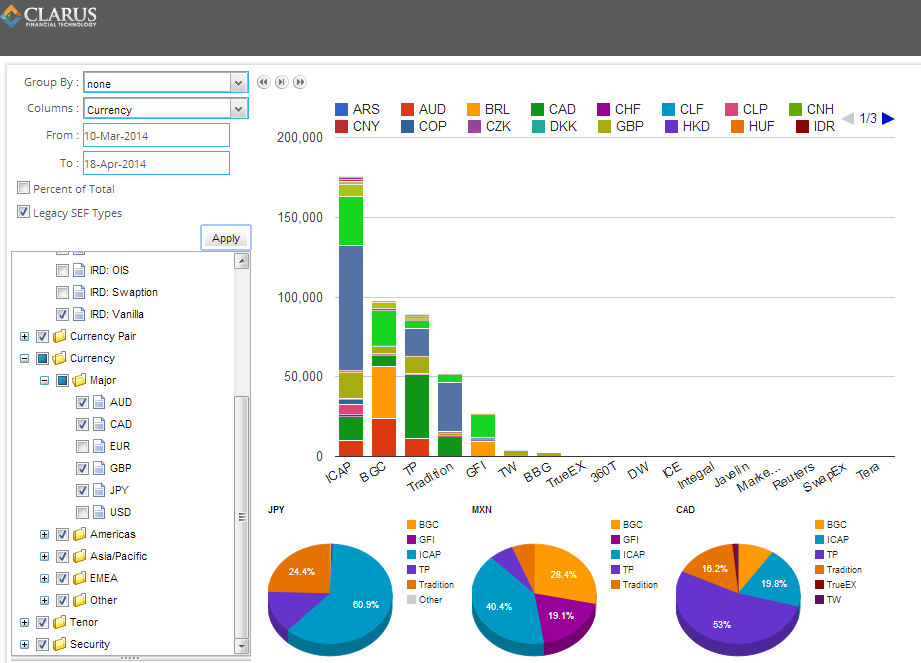
The color scheme might be a bit hard to follow, given 3 pages of currencies. You’ll have to take my word that if you hover your mouse over the colors in SEFView, you can see what currency is what. The 3 pie charts show the largest contributors.
SWAP OR FRA?
I found something curious when drilling into CAD and sorting by tenor. Have a look and see if you see what I see:
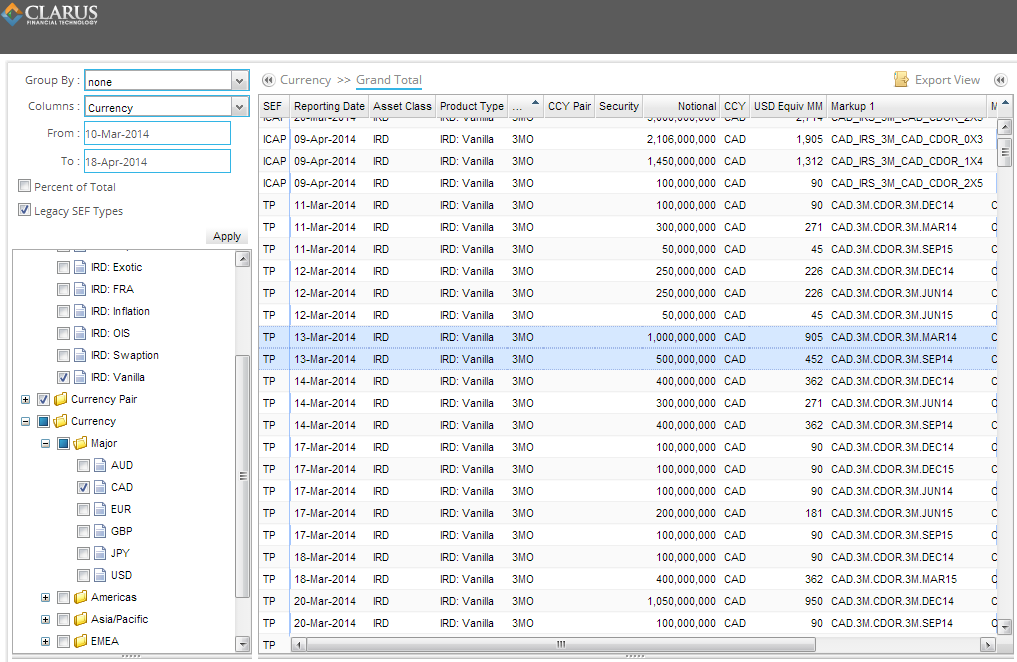
Thats right, 3 month CAD swaps. Fixed/Float swaps. Isn’t that financially (nearly enough) just a 3 month FRA?
To answer that, I headed to SDRView and tried to find the 2 tpSEF trades on March 13th (1bn and 500mm notional). Found them, and indeed they are reported as fixed/float swaps. Interestingly, we can also see that while the DTCC caps the first trade at 650mm, we know from the SEF data the true 1bn size:

Cant say that I am terribly familiar with CAD swaps, but would seem to me that 3 month swaps might be a result of a non-existant FRA market? Indeed, if I search both SDRView and SEFView for CAD FRA’s, I come up empty. Presumably someone out there will be able to shed some light on this.
COMING UP
Three weeks until the end of the packaged trade allowance ends. Current thinking is that butterflies and rate switches will end up MAT. We look forward to monitoring that, so stay tuned. And check out SEFView for yourself.