The SEF world continues to churn out data. I didn’t write a blog last week (week 24, March 10-14), and my loyal followers let me hear it. Everyone should know by now that the data is there to be seen on SEFView at any time. We’ve just begun updating the data on a daily basis (T+1), so you’ll need to check often.
DATA
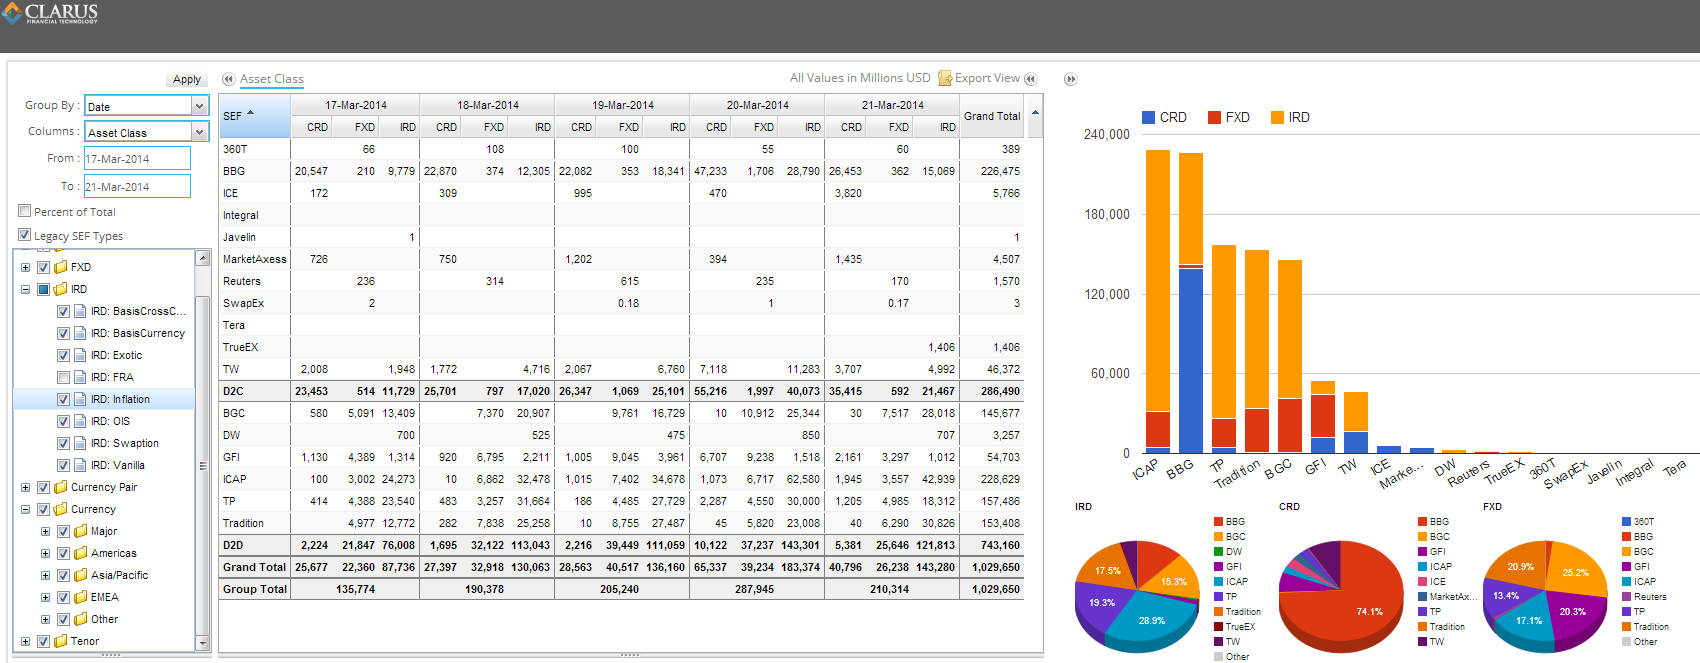
Daily data for the week of March 17-21:
WHEN I GROW UP I WANT TO WORK IN MARKETING AT BLOOMBERG
Its been interesting watching the D2C space grow. In particular, its hard to miss the strong showing that Bloomberg has put in over the past month, really since the first week of MAT. In the chart above, we can clearly see that BBG is just a shade out of being the largest SEF for the week. This is particularly impressive given BBG is not trading any Swaptions, inflation, basis swaps, etc. Not to mention it has traditionally represented 100% client activity. Has that changed? Are dealers trading amongst themselves now on Bloomberg? Surely there are no RFQs between banks, but is the CLOB gaining traction between dealers?
That all looks very positive for Bloomberg, but the powerpoint slide I would use if I was with in their marketing department is the following:
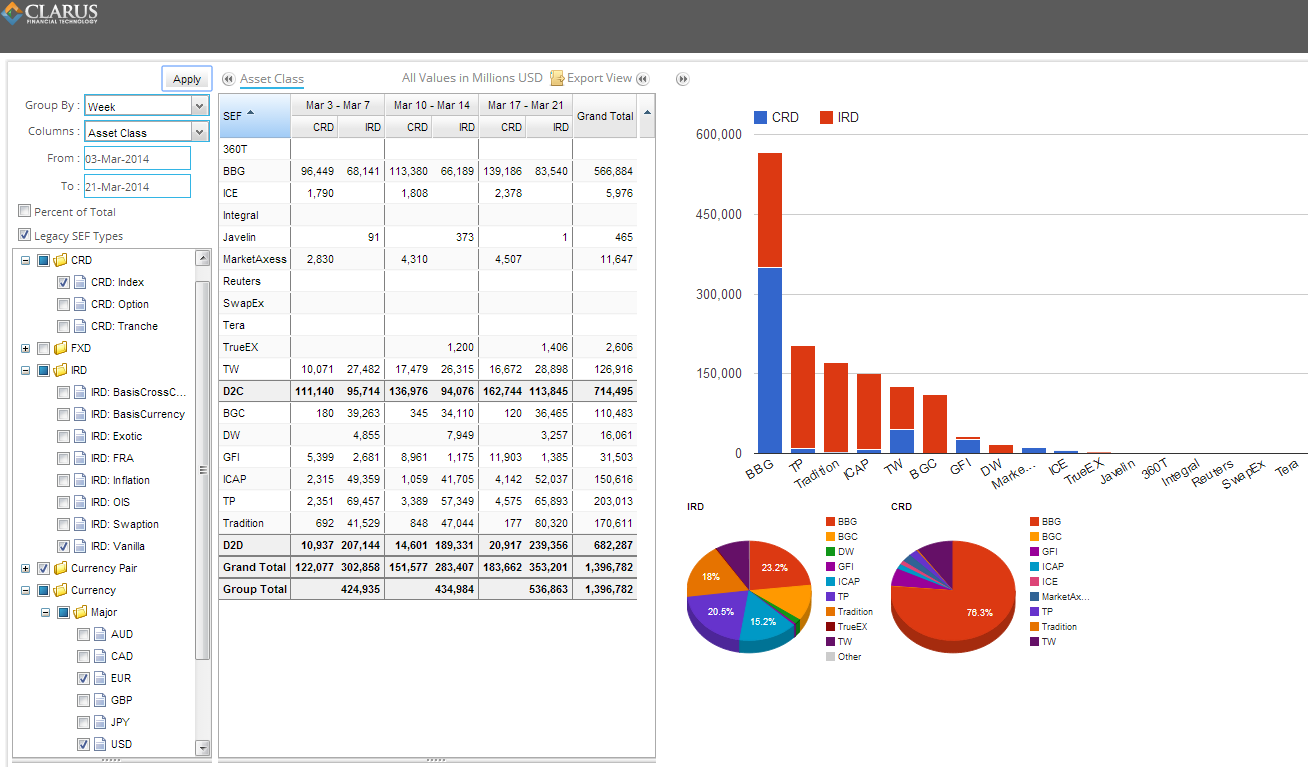
I’ve chosen to look at only EUR and USD denominated vanilla IR swaps and CDS indices. Of course you can make any chart look good, but this was relatively easy!
D2C GROWTH
This made me want to see the trend. So I exported data from inception of SEFs into a spreadsheet and came up with the following:
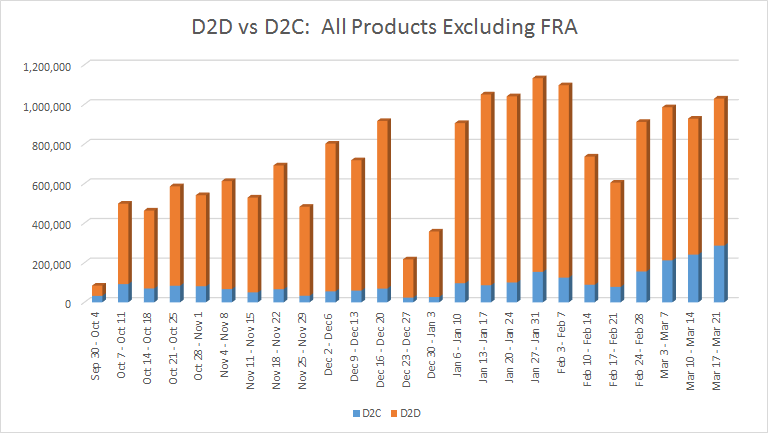
This shows a small bump up in D2C (blue) in the couple weeks before MAT (Feb 17 week), followed by strong growth starting the week after MAT.
Whittling this down to only EUR and USD, vanilla IR swaps and CDS Index (as per the 2nd SEFView screenshot above), the trend is even more clear:
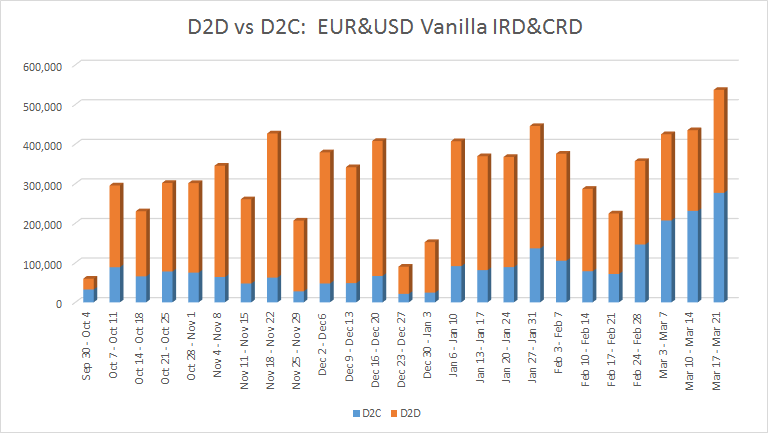
D2C is roughly equivalent to D2D activity. In fact for the previous week (Mar 10-14), we can see D2C accounted for more EUR and USD vanilla “swaps” than D2D.
What can I say? Very interesting.
DOES D2D & D2C MAKE SENSE ANYMORE?
We’ve heard the debate many times. Given “Open Access” and dare I saw “All to All”, does this analysis even make sense anymore? Leave us your comments below.
Hint: We’ve allowed users of SEFView to turn off the “Legacy SEF” categorizations of D2D and D2C. However I still find it useful to leave it on. But perhaps I am just nostalgic.