For years now we’ve been hearing about the “Futurization of Swaps”. It’s always been difficult to pay much credence to it, as in our collective heads we always compare it to a world of Swaps that has trillions of notional. Now that we have swaps traded on SEFs, we can put this in some kind of perspective. In order to make this easier, for this week, we decided to enhance the SEFView reporting service to include the most relevant Interest Rate Swap Futures:
- CME Deliverable Swap Futures (DSF)
- Eris Swap Futures
First, lets look at the data for the previous five weeks.
DATA
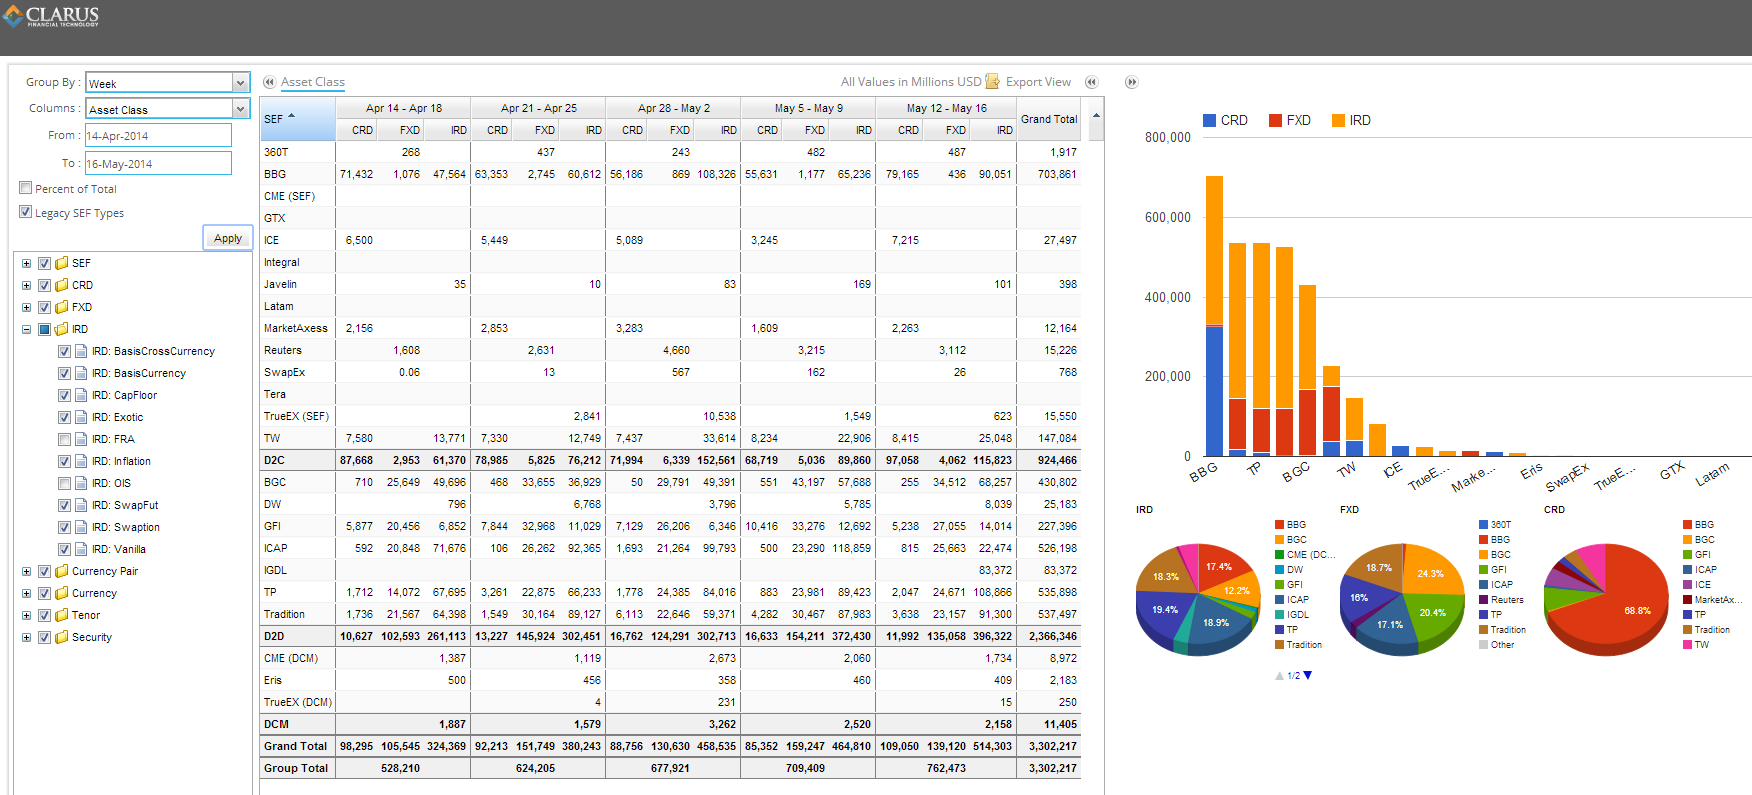
Some things to note:
- We now categorize by D2C, D2D, and DCM. This seems the most plausible way to separate these.
- We have split TrueEX activity into TrueEX SEF and TrueEX DCM.
- Drilling into the TrueEX SEF, we see only termination/compression
- Drilling into the TrueEX DCM, we see what appears to be occasional IR Swap activity
- CME DSF contracts account for approximately 4x the activity of Eris swap contracts (both standard and flex)
- CME and Eris contracts account for a very small percentage of IR swap activity
PRODUCT OF THE FUTURE
We’ve been led to believe that Interest Rate swap futures are more easily executed, readily fall into futures processing, can financially mimic OTC swaps, and are less capital intense than over the counter swaps. So if we look at only Vanilla USD swaps, do we get a better picture?
Note that CME has begun offering EUR DSF. The picture below however looks at just USD swap futures and USD “vanilla” swaps. I’ve chosen to look at data from July 2013, which pre-dates SEFs.
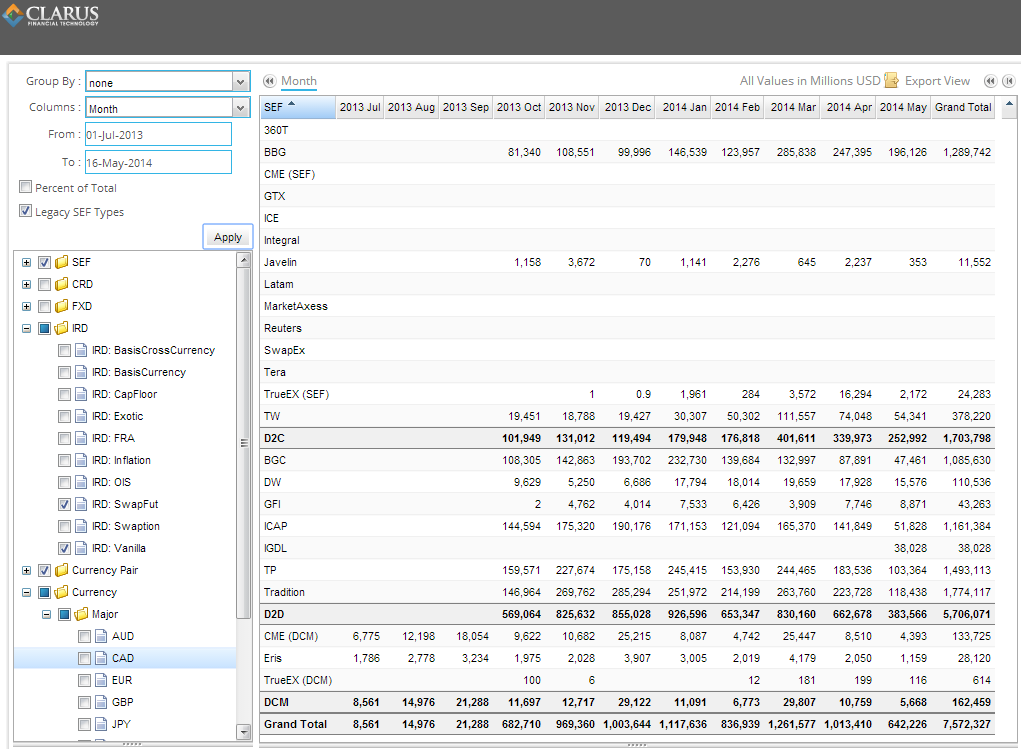
Some things that jump out at me:
- Swap Futures tend to run at approximately 0.5% – 2.5% of SEF-Executed OTC USD Swaps
- Comparing to only D2C activity, Swap Futures tend to run at approximately 2.5% – 20% of SEF-Executed OTC USD Swaps
- There are peaks in the CME DSF activity around December and March. This could be related to contract expiration / rollovers?
- Swap Futures activity (CME and Eris) has not appeared to be impacted (positively or negatively) by the launch of SEFs, given the activity we can see here from July-September 2013, before SEF launch
CONCLUSION?
The data generally supports what many of us have thought: Swap Futures sound interesting and seem credible, but there’s not much there to see yet.
Now that SEFView is tracking this data, we’re able to track this going forward. Check for yourself.