Following on from yesterday’s article, Bloomberg SDR is now Live, I will look at what we can learn from the first trading days data.
Using both our SEFView and SDRView products.
First a quick re-cap on these.
SEFView
SEFView sources data from each of the 20+ SEF websites.
This data is published at the end of day by each SEF and consists of product volumes by instrument. In some case it also includes block volumes and open, high, low, close prices.
We can use this data on T+1 to look at product volumes for each SEF and compare market share.
SDRView
SDRView sources data from the real-time public dissemination feeds of the US DTCC SDR and the Bloomberg SDR (BSDR).
This data includes all OTC Derivatives, whether On SEF or Off SEF and whether Cleared and Uncleared.
The data is at a detailed trade level, giving us excellent in-sight into price, size and terms of the deal. It does not include information on the parties to the deal or the SEF they were executed on or the CCP they were cleared at.
Trades are made public within a few minutes of execution time, except for block trades which are subject to delays of 15 mins or 30 mins. Block trades are also capped, so as not to fully disclose the notional.
Comparing SEFView and SDRView
Now that we have the unique situation that only Bloomberg SEF (BSEF) trades are being sent to BSDR, we can compare the data that we see in both. Lets start with SDRView for 12-May, USD Vanilla Swaps, spot starting.
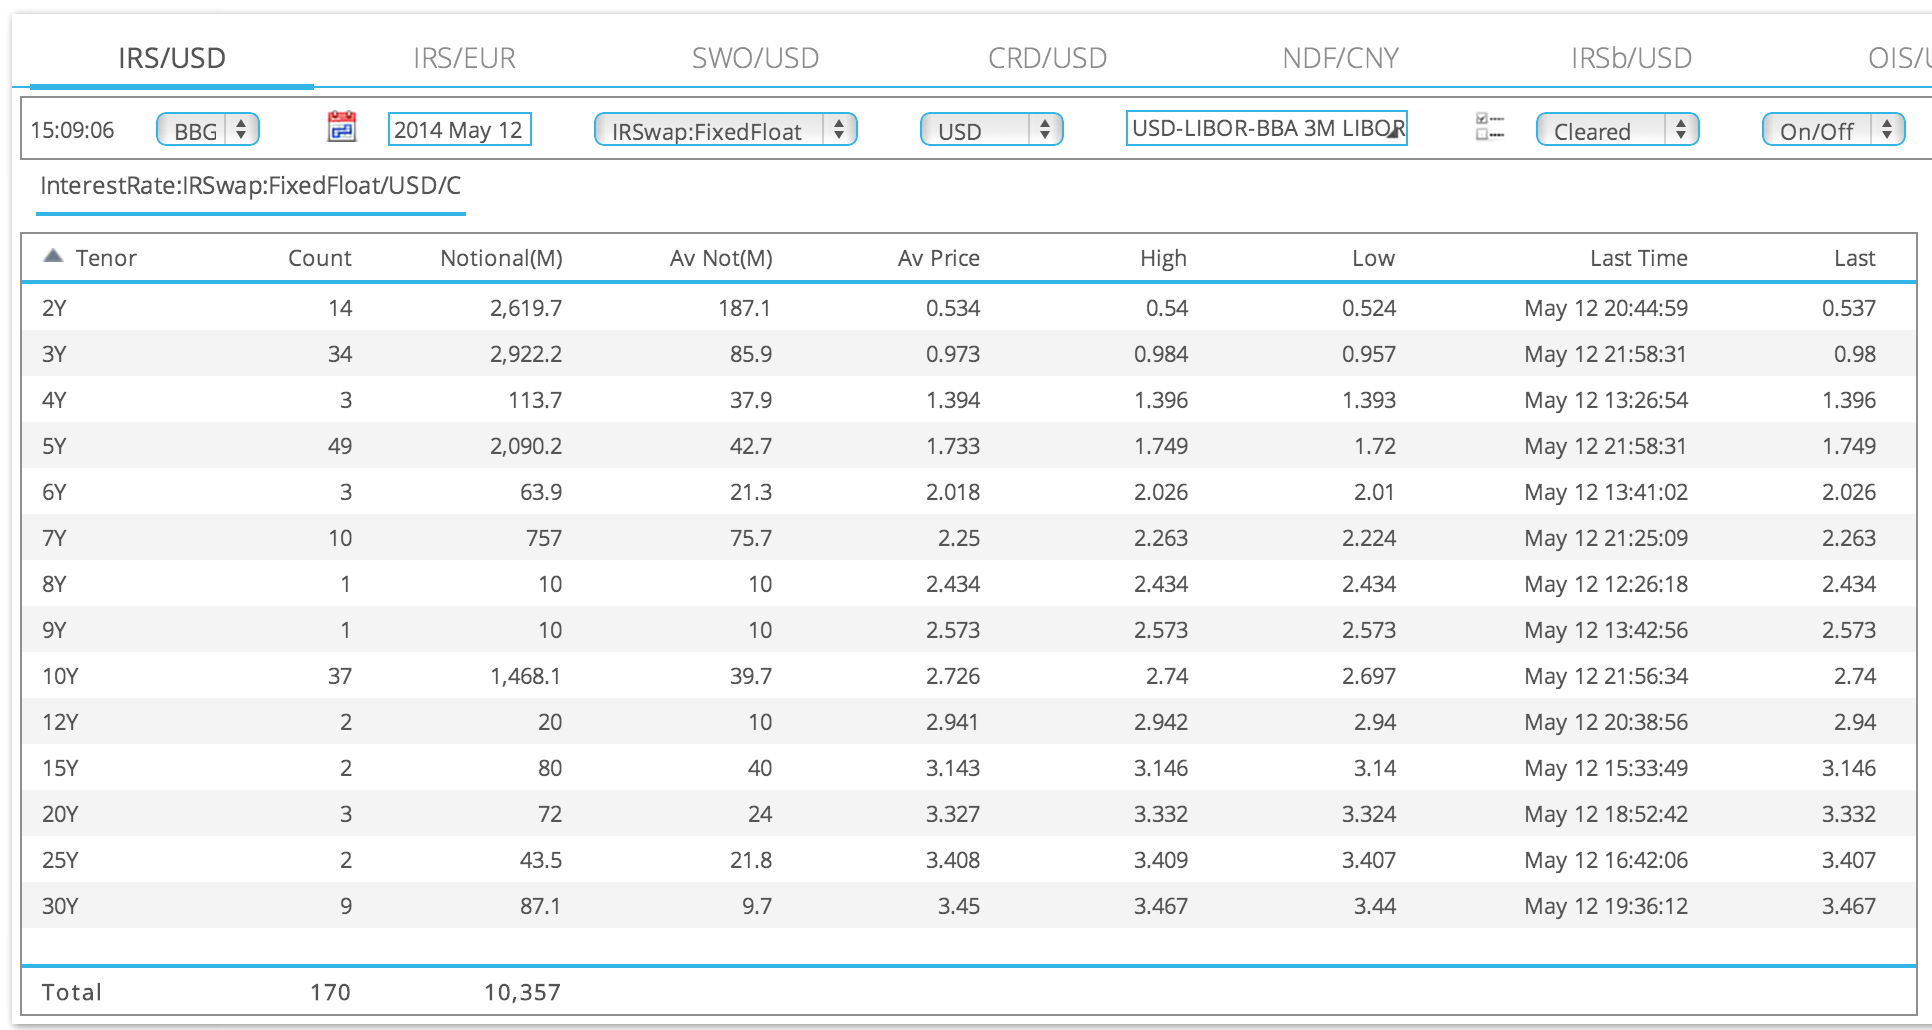
Which shows:
- 170 trades of >$10.3 billion gross notional were traded on BSEF
- 5Y was 49 trades, $2 billion gross notional, so an average size of $43m
- 5Y average price was 1.733, with a last price of 1.749 at 21:58 (LON)
The same information is available for all the other tenors.
Now lets look at SEFView.
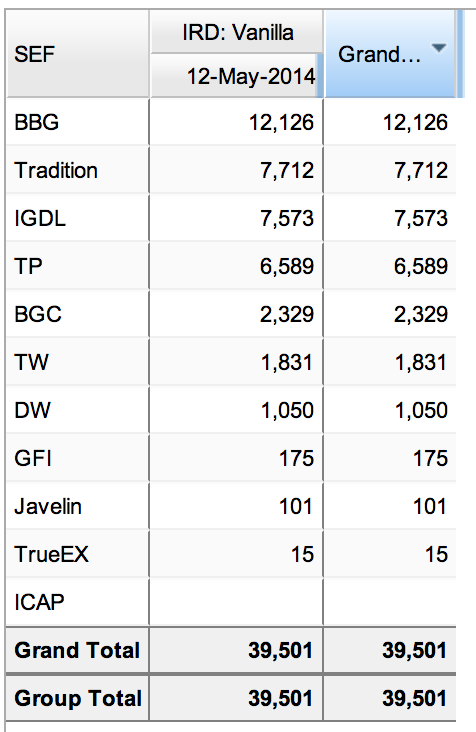
Which shows that Bloomberg had the highest notional on May-12 of $12.1 billion. Now we may assume that the SDRView figure of $10.3 billion and the SEFView of $12.1 billion, is due to block trades being capped in SDRView.
However before we jump to that conclusion a quick digression and then a drill-down.
ICAP and IGDL
You may have noticed ICAP as zero in the table above.
This is because from May-12, ICAP SEF has moved all is USD business (as well as EUR & GBP) to a new entity, ICAP Global Derivatives LTD, which has a separate CFTC SEF registration.
After some days have passed, we intend to look at whether this has an impact on ICAP volumes.
Drill-down in SEFView
Now lets drill-down on that $12.1 billion number.
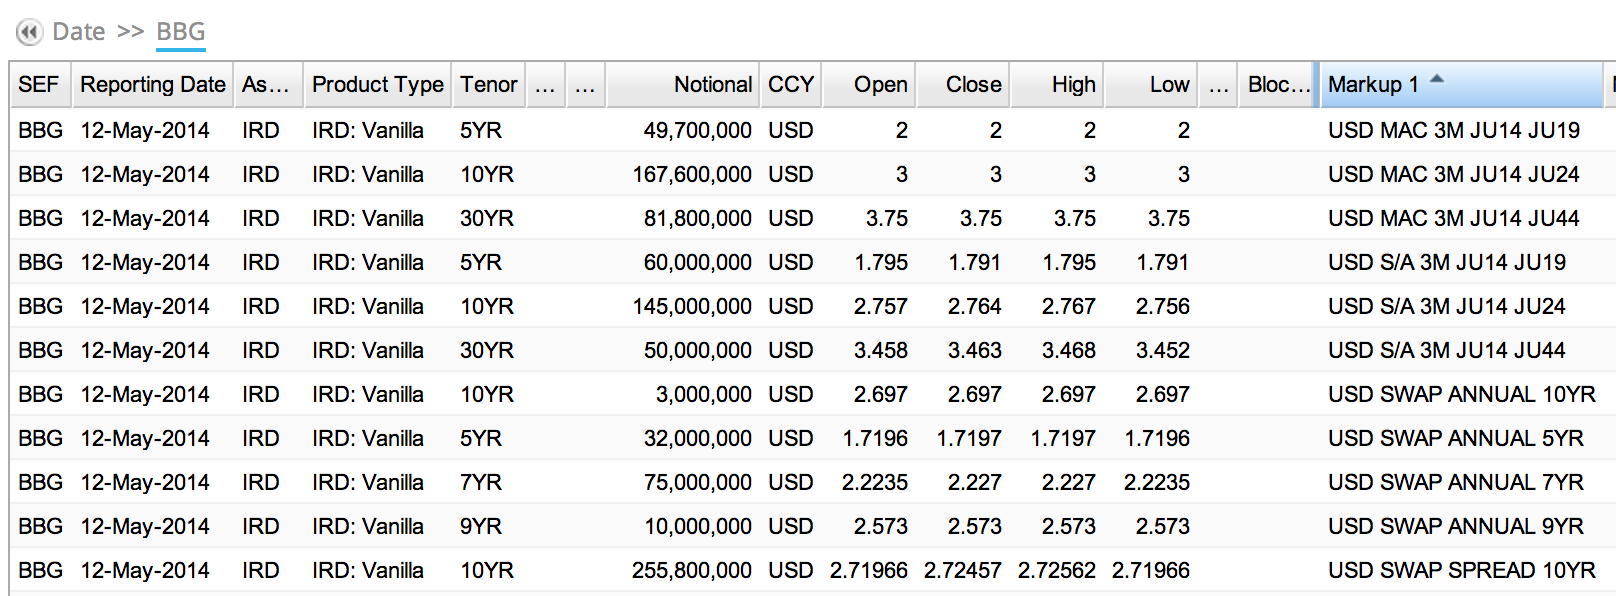
Sorting by the Markup 1 column, we can see that:
- The first 3 rows represent MAC Swaps totalling $299 million
- The next 3 rows represent IMM Swaps totalling $255 million
- The total of which is $554 million
As we excluded these in SDRView, we need to subtract this from $12.1 billion.
Giving as an un-capped total of $11.572 billion.
Our SDRView figure was $10.357 billion.
A difference of $1.215 billion.
Which we could explain by looking at the 2Y, 5Y and 7Y tenors in detail.
But that is enough detail for today on BSEF vs BSDR volumes.
DTCC SDR
Lets now compare the volumes we see on DTCC SDR vs BSDR for USD Swaps on 12 May (whether ON SEF or Off SEF).
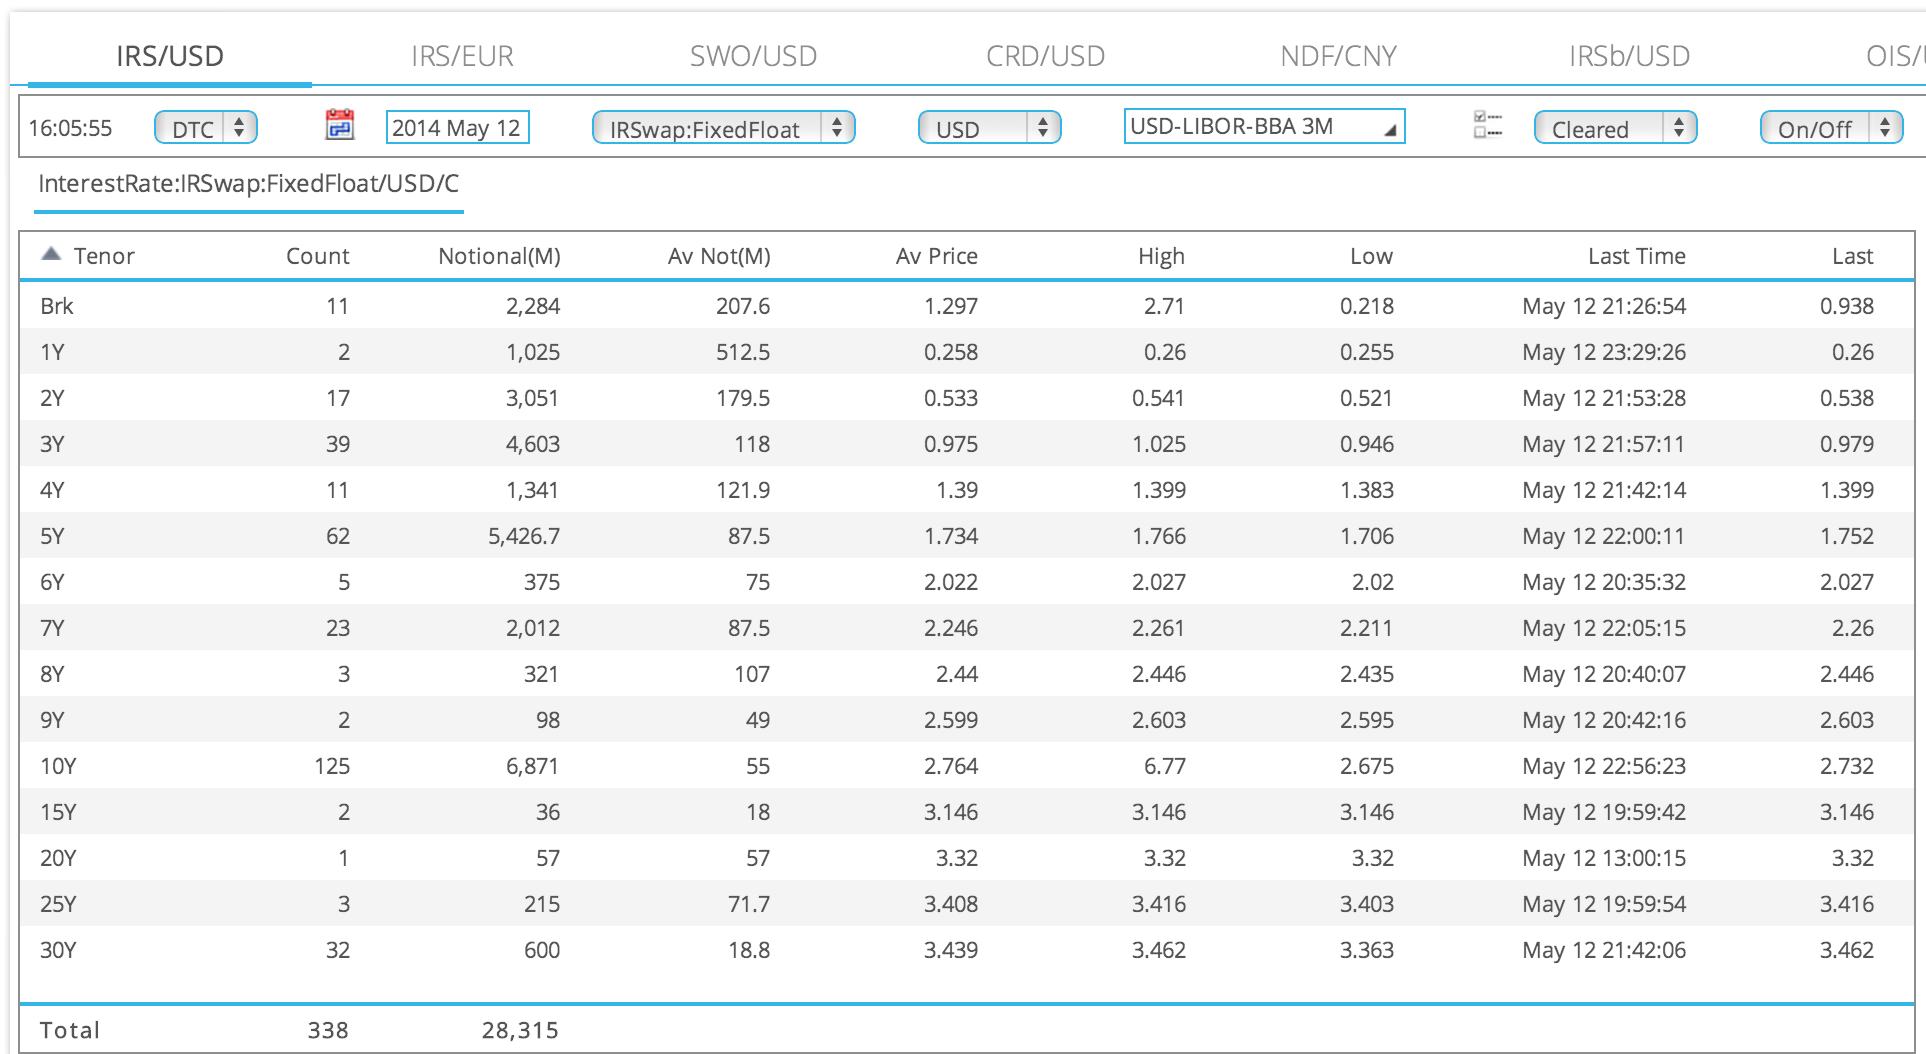
Which shows:
- 338 trades of >$28 billion notional
- Compared to 170 of >$10.3 billion notional on BSDR
We could also compare specific tenors, average notionals and prices.
Suffice to say that for vanilla spot starting usd swaps, Bloomberg volumes represent a significant chunk of the market (25%), We can also assume that these are Dealer-to-Client Trades, while the majority of DTCC volumes are Dealer-to-Dealer.
So for the first time we have public detailed trade-level granularity of pricing for D2C vs D2D for the swap market.
That has got to be of interest to lots of folks.
A topic I hope to look into on another day.
BSDR Volumes and DTCC Volumes
A few final comments on volumes.
The BSDR end-of-day cumulative files for 12 May had 208 transactions for Rates and 268 for Credit.
This compares with the DTCC file with 5,583 transactions for Rates and 627 for Credit.
Not surprising as the DTCC files contain trades from all the other SEFs as well as Off SEF Trades. In addition the DTCC file have other currencys and products (e.g. FRAs) that are not traded on BSEF.
An interesting point of note is that the BSDR file has not cancel and replace transactions; presumably because this is a rare event for a SEF. While the DTCC file has a large number of these, particularly for Off SEF trades.
Summary
Bloomberg SDR is now live and reports trades executed on Bloomberg SEF.
SDRView and SEFView allow us to see interesting aspects of this data.
For example for the first time we can see public trade level price information on Swaps between D2C and D2D.
Competition between SDRs can lead to a positive out-come for the industry.
Provided that it is possible to aggregate these SDRs, as we can do in SDRView.
We would hope that the BSDR public dissemination feed improves the real-time to less than 60 seconds.
Which encourages DTCC to also improve their real-time dissemination to less than 60 seconds.
The lower fees charged by BSDR ($5 flat fee per report) may lead to more than just BSEF reporting to BSDR.
Lets see what happens in the coming weeks and months.