Last week marked the first full week of SEF package trades. Amir Khwaja explained in his blog today how this has in fact accounted for an increase in the percent of On-SEF trades. So lets take a look at the trend in SEF activity.
First, lets look at the previous 4 weeks of SEF data.
OVERALL TRENDS
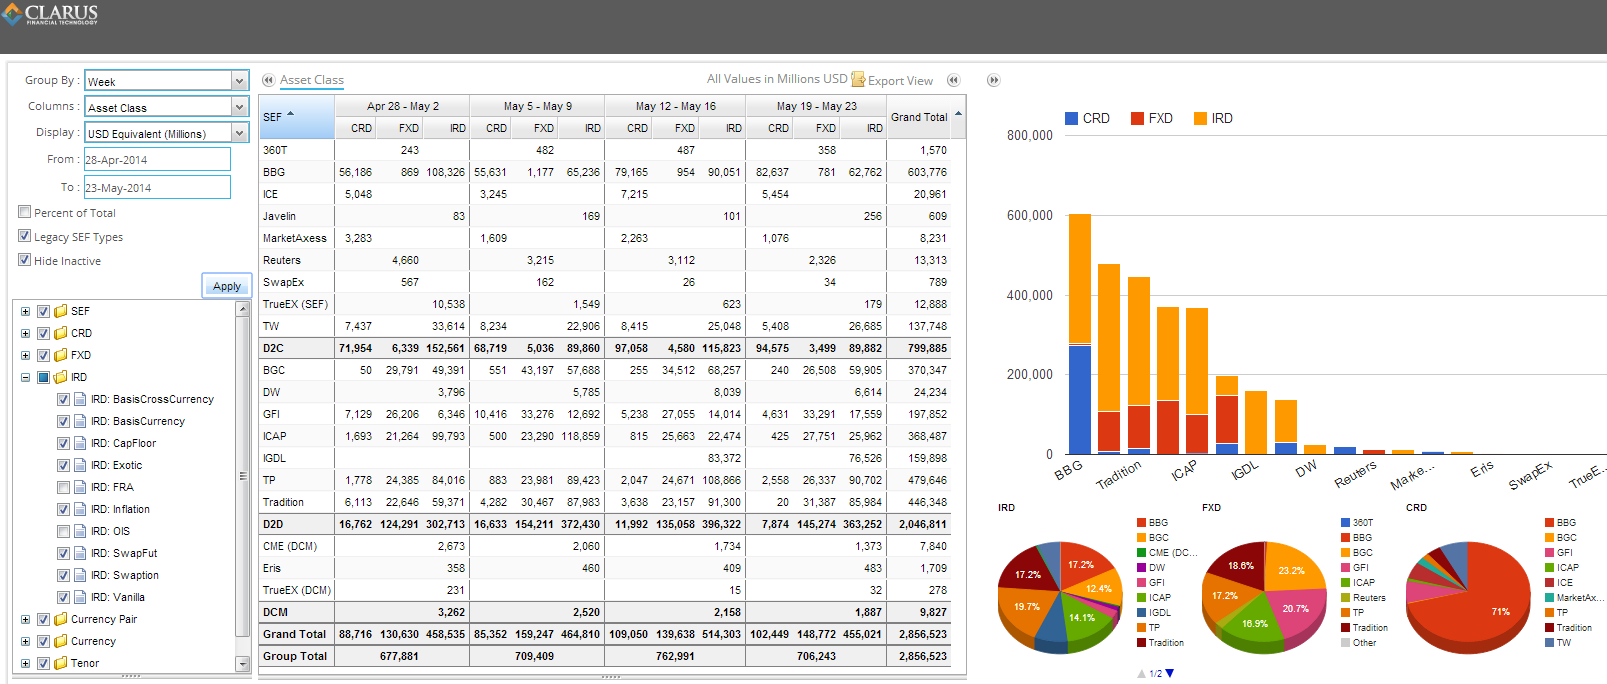
Many of the same trends are in place:
- Credit Derivatives: Bloomberg accounts for the lions share of activity, with ICE and Tradeweb posting significant activity in the client side. For interdealer, GFI continues to post good numbers.
- FX: Nearly the mirror image of Credit, with D2D accounting for well over 95% of SEF trades.
- IRD: All the IDBs, BBG and Tradeweb with activity as usual.
ALL NUMBERS ARE NOT THE SAME
Since October 2nd, we’ve been reporting gross notional values for all activity, converted to USD. The downside of this is that a 1,000,000 USD, 2-Year swap gets the same credit as a 1,000,000 USD, 30-Year swap. These two swaps have the same notional, but of course have significantly different interest rate risk/deltas, and in most brokerage conventions generate vastly different brokerage fees.
We quickly acknowledged that FRA’s were clouding the real activity, given most of them are 3 or 6 months, their risk profile is small, as is the brokerage associated with them (even when not part of a reset program). So we allowed users to exclude them, and have been reporting ex-FRA in this blog for some time. Next came OIS, again mainly short-dated instruments, and we felt best to exclude from the blog.
The other way to look at such activity is to risk-weight the activity. Using SEFView, you’re now able to report on 5 year equivalents. By using a scaling factor derived for 5YR USD swaps, this lets us include products like OIS and FRA’s. Let’s see how this impacts the numbers.
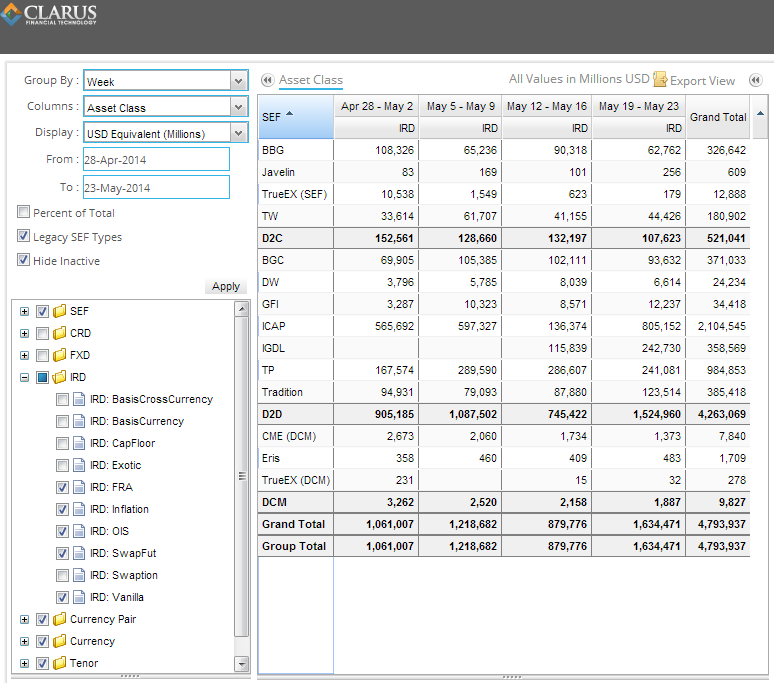
Let’s look at the IRD data for the products which lend themselves to this analysis the best:
- Vanilla Swaps
- FRA’s
- OIS
- Swap Futures (which are designed to mimic swaps)
- Inflation
For the past 4 weeks, we can see raw USD equivalent volumes of:
So lets take the same activity but look at 5YR equivalents:
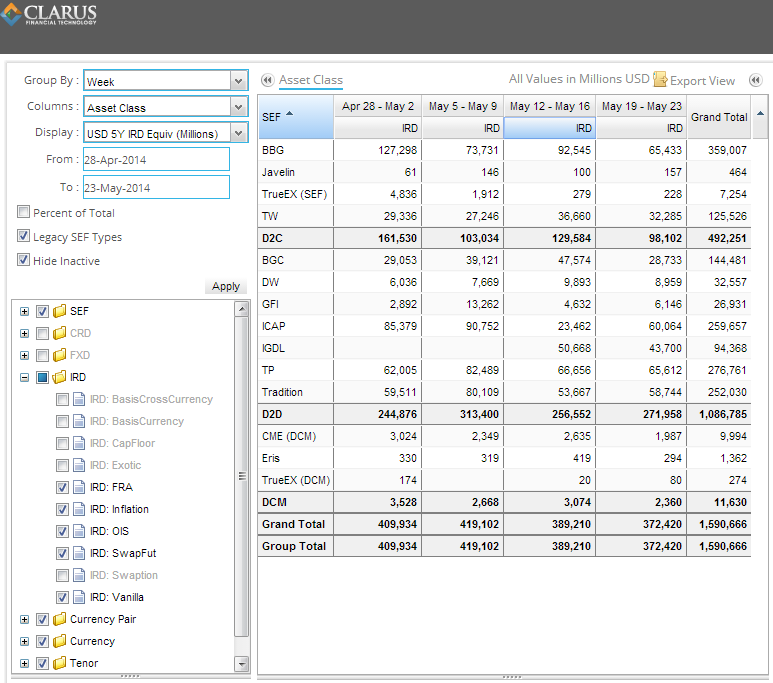
By eyeballing the two reports, you can quickly see:
- Without fail, across the IDB’s, the duration-adjusted, 5YR equivalents result in a significantly lower volume report
- For Bloomberg, the duration-adjusted, 5YR equivalents results in an increase in volume
Without drilling into the individual line items, we can conclude that Bloomberg’s activity then is largely 5YR and over, while much of the IDB activity is shorter-dated instruments.
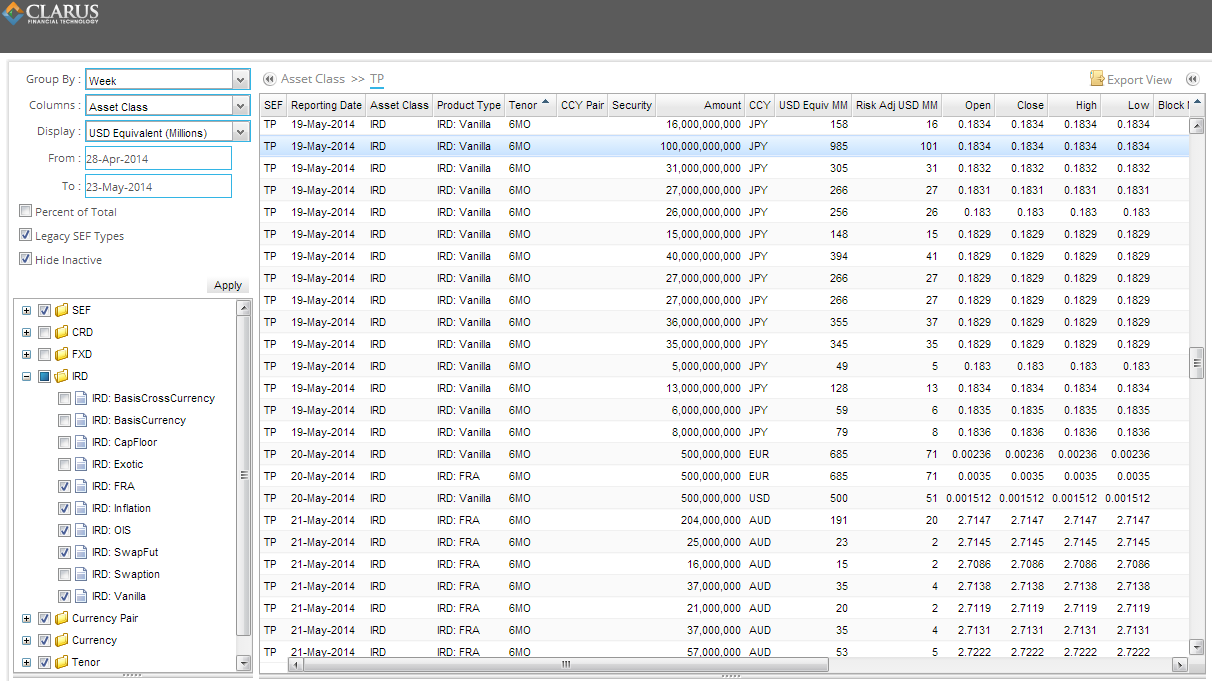
One great example of this is something I reported in a previous blog about very short-dated vanilla swaps. I can once again find many 6 month “Vanilla swaps” across the IDB’s. Cross checking this with SDR data, we can confirm these are in fact vanilla swaps, even though financially they will behave much like a 6 month FRA (assuming this is 6MO JPY LIBOR or JPY TIBOR swaps). Drilling in on some of the line items for TP this past week shows a myriad of 6MO JPY swaps. You can see for example the 100 billion JPY swap is generally reported as a 985 million USD swap, but by duration-adjusting it, it represents only 101 million dollars of 5YR risk equivalent:
SO ARE THERE ANY GLITCHES
With most of the SEF activity coming from USD, we can now use a USD duration adjustment to get a better feel for the real size of risk going through SEFs. Be warned, however that while this approach normalizes notional quantities nicely, we still fall prey to package trades and how they are reported by SEFs. But that is a topic for another day. We’re still more enlightened than we were.