Last week proved to be quite interesting for SEFs. We saw our first bit of activity from TeraExchange, Latam SEF began to post some real activity, and dare I say Bloomberg dropped to the #2 spot on the D2C list for Interest Rate swaps.
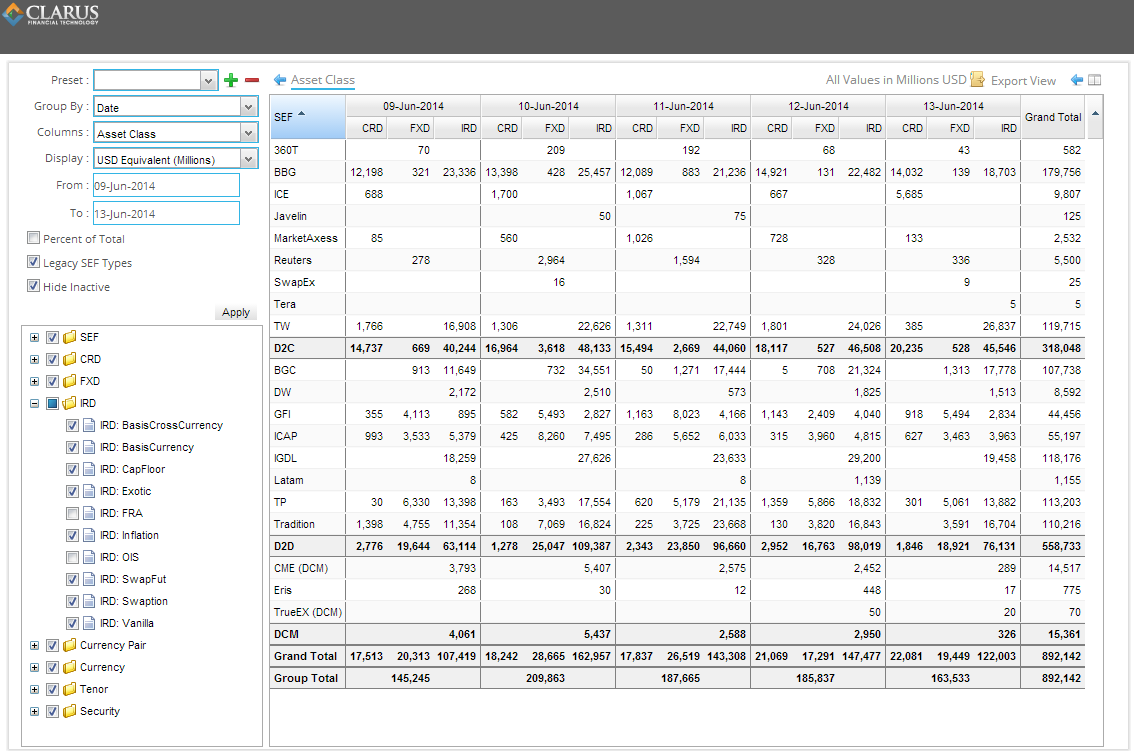
First, the data. Lets start with the usual daily activity by asset class:
WHAT’S NEW?
It may not jump off the page, but TeraExchange put through their first trade on Friday, a $5mm swap cleared at CME. Unfortunately for Bitcoin (BTC) enthusiasts, it was USD denominated (in reference to their Bitcoin swap press release). Tera offers CLOB and directed orders, so will be interesting to keep an eye on them.
While not entirely new, Latam SEF had been putting through what appeared to be a series of test trades over the past many months, and only last week began reporting some larger sizes. Their $1+ billion of activity on Thursday of last week might not look like much, but if we focus in on only the South American currencies (for which I understand they specialize), it paints a separate picture. Looking at just these currencies across vanilla interest rate swaps, we can see they leapt ahead of TP:
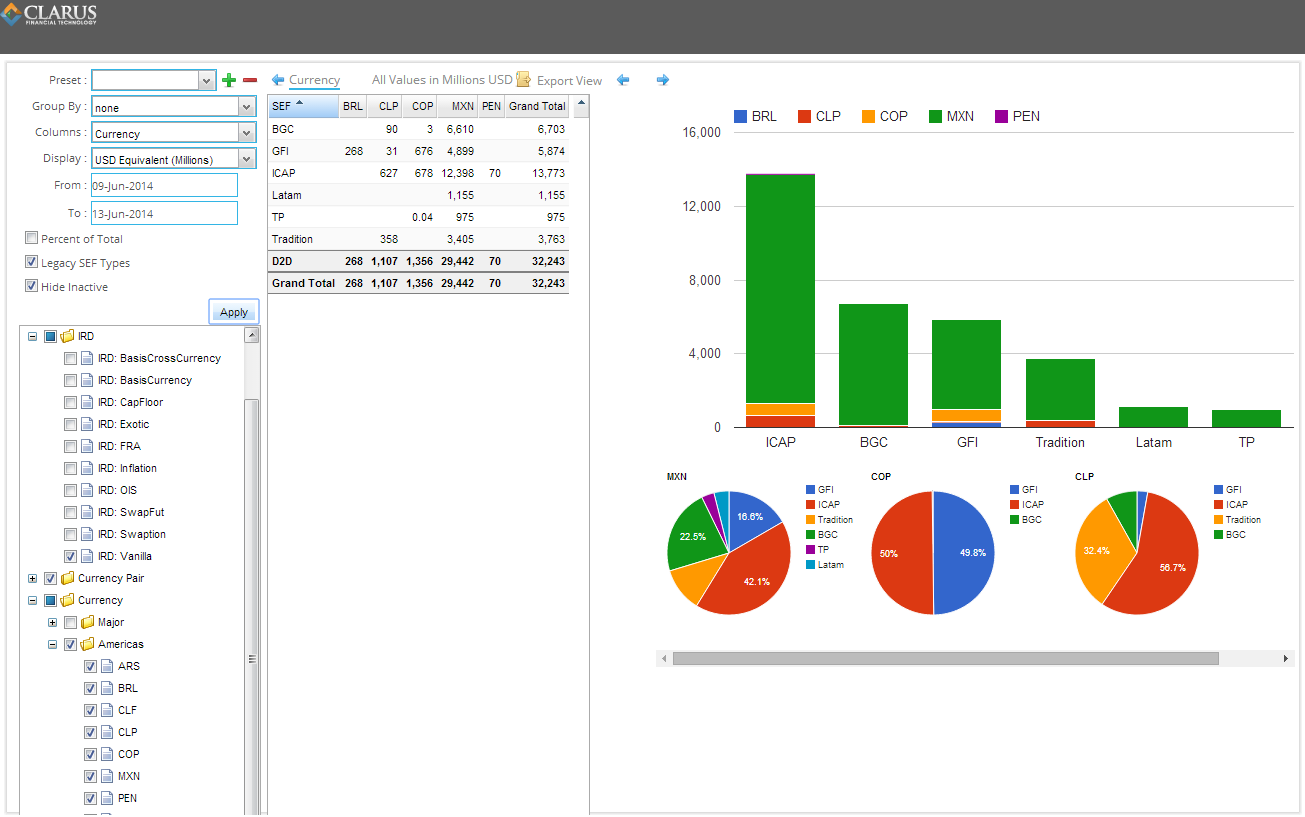
You might not notice it, but there are no “D2C” SEF’s in that view. I did not explicitly remove them – rather, it appears that all activity in Latin American currencies are on the IDBs.
THE D2C BATTLE
Perhaps the most striking news gleaned from last weeks data, however, is the performance of Tradeweb. Back in Week 25 (March), I jokingly asserted that I’d like to work in Marketing at Bloomberg “when I grow up”, however I resisted any urge to “crown” Bloomberg on their performance. The first graphic shows that Tradeweb outpaced Bloomberg on the 3 final days of the week. And if we look at the activity on a duration-adjusted basis, its even more telling:
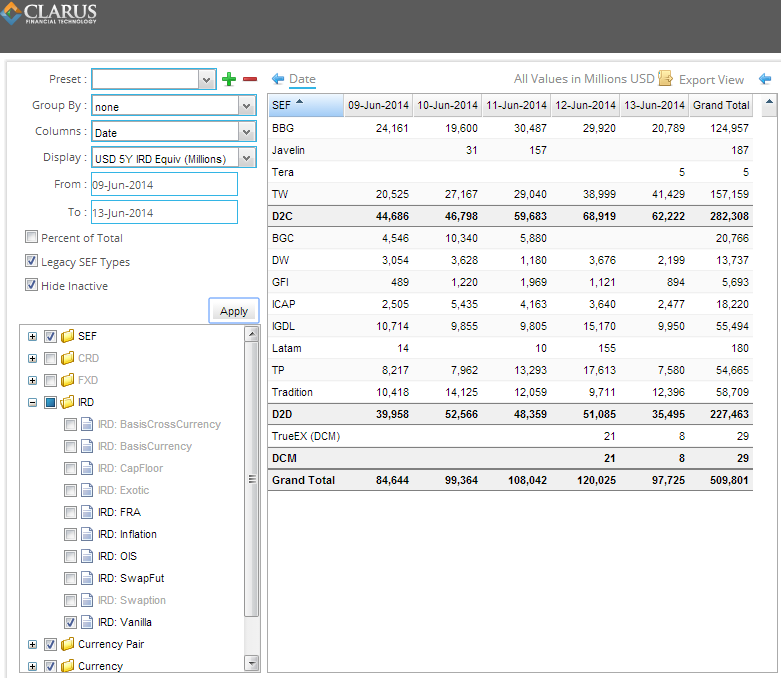
By the end of the week, Tradeweb had put through the largest total (5YR duration-adjusted) flow. In fact on Friday, they reported 100% larger activity than Bloomberg. Is this due to the end of package trade relief, long overdue adoption by the buyside, or just a blip in the data?
MACRO TREND
I’ll leave you with a couple time series to digest. I typically post a 5 week summary across the 3 asset classes, however let’s set aside FX and Credit for this week, and instead look at the past 15 weeks of data in Interest Rate Derivatives. For consistency, we’ll keep FRA’s and OIS out of the equation.
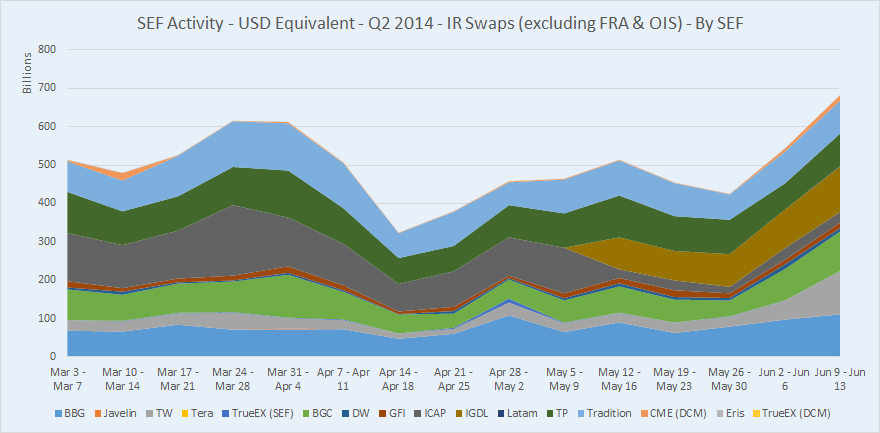
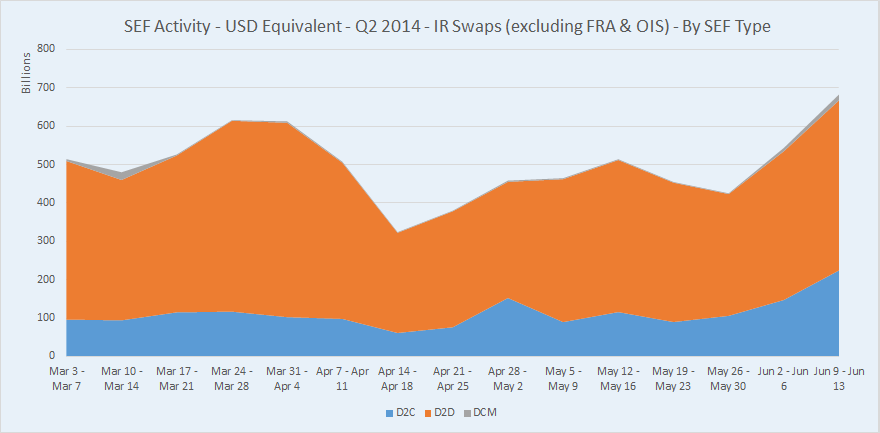
First, on the overall shape of the graphs, we did indeed see the highest total IRD activity of Q2 last week. Only word of caution here is that there would have been significant activity related to IMM swap rolls. That aside, we might observe a positive recent trend since the packaged trade relief has rolled off, and note quite easily Tradeweb’s performance (Grey in the first graph).
The second graph, by SEF Type, shows only what we might guess is buyside adoption (steep slope of the blue area). Looks like it may just be starting to happen.