In April I covered Securities Finance Transaction Reporting (SFTR) and ended that article by stating that I would check back end July for the first set of public reports from Trade Repositories.
As there are four authorized Trade Repositories (DTCC, Regis-TR, UnaVista and KDPW), I had expected to look for the weekly data files published by each of these TRS and aggregate these to produce a summary.
ICMA
Luckily the good folks at ICMA, the International Capital Markets Association, have started collecting, aggregating and tabulating this data each week and committed to providing regular analysis, charts and commentary. This can be found at the ICMA SFTR Public Data page.
Each Wednesday, ICMA publishes an Excel Workbook with tables and charts based on the data published by the TRs on Tuesday’s for the prior week and so far there are two of these workbooks available.
What Does the Data Show?
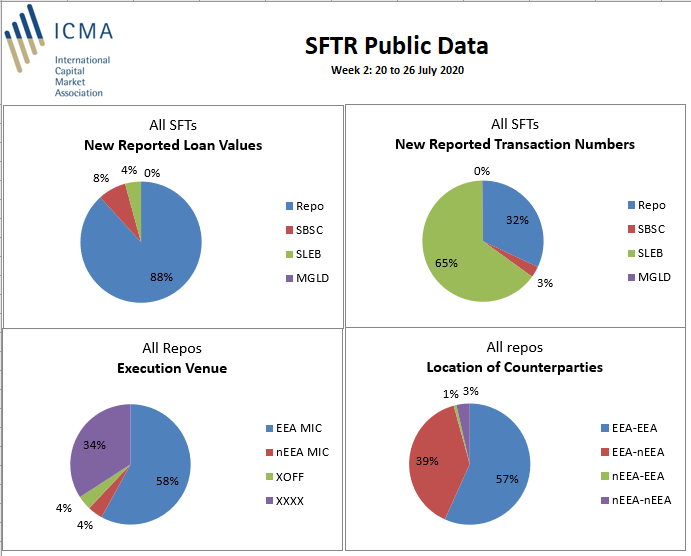
Let’s take a look at some of the numbers for Week 2, July 20-26, 2020 in the Public-Data-240720 workbook.
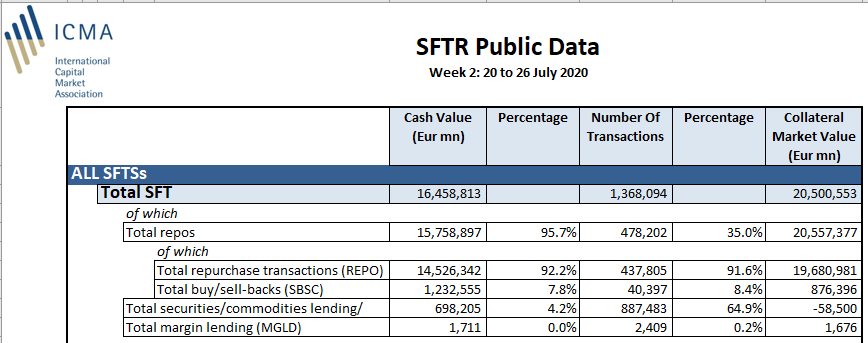
- Showing €16.5 trillion of securities finance transactions in the week of 20 to 26 July 2020.
- To put this into context in the same week, US Treasury volume reported to FINRA-TRACE was $1.9 trillion, global cleared Swaps volume in all currencies (including FRAs) was $8.3 trillion and IR Futures volume (for the 8 major exchanges we track) was $11.8 trillion.
- Repo is the largest with €15.75 trillion of which €1.25 trillion is of buy/sell-back type and €14.5 trillion or 92% is repo type.
- There were 478,202 total repo transactions in the week, implying an average transaction size of €33 million.
- The €14.5 trillion cash value of Repos represented €19.7 trillion of collateral market value, a ratio of 1.30, higher than I would have expected; suggesting a higher haircut due to the risk of the collateral or the period of the repo or an error in the data or my lack of understanding of repos?
- Securities lending is much smaller than Repo with €700 billion of transactions in the week, but with more transactions at 887,483; an average size of €800,000, a very different market size to Repo.
Next a table focusing only on Repo.
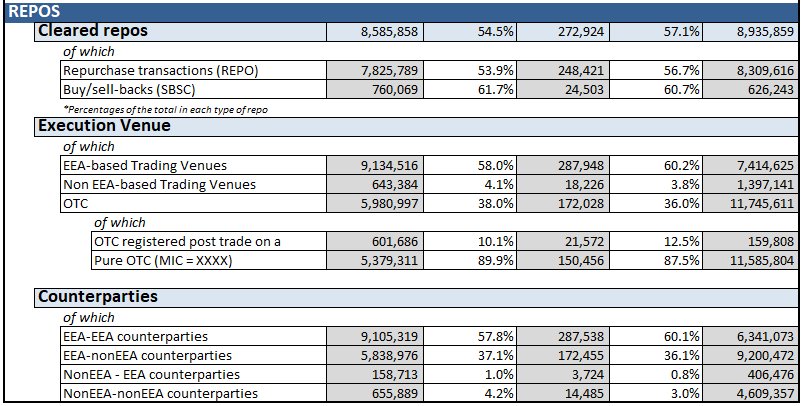
- Cleared Repo at €8.6 trillion cash value is 54.5% of overall repo and the ratio of collateral market value to cash value is 1.04; more like the haircut I would have expected.
- (Either the Cleared Repo market is used for higher rated Bonds (Sovereigns) and shorter-dated than the Non-Cleared market or there is some issue in the Non-Cleared data, which would be understandable given it is early days in public reporting.)
- Execution Venues that are EEA-based represented €9.1 trillion of 58% volume, a higher amount than Cleared, suggesting that Non-Cleared also trades on Execution Venues.
- (Note the ICMA press release says that not all of the volume on Execution Venues is electronic).
- Counterparties section shows that 57.8% of volume is between EEA counterparties and the rest between EEA and non-EEA, with only 4.2% between non-EEA counterparties.
The same table above is also provided for Outstanding Positions for Week 2, but I won’t re-produce this below. Please download the in the Public-Data-240720 workbook to see for yourself.
I will note that Outstanding position cash value of Total Repo on 26 July was €8.5 trillion an increase from the €7.96 trillion on 19 July. Given the €15.75 trillion of volume in the week of 20-26 July, this shows that the outstanding stock is turned over twice in a week, commensurate with a large share of 1-day and 1-week transactions.
That’s it for a quick look at the data.
Some interesting high level statistics on the European Securities Lending market in terms of:
- volume and outstanding notional
- product type (repo, buy/sell back, sec lending, margin lending)
- cleared vs non-cleared
- on execution venue vs off venue
- EEA counterparts or non-EEA counterparts.
However it still leaves me wanting to know more.
ICMA Survey
To understand what other statistics would be interesting, a good place to start is the ICMA semi-annual European Repo Market Survey, the most recent was published in April 2020 and conducted December 2019.
In particular this shows:
- Currency breakdowns – EUR 54%, GBP 14%, USD 19% ….
- Collateral breakdowns by Country – Germany 13.5%, Italy 14.1%, France 12.9%, …
- Collateral breakdowns by Rating – AAA 25.7%, AA 32.6%, A 14%, …
- Maturity breakdowns – Open, 1-day, 1-week, 1-month, ….
Final Thoughts
I am sure similar tables to the ICMA Survey tables for Currency, Collateral and Maturity analysis could be produced from SFTR data. (As the underlying transaction data is being reported to TRs).
It is a shame that SFTR has not made this public on a weekly basis
It would certainly help transparency.
At least we have the start of SFTR public data.
And an established point from which to ask for improved transparency.
To keep on eye on the data, please check SFTR Public Data.