I last looked at Average and Term SOFR Volumes and Term SOFR and BSBY Volumes in early February 2023, focusing on 2022 volumes, so today I wanted to look at the 2023 data trends for these reference indices.
As before we will seperate Term SOFR (published by CME) from Average SOFR (NY Fed), see the first blog above for the details on these. While details on BSBY, the Bloomberg Short-Term Bank Yield Index, are here.
A one-sentence summary is that “Term SOFR trading volumes are far higher than either Average SOFR or BSBY and one to keep an eye one in 2023 as trending higher than a year earlier.”
Swap Volumes for Term SOFR
In SDRView, I can group USD FixedFloat Swaps by the Reference Index of the floating leg and export this data to create an Excel PivotChart, selecting only those with names that look like Term SOFR rates ( a long list).
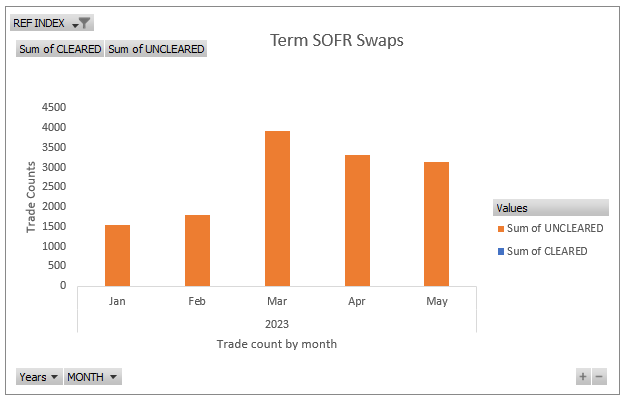
March, April and May each with > 3,000 trades, significantly up from the 1,500 in Jan 2023.
March 2023 with 3,900 trades is up 4X from March 2022 with 960 trades.
In gross notional terms, March with >$94 billion, while April and May each with >$67 billion.
So, respectable volumes in Term SOFR Swaps, with trends on the up.
Swap Volumes for Average SOFR
Let’s now repeat the above, but for reference indices that look like Average SOFR.
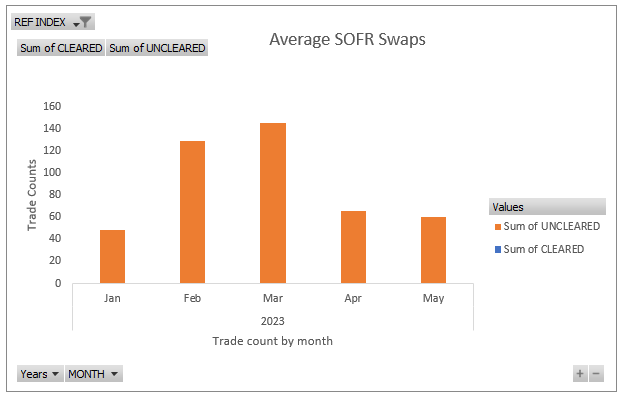
March with a high of 146 trades, but April and May down by over half, with 66 trades in April.
In gross notional terms March with > $850 million, so less than 1% of the Term SOFR volume.
Swap Volumes for BSBY
Let’s now repeat the above, but for reference indices that are BSBY.
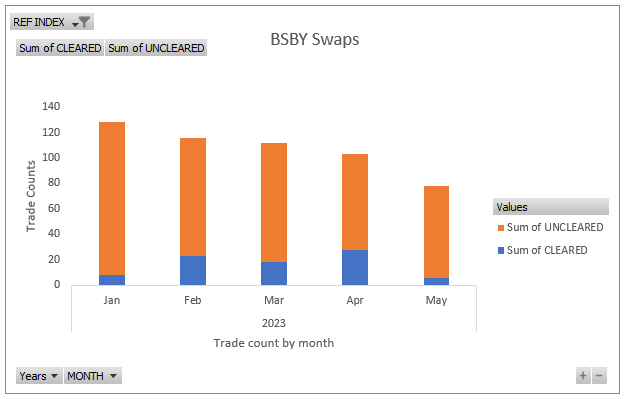
This time we see both Cleared and Uncleared trades, but low volumes, similar to those for Average SOFR.
Cleared Swaps trade counts a high of 28 in April, while Uncleared a high of 120 in January, though trends for both look down. Overall volumes at $1billion or less each month, so again less than 1% of Term SOFR.
Basis Swap Volumes – Term SOFR vs SOFR
Next Basis Swaps, primarily Term SOFR vs SOFR and a smaller number of Term SOFR vs Libor.
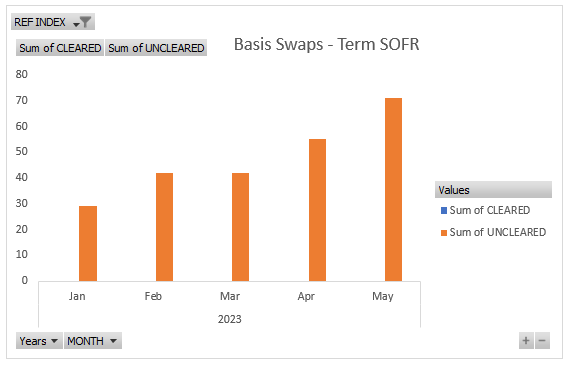
February with 42 trades, May with 71, an upward looking trend.
One to watch given the possible concern about build-up of basis risk between SOFR and Term SOFR positions.
CapFloor Volumes for Term SOFR
Finally let’s switch to CapsFloors that reference Term SOFR.
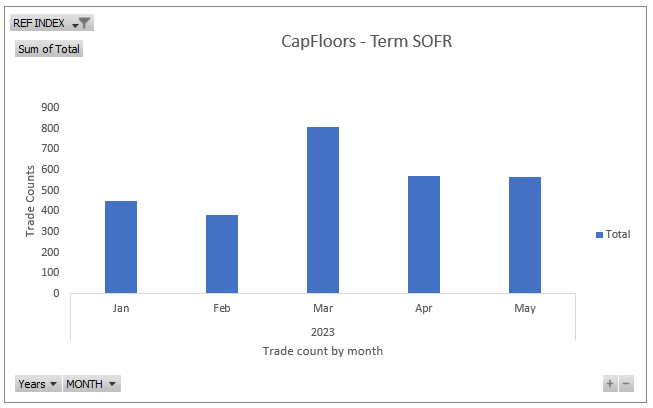
March with a high of 800 trades, April and May each with 570 trades.
(Gross notional, not shown is in the $40 to $80 billion range each month).
While Average SOFR volumes (not shown) are between 30-60 trades a month and around $1 billion.
CapsFloors on Overnight SOFR are between 400-500 trades or $100-$190 billion notional a month.
That’s all I have time for today.
If you are interested in this data, please contact us for an SDRView demo.