- Clarus data for August 2020 shows a big increase in 30Y traded volumes in Rates products.
- This was specifically in USTs and exchange traded derivatives.
- Long-dated OTC derivatives did not see the same increase.
- The 20Y and 30Y US Treasury auctions, as part of the quarterly refunding cycle, were clear drivers of this volume.
- However, the data shows that this supply could not be recycled into OTC markets.
The hardest part of being on vacation is coming back into the office. Trying to work out what has happened since you’ve been away can be hard.
For me, the last thing I did (quite literally) before packing up for vacation was to finalise the ISDA-Clarus RFR Adoption Indicator for July 2020. That report provided me with a pretty good overview of what happened in RFR markets.
However, I now need to know what has happened in the (much larger) Rates markets upon my return.
This is why CCPView is my first port of call after any time out of the office. It now covers the whole USD Rates market – UST cash bonds, Futures and OTC Swaps. If anything of particular interest happened, I am bound to spot it there.
Notional Volumes Traded
With a single query, I can see what has traded in which tenors across the whole of the USD Rates complex:
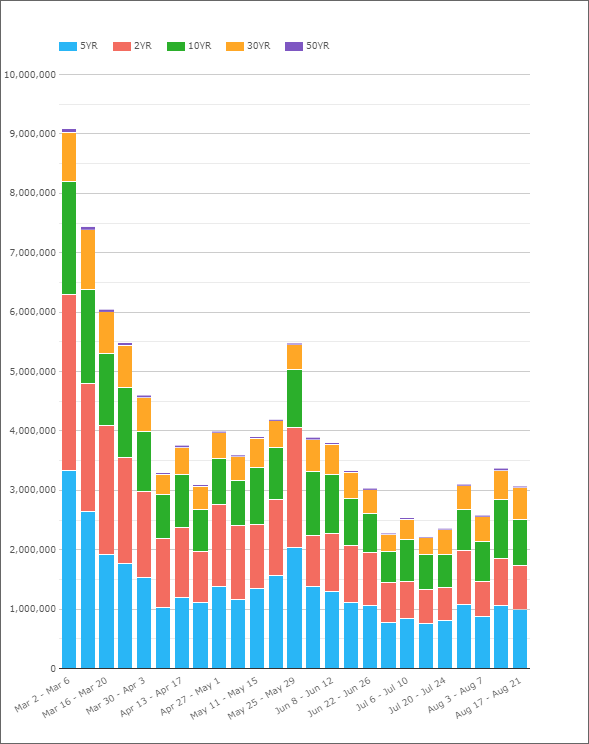
Showing;
- August has been a busy month in USD Rates space.
- 3 of the past 4 weeks have seen combined notional amounts in excess of $3trn.
- This is the first time since June that volumes have been as high.
- July had really low volumes compared to the rest of the year.
Yields
Looking at the relative volumes, I was expecting August 2020 to see some wilder price swings than we saw the previous month. July saw an almost uninterrupted move lower in yields, from 0.65% to 0.5% in ten year USD swaps. This is shown in the USSW10 chart below:
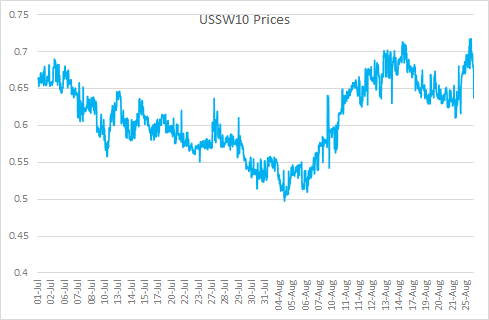
August 2020 has reversed that move completely, and seen trades over 0.71%. However, the range of prices was not that different, both trading in a roughly 20 basis point range.
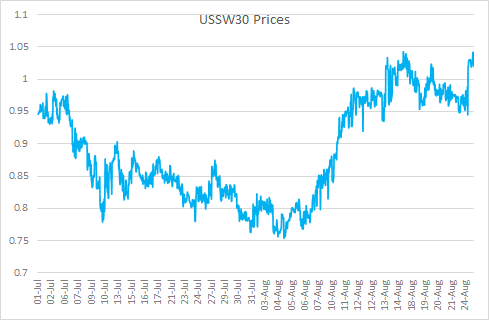
However, 30Y prices have traded in a larger range in August, increasing by over 30 basis points:
That naturally got me thinking about DV01 volumes in August. Has the amount of risk traded in 30Y increased significantly this month?
DV01 Traded
The chart below shows the volumes traded across all maturities in the USD Rates complex, calculated in DV01 terms:
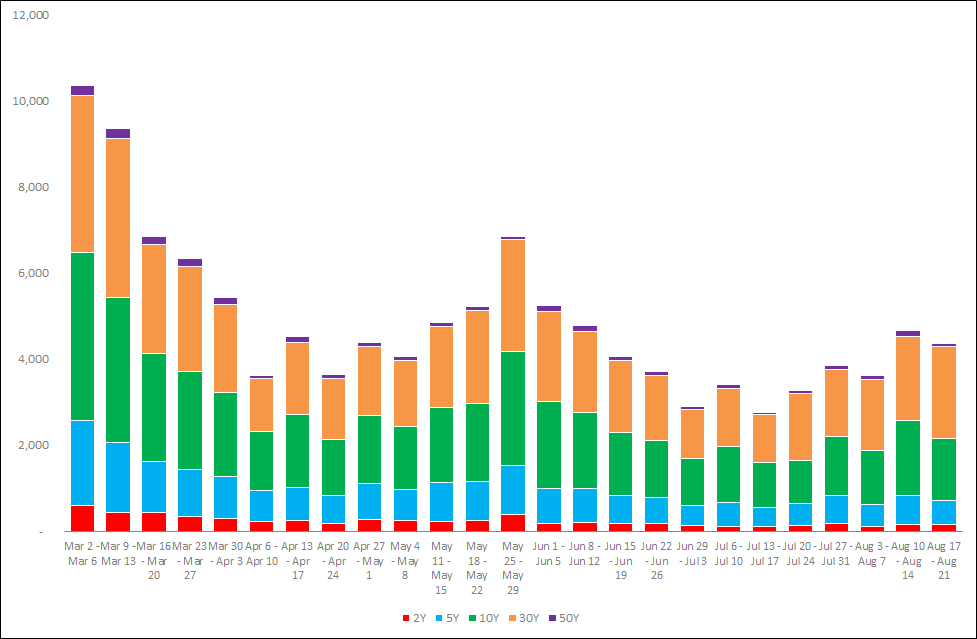
Showing;
- The most recent two weeks of August have seen $4.7bn and $4.4bn of DV01 transacted.
- This is way higher than the lows we reached in July, when just $2.8bn DV01 was trading each week.
- Compared to July, the increase in trading activity has certainly come from the 30Y tenor.
- The last two weeks, for example, have seen 47% more activity in the 30Y than back in July.
- Specifically, there has been $650m extra of 30Y DV01 traded each week compared to the July average.
- Worthy to note that 50Y maturities also saw 41% more activity than in July, although this represents only $31m more DV01 transacted.
30Y by Product
Now that we have seen the increase lies mainly in the 30Y tenor, let’s take a look at which products have specifically benefited from this increase in activity.
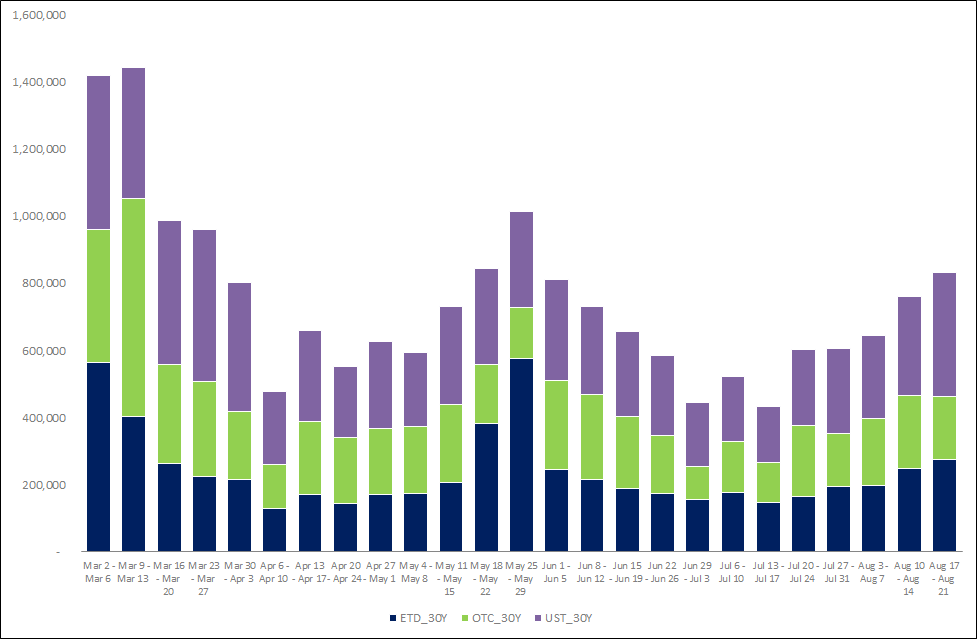
This chart was quite a shock to me:
- 30Y OTC markets (i.e. swaps) have seen far smaller growth than either cash USTs or exchange traded futures (ETDs).
- In the case of ETDs, the volumes come from the CME’s Ultra T-Bond, UB (~25Y) and the T-Bond, ZB (~15Y); see contract specs here.
- However, even with an increase of $91m DV01 traded per week, the ETD contracts are not the biggest benefactors from this increase in activity.
- Cash USTs have seen a 57% increase in activity, with the amount of DV01 traded increasing by $120m per week compared to July levels.
- Last week alone saw $370m DV01 trade in 30Y USTs.
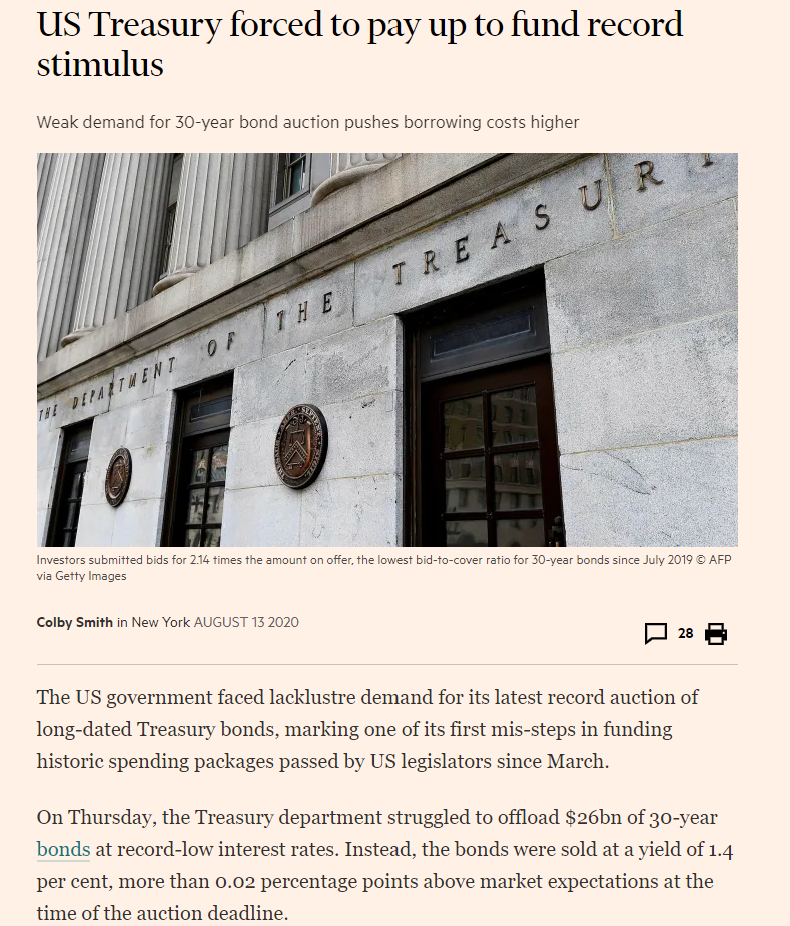
August Quarterly Refunding
This increase in activity, specifically in long-dated USTs, was surely related to the record long-dated bond sales we saw from the US government. There was $26bn auctioned in 30Y Bonds on August 13th and $25bn in 20Y Bonds on August 19th.
The 30Y, in particular, seemed to meet weak demand from reports.
The 20Y seemed to go a little better, with a bid-to-cover ratio of 2.26 according to the results page, although the overall metrics were apparently worse than the previous 20Y auction in May.
Overall, the theme seems to be that the market is potentially struggling to digest so much long-dated supply. From the volume data, it suggests that it hasn’t been possible to offset the risk into OTC markets in particular.
In Summary
- The big news from August in USD Rates markets was the huge amount of long-dated supply from the US Government in 20Y and 30Y USTs.
- This had a significant impact on volumes traded, with 30Y maturities seeing 47% more activity than back in July.
- Volume data shows that OTC markets were not much help in digesting this risk, where volumes did not increase anywhere near as much as in cash bonds and exchange traded products.
- CCPView provides an overview of volumes traded across the whole of the USD Rates market, covering OTC derivatives, ETD futures and UST cash bonds.