- Post-trade transparency in US Treasuries has arrived.
- CCPView now includes volumes across US Treasuries, Futures and Swaps.
- This reveals that the true size of the Rates market in the US is $12.5 Trillion per week in notional equivalents for medium and long-dated interest rate products.
- We can also monitor the split of trading across different asset classes.
- The analysis can be performed across different maturities and product types.
Total Market Size in US Rates
Something I have wanted to do many times in the past is paint a true picture of volumes across the entire USD Rates complex. That involves volume data on:
- Swaps
- Futures
- Cash bonds
I’ve tried previously with a couple of old blogs, such as:
However, that analysis has only been conducted on an ad-hoc basis and we’ve never been able to monitor the trends over time or on a more granular basis (e.g. by maturity, product type).
All that changes now that we have added US Treasury data into CCPView.
This data reveals the total size of the USD Rates market. It shows that total notional amounts traded in medium and long-dated products reached $12.5 Trillion in a single week during March 2020.
USTs vs Futures vs Swaps
Finally, the chart I’ve wanted to create all along is a single click away in CCPView (it’s saved as preset “USD Long Rates” for our users):
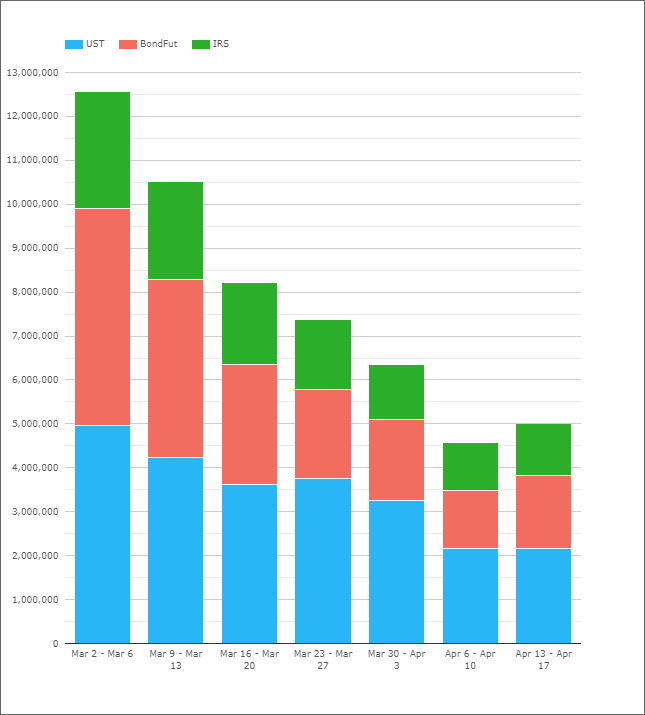
Showing;
- Turnover data for the three asset classes.
- Specifically, the chart shows weekly USD-notional amounts of cash US Treasuries, Bond Futures and OTC swaps.
- This chart focuses on the longer-than-2 year exposures, so excludes STIR money market futures, OIS, FRAs and US Treasury Bills.
- We find that OTC swaps consistently account for 21-23% of overall volumes. That is less than I expected.
- Strangely, this means that total volumes across USTs and Bond Futures are therefore pretty consistent, suggesting volumes are inversely related. Bizarre.
- USTs have accounted for between 40% and 51% of total volumes.
- Bond Futures have accounted for between 27% and 39%.
- Total weekly volumes have reduced from $12.5Trn to just $5Trn in the most recent week. It will be interesting to follow this over a longer time period.
Volumes in the 10Y Sector
Having this data in CCPView allows us to drill-down on different parts of the curve. For example, if we look at maturities from 7Y-10Y (so that we get both of the CME’s Ultra 10 and 10-Year Note future volumes) we can see that IRS markets are surprisingly small:
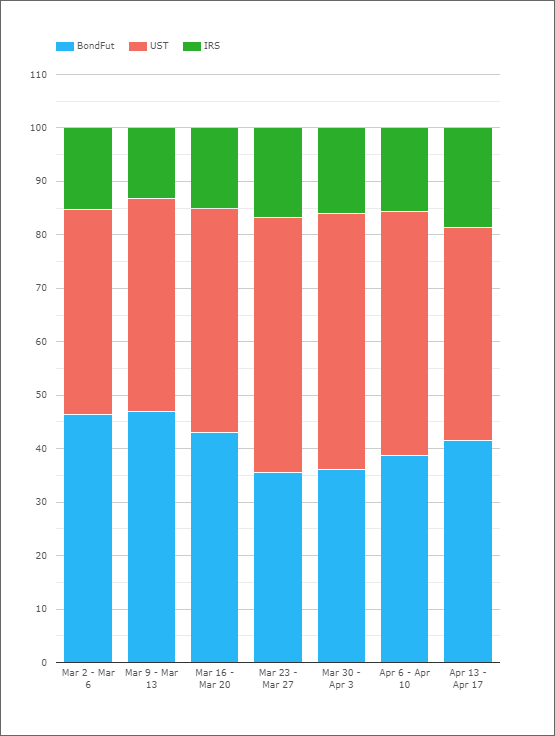
Showing;
- Swaps only account for 15% of volumes in the 10Y area of the curve.
- By comparison, USTs are, on average, 2.75 times larger than Swaps.
- Bond futures and USTs, as we have found, tend to complement each other so that their overall share is consistently 85% of volumes.
- This means that Bond Futures, on average, are also 2.65 times larger than Swaps.
Because this is based on Turnover data, it may simply be that the presence of high frequency traders in Futures and USTs skew these figures somewhat. The same “packet of risk” is passed around multiple market participants in Futures and USTs before finding a home with an end-user. Or it could be that liquidity (or market access, or number of participants, or ease of trading) is much higher in Futures and USTs.
That is something to ponder in future blogs.
Inflation Volumes
I also wanted to take a look at our other USD volumes – such as Inflation products:
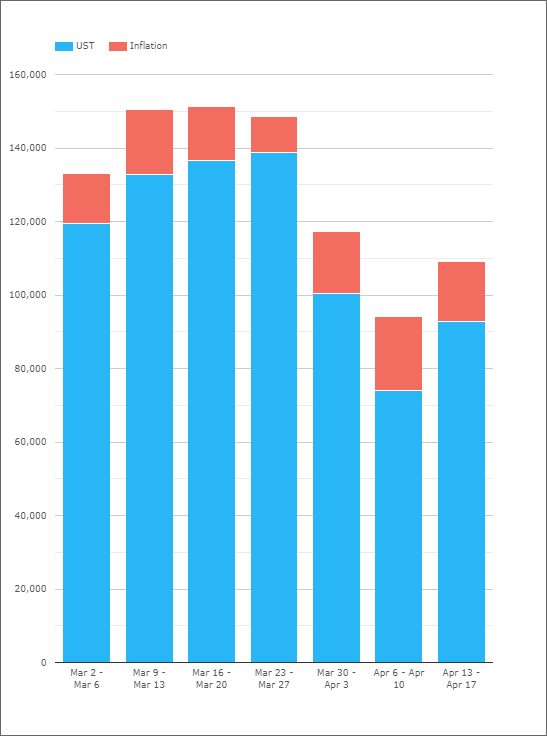
Showing;
- A comparison of turnover volumes in US TIPs and Inflation Swaps.
- The size of the Inflation swap market in the US is pretty small compared to the cash market.
- Swaps account for 10-20% of total volumes each week.
Short-Dated Volumes
Our users can now go ahead and compare all sorts of short-dated products, including:
- STIR futures: Eurodollars, Fed Funds, SOFR.
- STIR OTC: FRAs, OIS, single period swaps, OTC up to 2 years.
- Bond Futures: CME 2Y Note contract.
- Cash bonds: Bills, 2Y notes.
A quick comparison of a sub-set of these shows just how huge STIR futures contracts are:
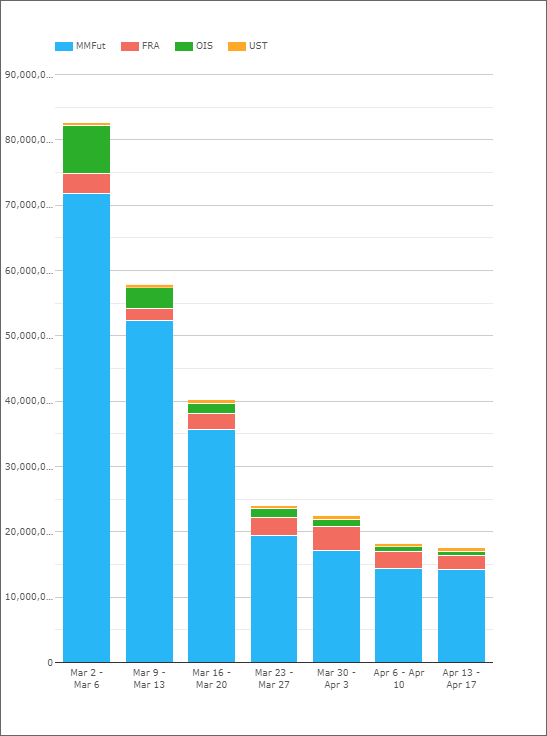
Showing;
- STIRs futures account for up to 90% of turnover each week!
- It is amazing to think we normally exclude FRA volumes from our OTC statistics because they “skew” the data, and yet they remain tiny compared to the futures market.
Previous Blogs
In a previous blog, I noted that Swaps and USD Futures tended to be a similar size. That was based on a DV01 analysis across the whole curve. That will be something we look to replicate in future analysis here.
In Summary
- Thanks to post-trade transparency, we can now present weekly volumes across bonds, futures and swaps in US Rates markets.
- Our first look at the data shows that notional volumes across all of these products can reach $12.5 trillion. And that ignores short-dated products!
- This has been analysis that we have been trying to perform for a long-time and it is highly rewarding to be able to finally present the data all in one place – CCPView.
- Access to CCPView is available via an annual subscription, with volume data covering cleared Rates, Credit and FX OTC products, as well as ETD (Futures) and US Treasuries.