Sometimes the most simple questions are the most incisive. Having spent some time looking at the SDR data through the prism of the SDRView API, let’s take the time to lay down some simple descriptive statistics for the USD IR Swaps markets.
What time do USD Swaps Open?
The chart below makes it pretty clear:
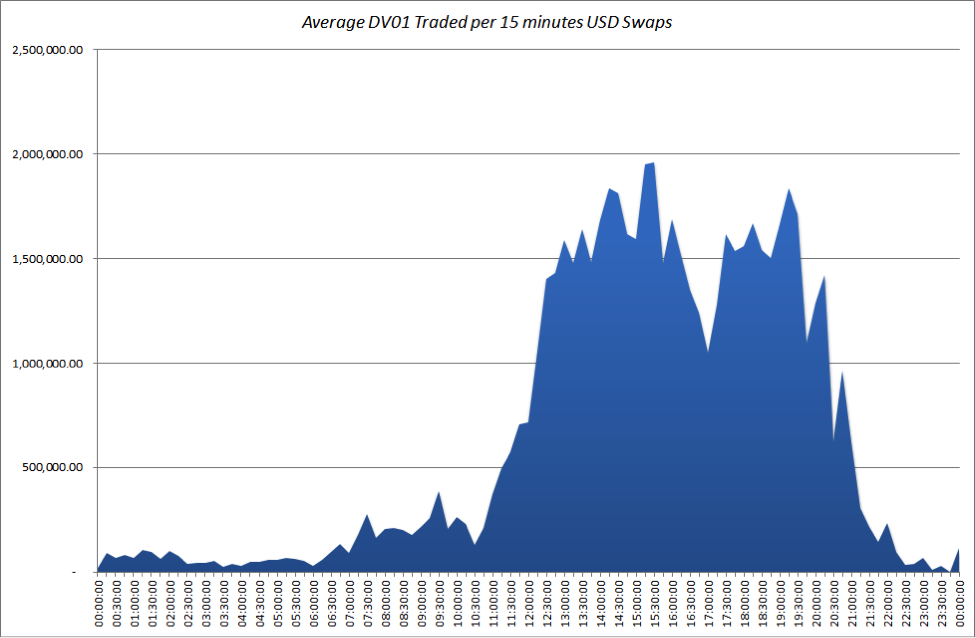
- Open: 11:00 GMT
What time do USD Swaps Close?
- Close: 21:00 GMT
We can back-up the idea of this 10 hour trading day by looking through the summary stats a little bit further.
When do USD Swaps trade the most?
We see that 93% of total risk traded occurs between the hours of 11:00 and 21:00. However, identifying a peak time during the day is more complicated, with peak 15 minute periods occurring at (pretty much) any time during the 10 hour window.
What is the size of the USD Swaps Market?
Over our sample period, $1.4bn DV01 traded. If we consider a 24 hour trading period:
- Average DV01 traded per day: $58.1m
- Average DV01 traded in a 15 minute window: $599k
Narrowing this to just the 11:00-21:00 window reveals:
- Average DV01 between Open and Close: $54.0m
- Average DV01 traded in a 15 minute window: $1.3m
What Maturities Trade the most?
We have looked at this in the past, and we continue to see the benchmark tenors – 5y, 10y and 30y – dominate trading:
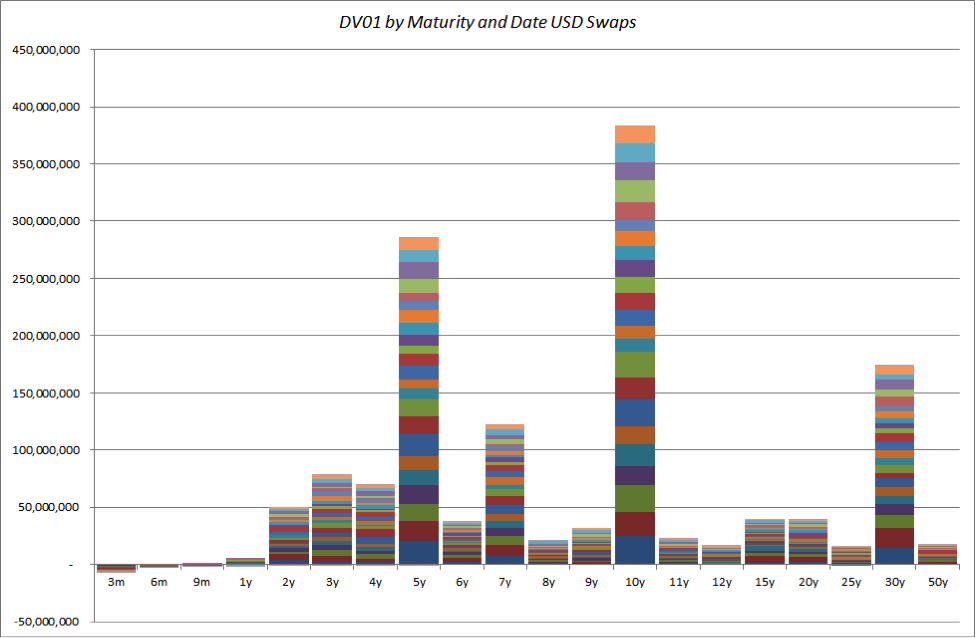
Which shows:
- 10y was the most traded maturity in 23 out of 25 sessions
- 5y is consistently the second most traded maturity
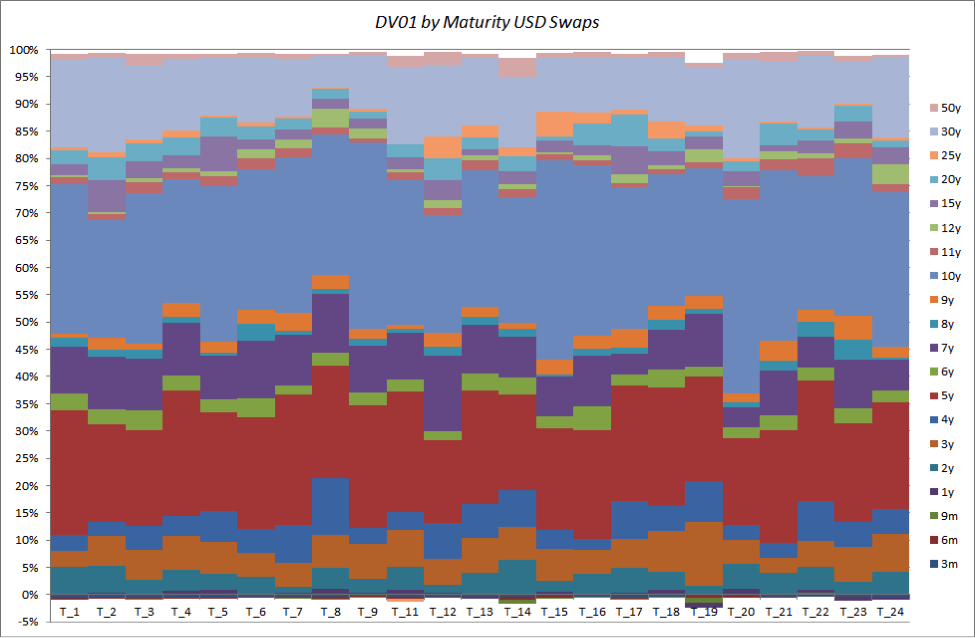
If we switch the chart to look at the percentages traded each session by maturity, we can clearly see this stand-out feature, with 10y, 5y and (to a lesser extent) 30y dominating trading activity by size:
What day of the month is busiest in USD Swaps?
Looking at the contribution of DV01 per session to the overall total DV01, it is somewhat surprising that we do not see any pattern of month-end hedging or time-based trading relative to economic releases and/or market activity. Over the 25 session sample period, we cannot discern a particular pattern:
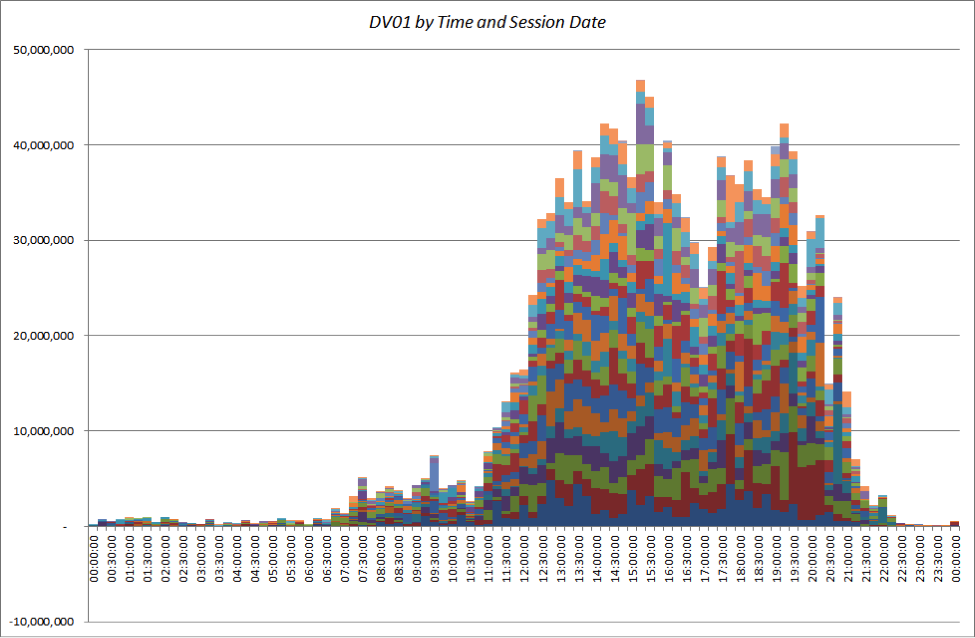
If we drill-down on the trading day and focus on the 11:00-21:00 window and switch to the percentage traded, finding a pattern remains elusive:
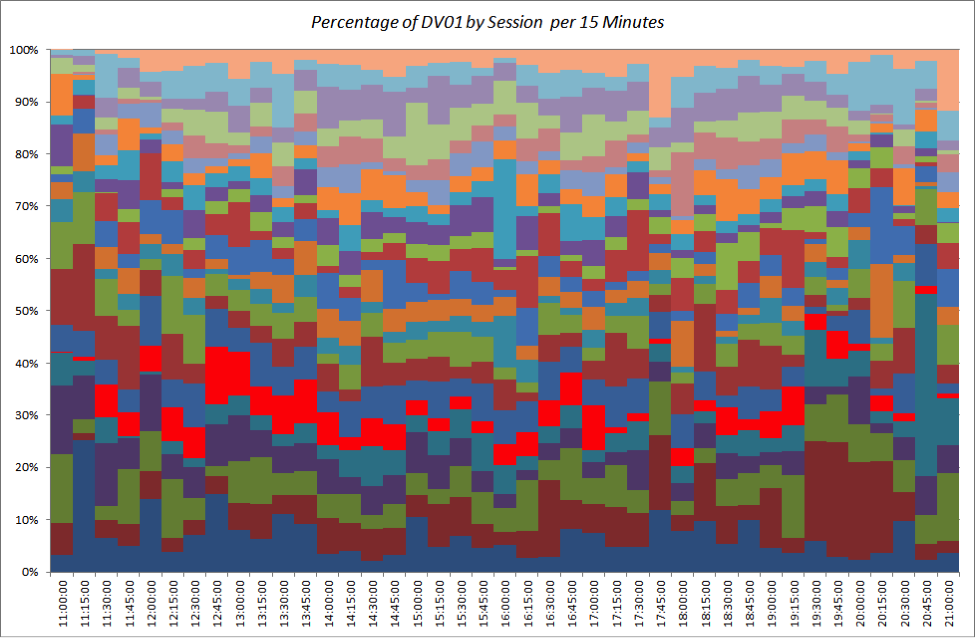
Non-Farm Payrolls and USD Swaps
In the above chart, the data points from September 5th (the only Non-Farm Payroll day covered in our sample) have been highlighted in red. There is little evidence of significant trading around the number (13:30 GMT release time).
What time of day are 10 Year USD Swaps most liquid?
Finally, we can combine all of the above data to drill down on the maturity split by DV01 during each and every 15 minute window. Again, if we focus on just the 10-hour trading day and look at the percentages of risk that are traded:
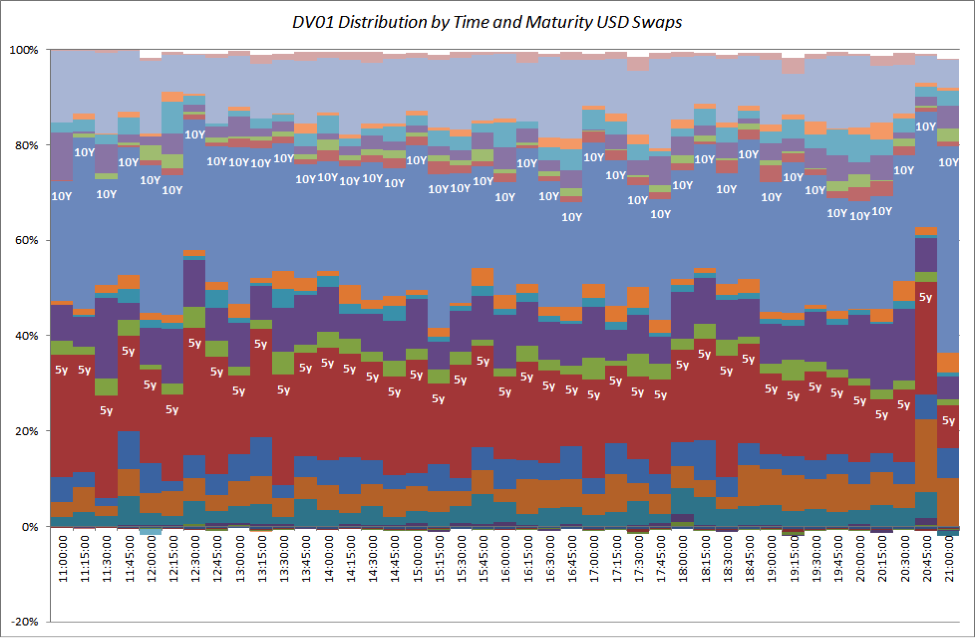
The most striking facet is the concentration and heterogeneity of the time periods. Over the ten hour trading day, the below averages are surprisingly consistent across the trading day:
- 27.2% of the risk traded is in 5y
- 27% of the risk is 10y
- 13% of the risk is 30y
In Summary
We can answer some simple questions with ease – opening times, closing times, average sizes and distribution of risk.
However, it is insufficient to look at a limited data set to make intelligent judgements regarding liquidity opportunities surrounding specific market events.
One thing is for sure on that front – the data set will continue to expand, allowing us to continue updating the analysis and monitor for any changes in market structure.