SDRView now includes DV01 data for USD Swaps. This can be seen in SDRView Researcher, and also in SDRView Pro via both the Web application and the API. I have been using the API to access the data through Excel, and over the course of the past week I’ve been exploring the concept of a liquidity monitor.
What’s A Liquidity Monitor?
Let me explain by highlighting one of the frustrations with the SDR data. As we’ve said before (and many dealers will agree), the Interest Rate Swap market is not well served by looking at notional traded. A lot of the reported swaps do not represent a new risk position, but relate to portfolio maintenance. Market participants tend to be more interested in net positions, as well as looking at daily turnover rather than simply summing-up all amounts ever traded.
This is further compounded by the current vogue for “list” trading. Given the huge number of seasoned swaps that are currently being reported, it is an uphill battle to find a clean set of swaps to enable us to engage with the data. Fortunately, the Clarus product suite includes many different ways to filter and cleanse the data.
Excel API
Therefore, let’s distill our trade Universe a little bit (depending on the day, by quite a lot!). Using the API in Excel, I can run very specific queries and hence only consider:
- USD swaps
- Spot starting
- On-SEF
I consider this the “cleanest” data-set of all markets. It provides us with a trade Universe that includes only new price-forming transactions. These swaps are either initiating new positions, or hedging related positions.
Now let’s look at the DV01 traded within 15 minute windows for these swaps for a specific trading day. Taking November 25th (the most active day in my sample period) as an example:
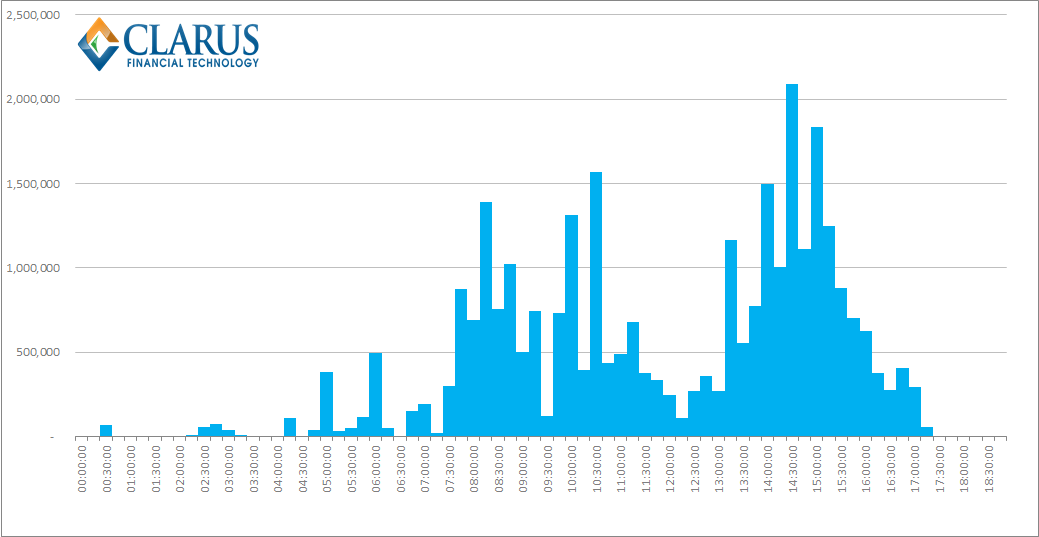
What the above chart shows us is that:
- A peak DV01 of $2.1m was traded between 14:15 and 14:30 (Eastern Time) on November 25th.
- On average, $317k in DV01 trades per 15 minute period.
- If we assume the trading day is not a 24 hour period, but compressed into an 8 hour window between 08:00-16:00 (ET), this average increases to nearly $800k per 15 minutes.
- Even within this window, the variability between any 15 minute window is extreme, with the Standard Deviation $500k.
These descriptive stats highlight a simple fact. It does not necessarily make sense to compare the opening 15 minutes of trading to the closing 15 minutes of trading, nor to any period in-between. Let’s face it, market participants know that the most liquid time of day is at the close – we have explored this before in detail here and here.
However, anyone working on the trading floor will have heard the question “what is liquidity like in <insert product here> at the moment?”. For USD Swaps, we can answer that systematically.
Current Conditions vs History
Here’s how. We compare the opening 15 minutes of trading today, to the same 15 minute period on the preceding 20 days. And we can measure whether current trading activity (i.e. liquidity) significantly exceeds what has been seen in the past. Hence the concept of a liquidity monitor. Extend this across the trading day, and we have a sense of what “liquidity” is like during discrete time intervals.
The chart below shows the deviation from the 15 minute averages during each discrete window for the past month. This presents a data-set that has a mean of zero, but with a heavily skewed distribution with a far right-hand tail – because the minimum amount of liquidity is zero, and the maximum is unbounded:
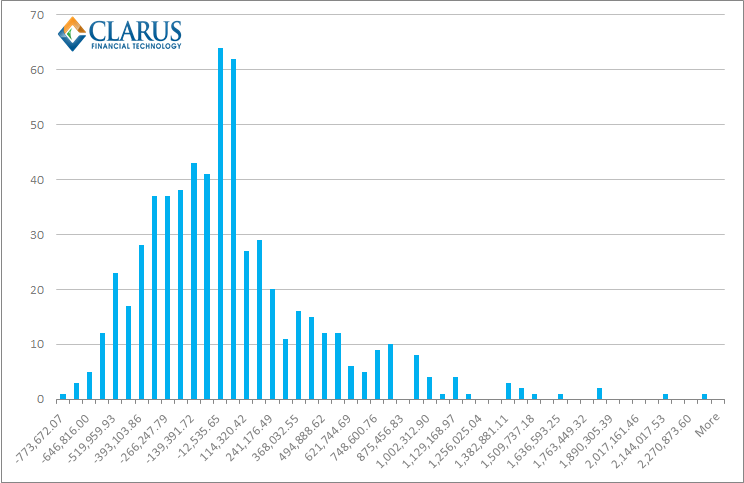
Now we could argue that we are interested in volume data when it is abnormally high (not low). But is this true? If so, we are left with a conveniently small data set for the past month. From a starting point of over 612 periods, we are left with just 21 that differ by more than one standard deviation from the norm. In other words, approximately once a day, liquidity is abnormally high. But I feel that is just a complicated way of pulling out maximum liquidity events from the past. I prefer the concept of a monitor.
SDR Liquidity View
The numbers above are still expressed in absolute terms.
We’ve already stated that measuring notional traded is not as useful as turnover or net positions, and these figures tend to leave us scratching our heads a little bit. So let’s put it another way. What percentage of the average DV01 is currently trading? Put like that – we are talking a liquidity monitor. Over the past month, that range of “liquidity” looked similar to the previous chart (bounded at -100%, unbounded to the right).
The key difference is that it makes a lot of sense when looking at it throughout the day, instead of historically. For the most active day last month, 25th November, the SDR Liquidity View is shown below:
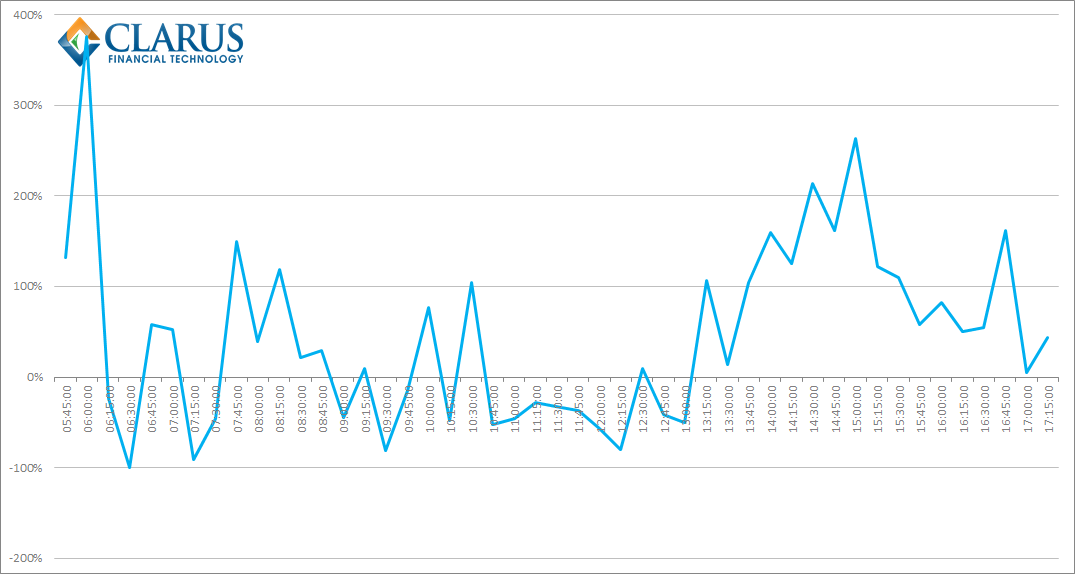
This trading day before Thanksgiving therefore offers a nice example of how we should make sense of volumes. What we see makes intuitive sense:
- Volumes were only abnormally high at the open and close.
- This is to be expected as closing orders for the 26th and 27th are all rolled into the 25th closing window.
- Because volumes are highest at the close, a 60 minute period of +150-200% liquidity can inflate the whole day’s volumes.
- There were still significantly more periods of constrained liquidity (<50% of normal) than high liquidity during the day.
Configurable
One of the joys of using the API in Excel is the freedom it offers. We’ve looked at 15 minute windows of total DV01 in this example. We can of course change the time period and asset class with a tweak of the parameters, including looking at only 5 or 10 year swaps. Our users can also configure this to look at the time taken to trade $50k DV01 for example. And all of this is before we even talk about how prices move during these periods…..but I’ll leave that one for Clarus users to explore.
Summary
In short, you now have the tools available to avoid that terrible sinking feeling when you try to transact and the market is not willing to play ball due to a distinct lack of liquidity!
Contact us to find out more about getting access to all of our products.