Today we look at issuer names most actively traded based on single-name credit default swap (CDS) trades reported to US SEC Securities Based Swap Data Repositories (SBSDRs) in March 2026.
This follows on from the prior similar blog covering September 2025, as we follow the natural CDS volume peaks in March and September.
We rank SBSDR reported names by count instead of notional, given the understatement of notional amounts due to the $5 million notional trade cap. Later we also use cleared trade counts for comparability.
CDS on sovereigns
We start with USD CDS on sovereign names.
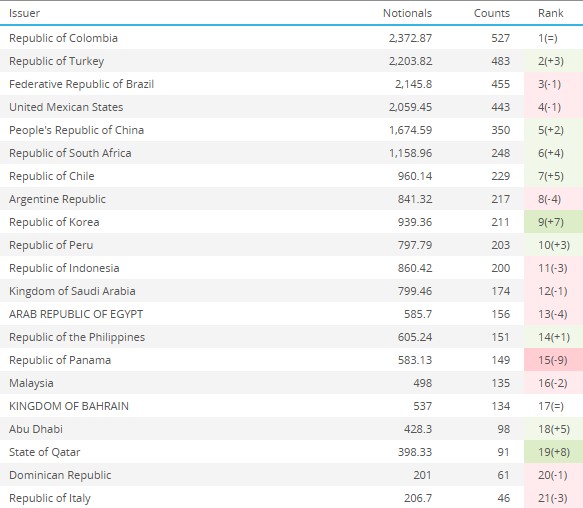
Table 1 – 21 most active USD CDS on sovereigns in March 2026. Source: SBSDRView
Table 1 shows the most active 21 sovereign names which formed 90 percent of the total volume in March 2026 (with the change in rank from February). We also compare ranking versus the last peak in September 2025.
- Colombia was the most active name with 527 trades – up half-on-half (HoH) from second in September 2025 and was also the most active name in February.
- Turkey was second with 483 trades – up HoH from fifth and up month-on-month (MoM) from fifth.
- Brazil was third with 455 trades – and was also third in September 2025 but down MoM from second.
- Mexico was fourth with 443 trades – also fourth in September 2025 but down MoM from third.
- China was fifth with 350 trades – up HoH from sixth and up MoM from seventh.
- Argentina was eighth with 217 – down HoH from first and down MoM from fourth.
- One other name rose like Argentina by more than six places – Egypt (up seven places), while the largest HoH falls in rank were Argentina and Panama (both down seven places).
Changing to EUR, we see the following:
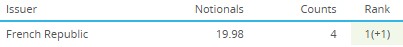
Table 2 – EUR CDS on sovereigns in March 2026. Source: SBSDRView
Table 2 shows that:
- France traded four times in March 2026.
- The US did not trade after trading a handful of times each month from September 2025 to February 2026 except December 2025. (Trading the US in non-US currencies makes sense as any credit downgrade would impact the dollar itself – limiting hedge effectiveness.)
CDS on US corporates
Next, we look at the top 30 US corporates by trade count which made up over 43 percent of the total trade count.
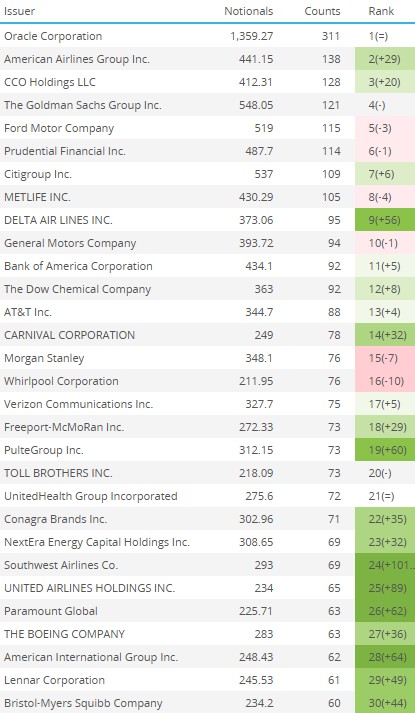
Table 3 – Most active CDS on US corporates in March 2026. Source: SBSDRView
Table 3 shows that:
- Oracle was the most traded name with 311 trades – up from fourth HoH and was also top in February.
- American Airlines was second with 138 trades – up from 24th HoH and up from 31st MoM.
- CCO Holdings was third with 128 trades – up from sixth HoH and up from 23rd MoM.
- Goldman Sachs was next with 121 trades – down from third HoH and was also fourth in February.
- Ford Motor Company made up the top five with 115 trades – down from first HoH and down from second MoM.
- Verizon was 17th with 75 trades – down from fifth HoH and up from 22nd in February.
- Con Agra was 22nd with 71 trades – down from second HoH and up from 67th in February.
- Others rising HoH by more than 25 places like American Airlines included Metlife, Dow Chemical, Morgan Stanley, UnitedHealth, United Airlines, and Paramount.
A higher rank due to an increase in trading could arise from, for example, a change in investor perception of the credit-worthiness of a name, a recent debt issue, or some kind of financial news for the name or its sector.
CDS on EU corporates
Next, let us look at the top 25 EU Corporates by trade count which represented over 50 percent of the total trade count.
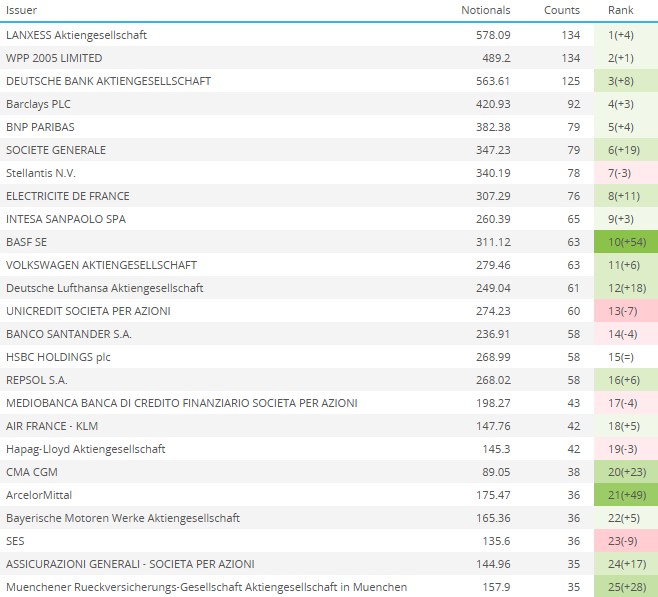
Table 4 – Most active CDS EU corporates in March 2026. Source: SBSDRView
Table 4 shows that:
- Lanxess was top equal with 134 trades – up HoH from eighth and up MoM from fifth.
- WPP 2005 was top equal with 134 trades – up HoH from 16th and up MoM from third.
- Deutsche Bank was third with 125 trades – up HoH from fifth and up MoM from 11th.
- Barclays plc was fourth with 92 trades – up HoH from 17th and up MoM from seventh. Interestingly Barclays Bank plc, a subsidiary of Barclays plc, shows as a separate name lower down the list with 16 trades.
- BNP Paribas was fifth with 79 trades – down HoH from third but up MoM from ninth.
- Stellantis was seventh with 78 trades – down HoH from first and down MoM from fourth.
- Bank Intesa was ninth with 65 trades – down HoH from second but up MoM from sixth.
- Kering was 45th with 25 trades – down HoH from fourth but up MoM from 59th.
- HoH risers by more than 40 places were BASF (up 83 places), CMA CGM (up 58 places), Muenchener RG (up 71 places), Commerzbank (up 41 places), Akteibolaget Electrolux (up 69 places), and AKZO Nobel (up 48 places).
CDS on Japanese corporates
Next, we look at Japanese corporates with more than 5 trades in March 2026 which made up over 45 percent of the total trade count.
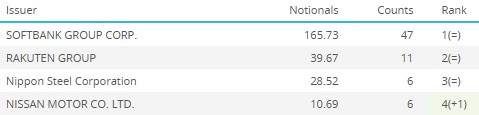
Table 5 – Most active CDS Japanese corporates in March 2026. Source: SBSDRView
We see:
- Softbank ranked first by some distance with 47 trades – maintaining top spot both HoH and MoM.
- Rakuten was second with 11 trades – maintaining second both HoH and MoM.
- Nippon steel was third with 6 trades – up HoH from 15th and was also third in February 2026.
- Nissan Motor was equal third with 6 trades – up HoH from 16th and up MoM from fourth.
Overall single-name volumes
Let us put the names activity in context of month-by-month overall volumes, starting with US SDR-reported single-names.
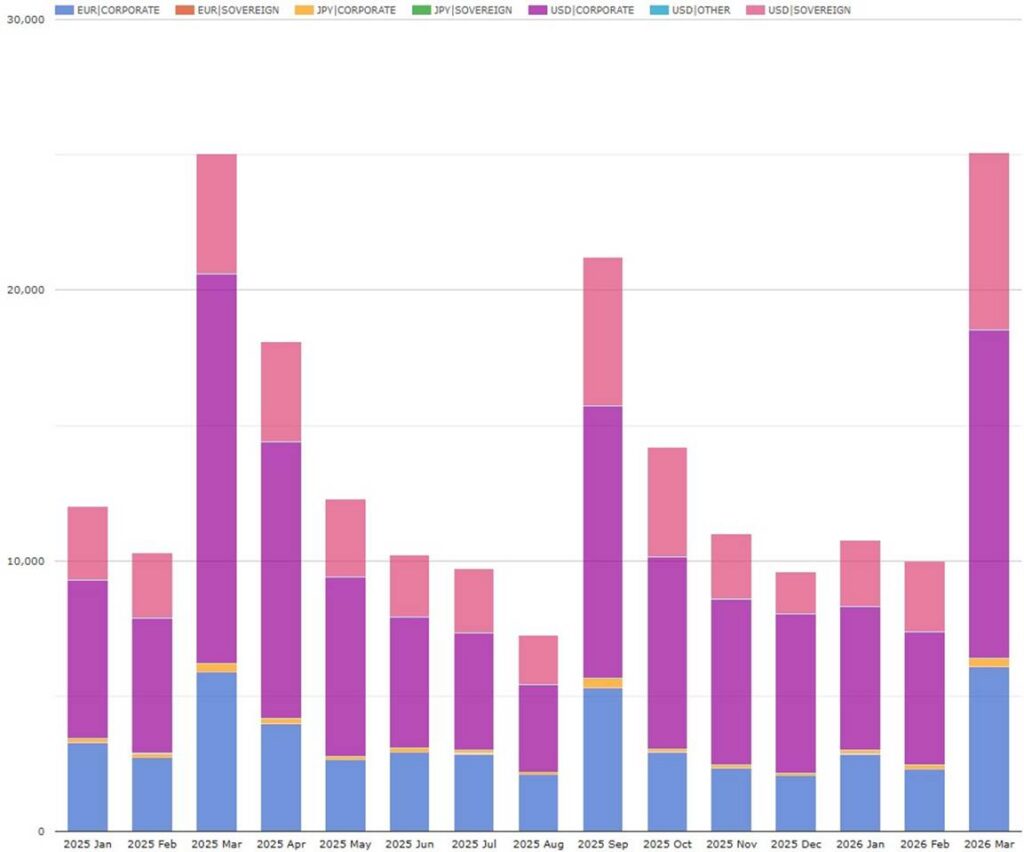
Chart 1: US-reported single-name CDS trade count. Source: SBSDRView
Chart 1 shows the expected pattern of peaks each March and September, with March 2026 having a monthly peak of 25,076 trades – up 18 percent HoH from September 2025 and flat YoY from March 2025.
- USD corporates were the largest combination with 12,157 trades – up 21 percent HoH but down 15 percent YoY.
- USD sovereigns were next with 6,535 trades – up 19 percent HoH and up 47 percent YoY.
- EUR corporates saw 6,075 trades – up 15 percent HoH and up 3.4 percent YoY.
- JPY corporates had 302 trades – down 13 percent HoH and down 2.9 percent YoY.
- EUR sovereigns traded 7 times – down 42 percent HoH and down 74 percent YoY, reflecting the US not trading in the month.
Next, we have three CCPView charts showing global cleared single-names for USD, EUR, and JPY. Note: the y-axis scales on each chart are quite different.
Cleared single-name CDS trade counts by currency. Source: CCPView
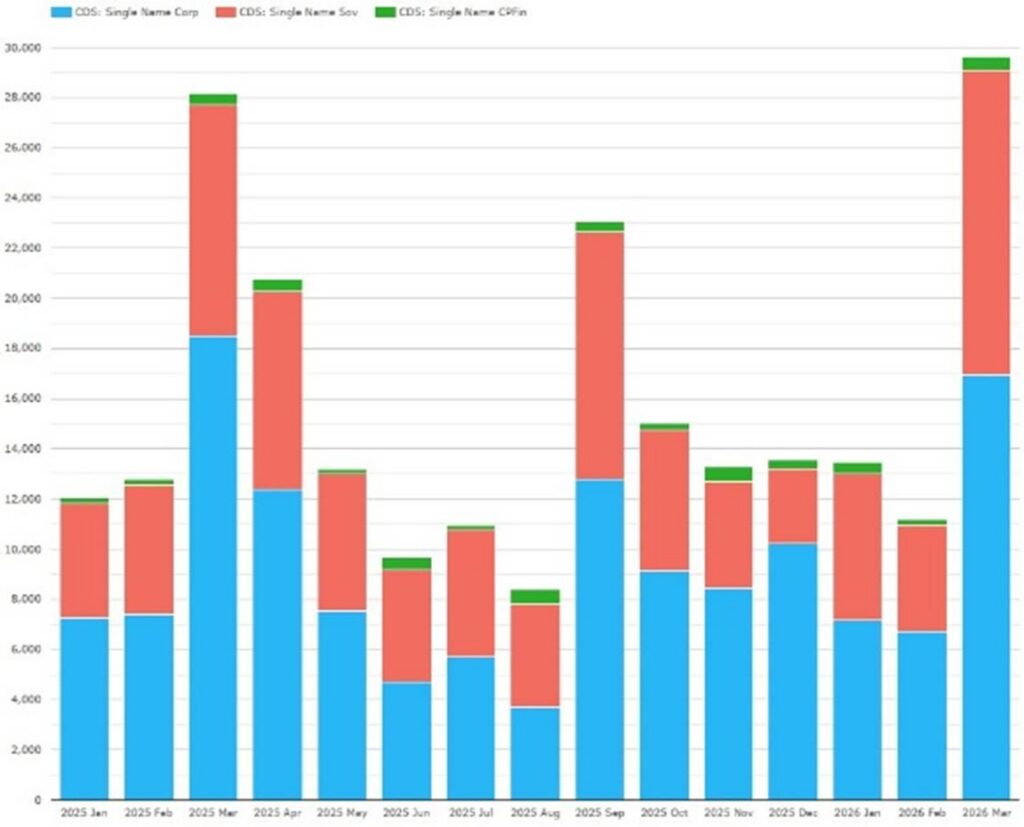
Chart 2: USD
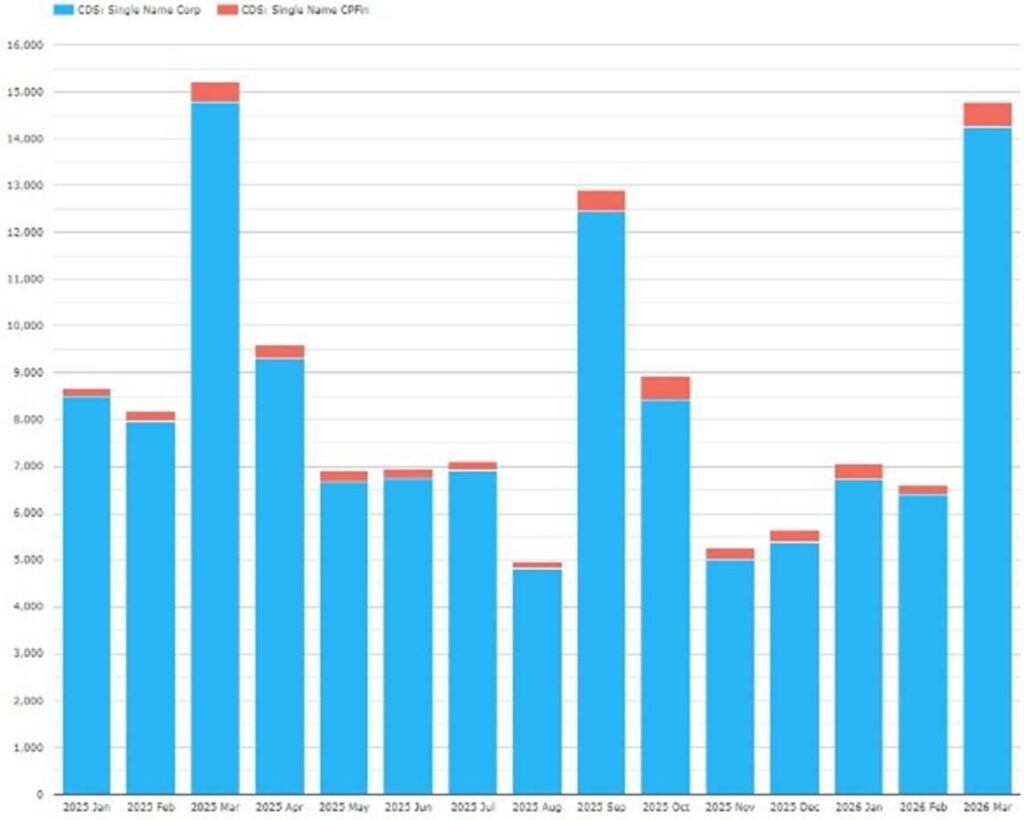
Chart 3: EUR
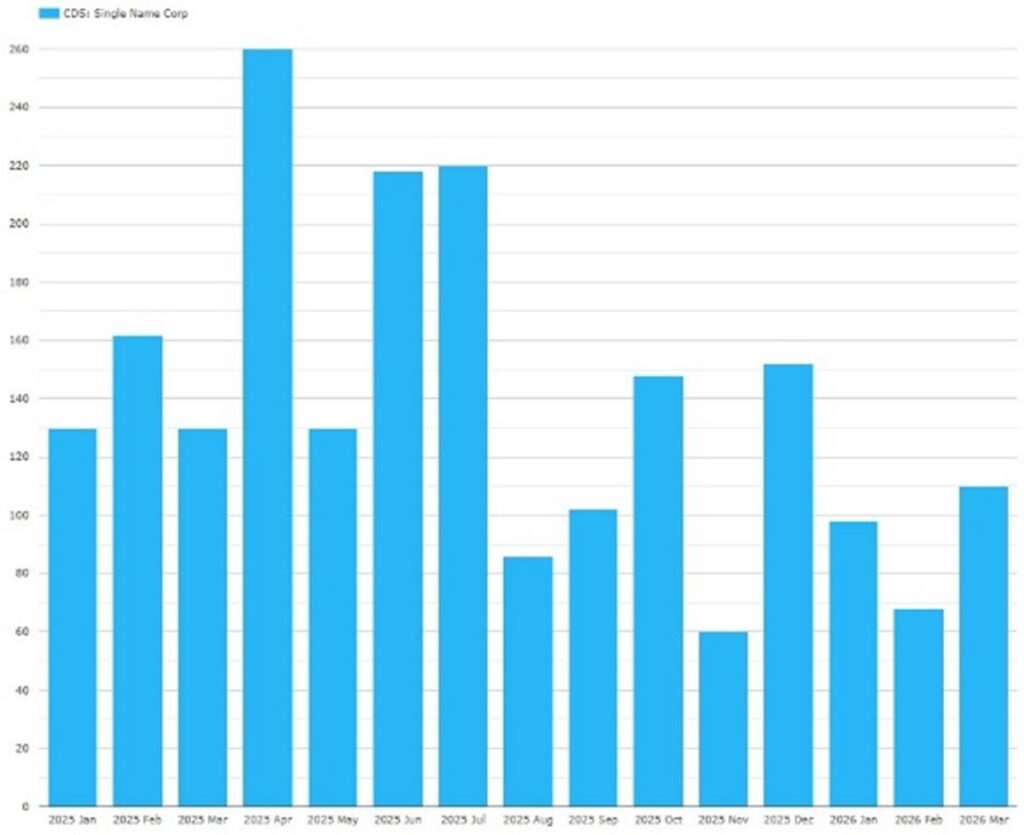
Chart 4: JPY
Charts 2, 3 and 4 show the traditional peaks in March and September as hedges roll over close to the IMM dates in those two months. (In JSCC’s case there is a lag in clearing which moves most of the spike into April and October.)
- USD corporates cleared 16,956 trades – up 33 percent HoH but down 8.2 percent YoY.
- USD sovereigns had 12,132 trades – up 23 percent HoH and up 31 percent YoY.
- EUR corporates showed 14,250 trades – up 15 percent HoH but down 3.7 percent YoY.
- JPY corporates showed 110 trades – up 7.8 percent HoH but down 15 percent YoY.
If you compare by eye SDR-reported versus global cleared figures, you a smaller fraction as you move from USD to EUR.
In summary
Using the mountain of data in US SBSDRs, SBSDRView provides transparency, information, and insights on OTC Credit and Equity Derivatives.
- Other credit derivatives than single-name CDS covered include custom baskets, total return swaps, and exotics including up to five names.
- Our “most active” view highlights the names that trade most frequently each day/week/month.
- Our “custom” view allows you to design your own notional or trade count query tailored to the granularity of information you need. This might include specific transaction types, time-periods, currencies, product types and subtypes, cleared vs. uncleared, or on- vs. off-platform.
- From both views you can click through from the volumes to the individual trade details.
Please contact us, if you are interested in using SBSDRView.