Today we look at issuer names most actively traded based on CDS trades reported to US SEC Securities Based Swap Data Repositories (SBSDRs) in September 2025.
Background
The prior similar blog covered credit derivatives (CRD) for July 2025.
Given the CDS-market peaks naturally in March and September, we will focus on those months going forward.
SBSDRs reporting includes single-name CDS or custom baskets with up to five names.
CDS on sovereigns
We start with USD CDS on sovereign names.
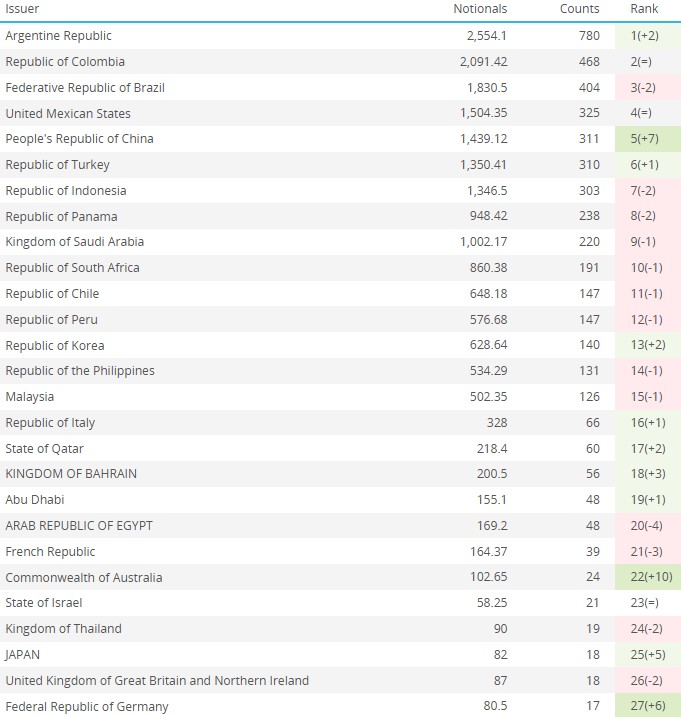
Table 1 – Most active USD CDS on sovereigns in September 2025. Source: SBSDRView
Table 1 shows the issuer name, gross notional in USD millions, trade count, and rank in September 2025 (with the change in rank from August). We rank by count instead of notional, given the understatement of notional amounts due to the $5 million notional trade cap.
- Argentina was the most active name with 780 trades – up month-on-month (MoM) from third, and up half-on-half (HoH) from 16th in March.
- Colombia was second with 468 trades – and was second in August and fifth in March.
- Brazil was third with 404 trades – down MoM from first, but HoH from fifth.
- Mexico was fourth with 325 trades – and was fourth in August, and up from third in March.
- China was fifth with 311 trades – up from 12th in August, and up from sixth in March.
- The largest MoM gainers in rank were Australia (up ten places), China (up seven places), and Germany (up six places).
- The largest HoH gainer in rank was Argentina (up 16 places).
Changing to EUR, we see the following:
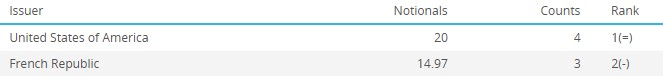
Table 2 – EUR CDS on sovereigns in July 2025. Source: SBSDRView
Table 2 shows that:
- The US traded four times.
- France traded three times.
The US continues to trade once per month in 2025. Trading the US in EUR makes sense as any credit downgrade would impact the dollar itself – limiting hedge effectiveness.
CDS on US corporates
Next, we look at the US corporates which traded more than 50 times in September, ranked by trade count.
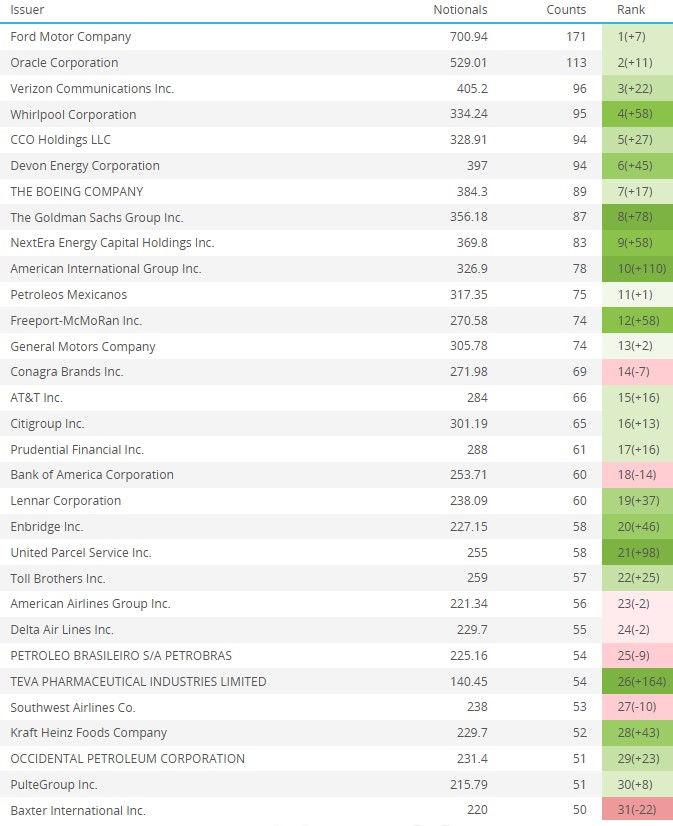
Table 3 – Most active CDS US corporates in July 2025. Source: SBSDRView
Table 3 shows that:
- Ford was the most traded name with 171 trades – up MoM by seven places, but level with its top spot in March.
- Oracle was second with 113 trades – up MoM by 11 places, and up HoH from 53rd place.
- Verizon was third with 96 trades – up MoM by 22 places, and up HoH from 21st place.
- Whirlpool was fourth with 95 trades – up MoM by 58 places, and up HoH from 32nd place.
- CCO Holdings made up the top five with 94 trades – up MoM by 27 places, and up HoH from 39th place.
- Others rising MoM by more than 25 places included Devon Energy, Goldman Sachs, Nextra Energy, AIG, Freeport McMoRan, Lennar, Enbridge, Teva Pharmaceutical, Kraft Heinz.
A higher rank due to an increase in trading, could arise from, for example, a change in investor perception of the credit-worthiness of a name, a recent debt issue, or some kind of financial news for the name or its sector.
CDS on EU corporates
Next, let us look at the EU Corporates trading more than 40 times in September.
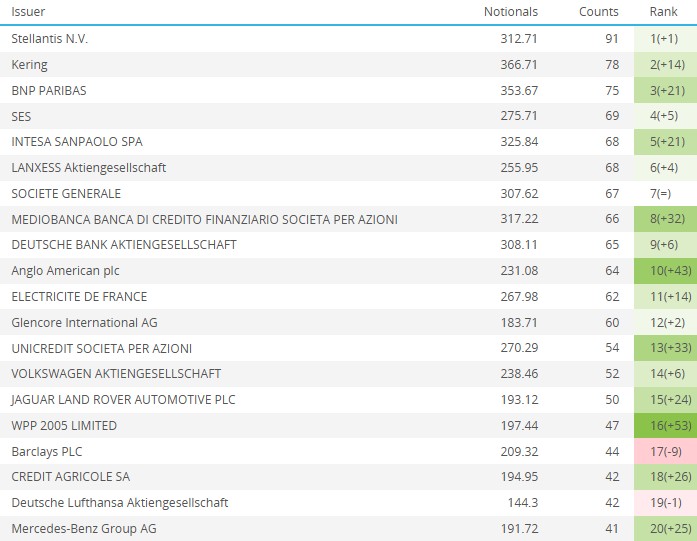
Table 4 – Most active CDS EU corporates in July 2025. Source: SBSDRView
Table 4 shows that:
- Stellantis had the most trades with 91 – maintaining its top spot from August, and up HoH from third place.
- Kering was second – up 14 places MoM, and up HoH from 80th place.
- BNP was third – up 21 places MoM, and up HoH from seventh place.
- SES was fourth with 69 trades – up five places MoM, but down HoH from first place.
- Intesa was fifth with 68 trades – up 21 places MoM, but down HoH from second place.
- Other notable MoM risers were Mediobanca (up 32 places), Anglo American (up 43 places), Unicredit (up 33 places), WPP 2005 (up 53 places), Credit Agricole (up 26 places), and Mercedes-Benz (up 25 places).
- Only Barclays (down nine places) fell more than one place among this group.
CDS on Japanese corporates
Next, we look at Japanese corporates.
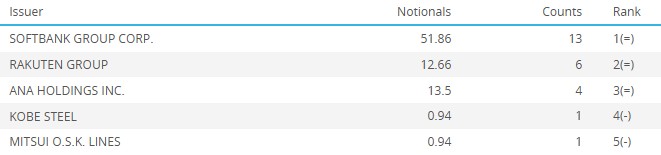
Table 5 – Most active CDS Japanese corporates in July 2025. Source: SBSDRView
We see:
- Softbank ranked first with 13 trades – maintaining top spot both MoM and HoH.
- Rakuten was second with nine trades – maintaining second both MoM and HoH.
- Ana Holdings was third with four trades – maintaining third MoM and up HoH from fourth.
In March 2025, we see Prudential added to the five names in September.
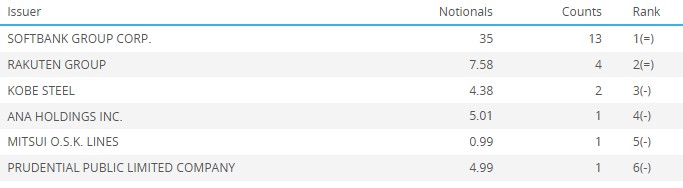
Table 6 – Most active CDS JP corporates in March 2025. Source: SBSDRView.
Overall single-name volumes
Let us put the names activity in context of month-by-month overall volumes, starting with US SDR-reported single-names.
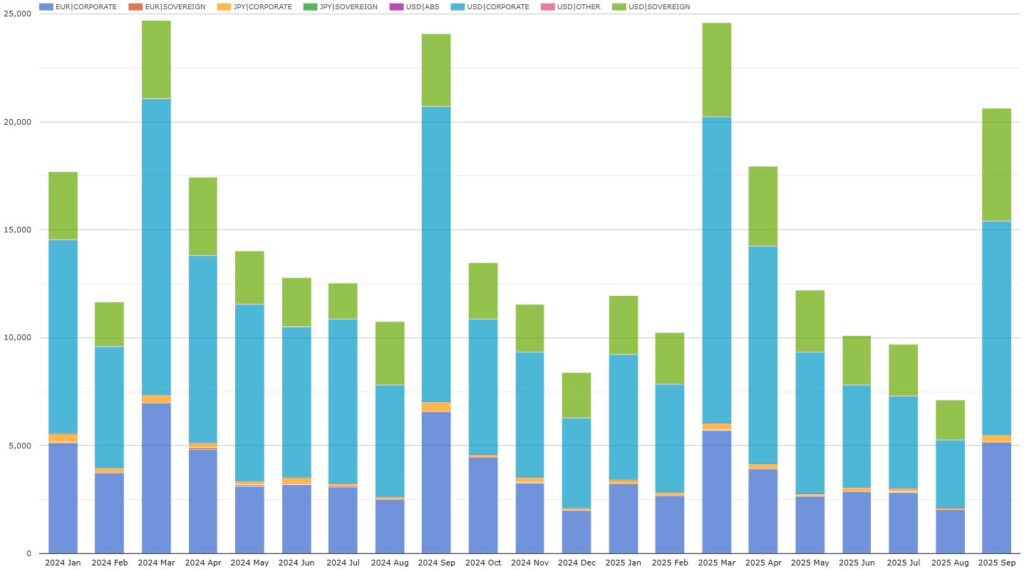
Chart 1: US-reported single-name security-based CDS trade count. Source: SBSDRView.
Chart 1 shows single-name CDS trade counts since the start of 2024. As we expect each March and September, September was a monthly peak with over 20,600 trades – down 14 percent YoY from September 2024, and down 16 percent HoH from March 2025.
- Corporates made up over 15,300 trades – down 26 percent YoY, and down 24 percent HoH.
- Sovereigns had over 5,200 trades – up 55 percent YoY, and up 20 percent HoH.
Next, we look at global cleared single-names, using CCPView.
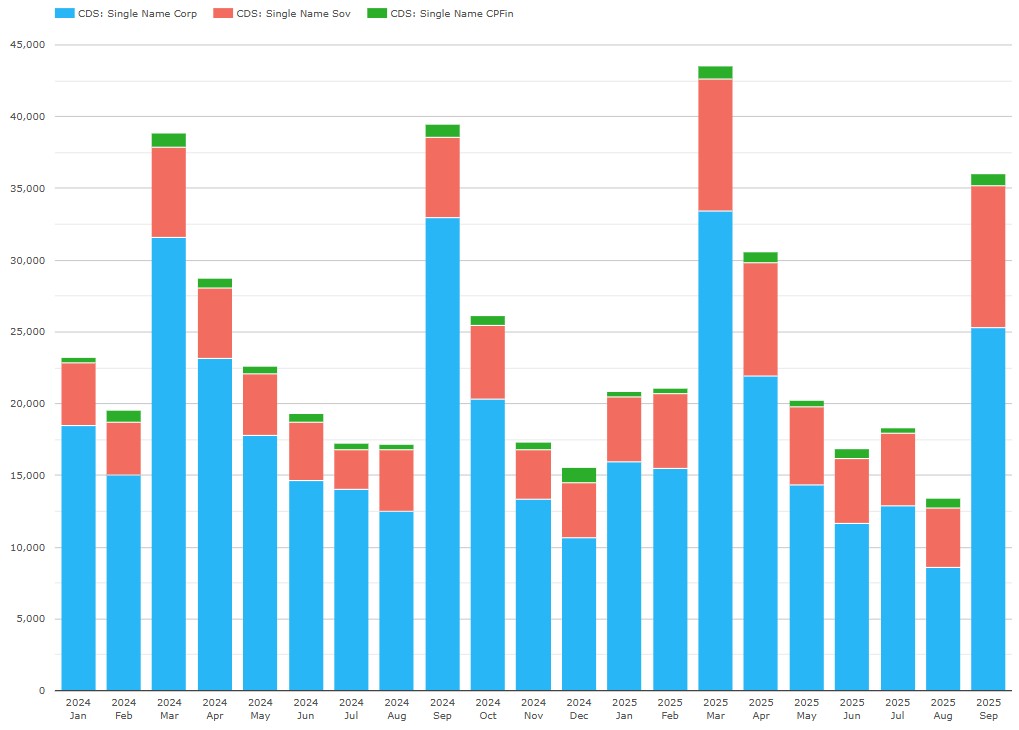
Chart 2: Global cleared single-name CDS trade count. Source: CCPView.
Chart 2 shows global cleared single-names also peaking in March and September over the same period as chart 1. September 2025 brought over 36,000 trades – down 9 percent YoY, and down 17 percent HoH.
- Corporates made up over 25,300 trades – down 23 percent YoY, and down 24 percent HoH.
- Sovereigns had over 9,880 trades – up 77 percent YoY, and up 7 percent HoH.
US SDR-reporting typically captures about half the global volume, which is consistent with the above figures.
In summary
- Using the mountain of data in US SBSDRs, SBSDRView provides transparency, information and insights on OTC Credit and Equity Derivatives.
- Our “most active” view highlights the names that trade most frequently each day/week/month.
- Our “custom” view allows you to design your own notional or trade count query tailored to the granularity of information you need. This might include specific transaction types, time-periods, currencies, product types and subtypes, cleared vs. uncleared, or on- vs. off-platform.
- From both views you can click through from the volumes to the individual trade details.
- Please contact us, if you are interested in using SBSDRView.