We’ve written a few pieces now on the recent findings from the Bank Of England working paper. The BOE found that SEF trading in the USA has both (a) increased liquidity and (b) decreased execution costs for USD swaps. My colleague Chris validated the liquidity aspect in his recent blog using our own Clarus data and concluded, for 2, 5, and 10 year swaps, that “off-SEF trades have a price dispersion approximately two orders of magnitude greater than on-SEF trades”.
That means liquidity is much deeper on-SEF compared to off-SEF.
This begs a few questions:
- How much of the market is actually SEF executed now?
- Just what are those trades that are not being SEF-executed?
- Given the (BOE-validated) efficiencies of SEF execution, shouldn’t we put all swaps onto SEFs (make them MAT)?
QUICK STATISTICS: HOW MUCH IS ON SEF
Let’s begin with headline statistics in an easily-digestible format. Starting with trade counts for Fixed Float swaps across all G4 currencies, On-SEF vs Off-SEF since September 2013 (SEF’s launched the following month), in percentage terms:
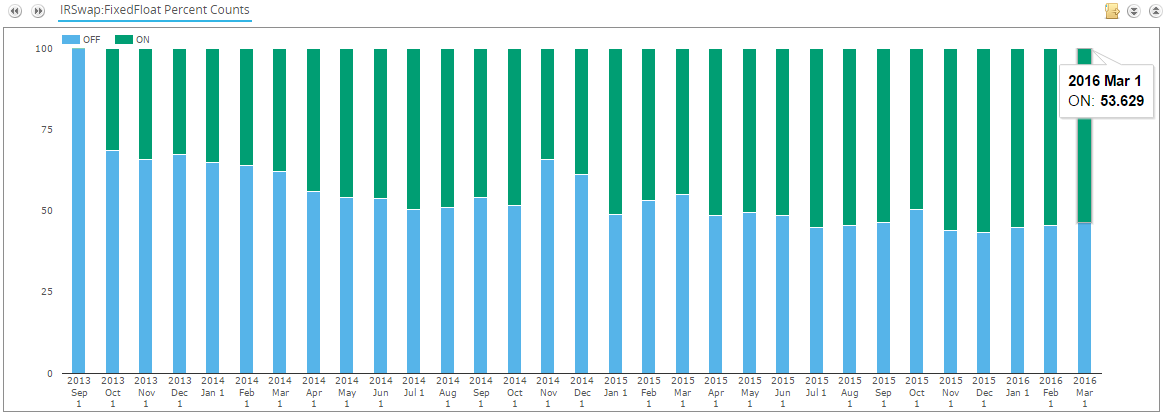
So this tells us that over 53% of all Fixed Float G4 swaps are On-SEF, and with a nice (albeit slow) upward trend since 2013. This picture is however a bit unfair, as even the BOE admitted that the EUR swap market is bifurcated, and I would have to assume the same for JPY and GBP, so let’s whittle this down to just USD Fixed Float swaps. First in terms of trade counts:
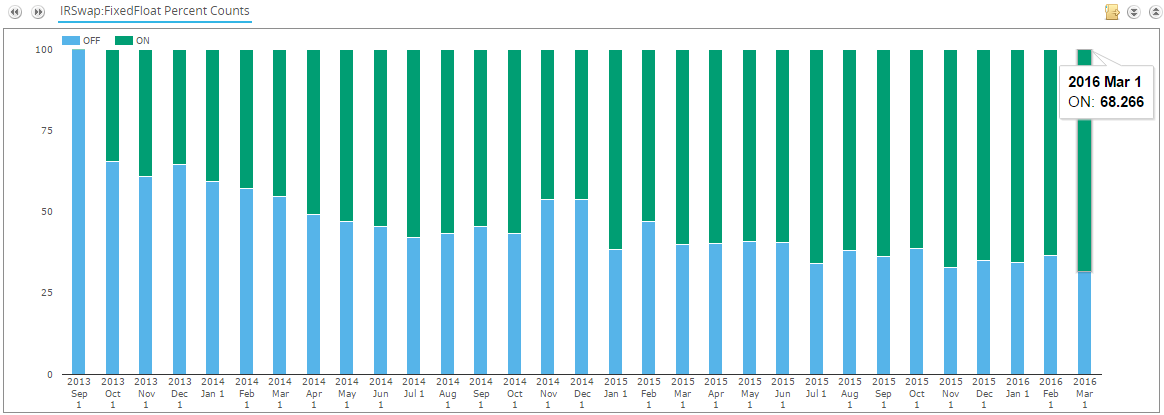
68% of USD Fixed/Float swaps on SEF. Not bad.
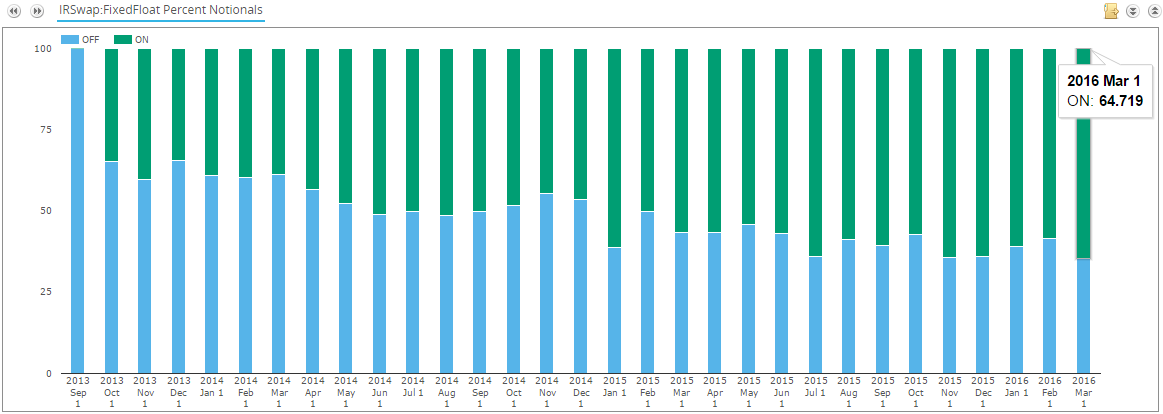
Next in Notional Terms (64%) :
Next in DV01 terms (71%) :
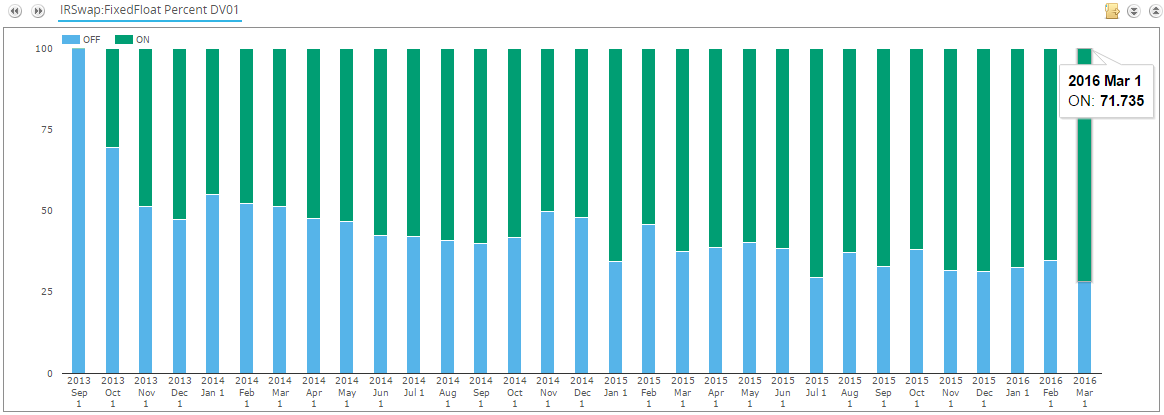
So right off the bat we can see SEF execution accounts for anywhere between 64.7% (by notional) and 71.7% (of risk), depending upon how you measure it. Let’s call it 2/3rd of the USD Fixed/Float market as on-SEF. This begs the question, what is the other 1/3rd?
WHAT’S OFF-SEF
So let’s look at that 1/3rd of the pie that is Off-SEF. If we do this by assessing the product subtypes we can get some nice insight. Our universe here is only Off-SEF, USD Fixed/Float Swaps:
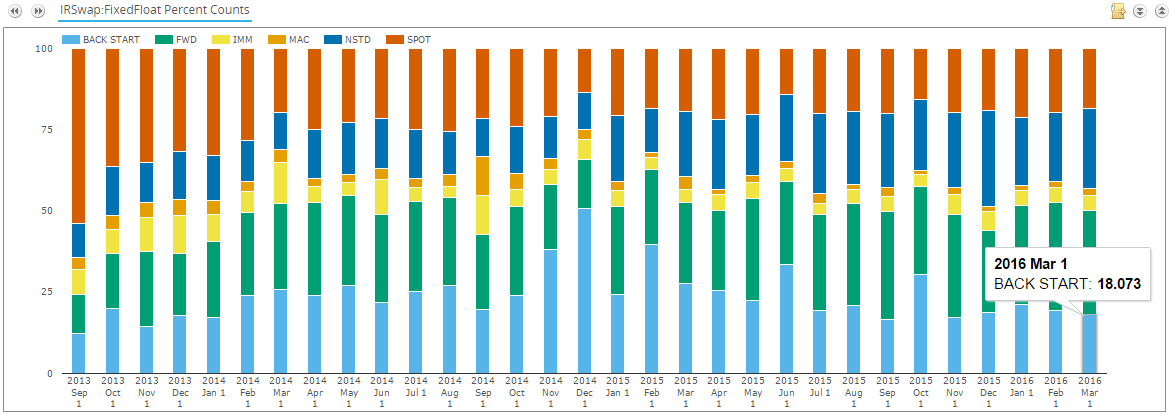
Let me summarize this with 2016 year-to-date percentages by subtype (for Off-SEF USD swaps):
- 20% Back-Start. “Back-Start” are post-traded swaps typically associated with portfolio maintenance activities, such as tearing up bilateral or cleared trades. These are not price-forming transactions. Interestingly, 83% (of this 20%) were cleared, and so only 17% bilateral.
- 32% Forward Start. A few things fall into here. First, you have your normal bespoke odd-dated swaps. But you will also have various “standard flavors” of forward start, I am thinking particularly of things like invoice spreads (which, by the way, have to be traded off SEF). All Forward Start are not MAT’d.
- 22% Non-Standard (NSTD). I tend to refer to this as the “outliers” category, primarily containing:
- non-par swaps that have up-front-fees
- Zero-coupon, monthly or quarterly fixed payments
- Trade is flagged with “Other Price Effecting Term” meaning we are not told about some crucial component of the trade (could be as simple as being an amortizer)
- 6% IMM & MAC. This represents 1792 trades year to date, and is interesting because the front 2 contracts are MAT’d (required to trade on SEF). So let’s break this down a bit further:
- 41% of these are Sep 2016 or later (so not first 2 months) so hence not MAT.
- Meaning 59% of these are MAT’d transactions. So why are these not on-SEF? Maybe if we dig further….
- 191 (~11%) are block trades so Off-SEF makes sense.
- 253 (~14%) are uncleared. That doesn’t explain much as the clearing mandate applies.
- None have End User Flag set, so that doesn’t explain it.
- So I cannot explain roughly half of the IMM & MAC swaps that are off-SEF. But there is always the standby chestnuts of inter-affiliate and discretionary (eg overseas) reporting, though I doubt this fully explains it. But in context, this is a fraction of a fraction of the swap market we are now talking about.
- 20% Spot Starting. Hmm, you would think these should be MAT’d and hence on-SEF. Let’s break this down:
- 9% are block, so need to be Off-SEF. Ok fair enough.
- 10% are non-MAT’d indices such as 1M Libor and Prime. (Only 3M and 6M Libor is MAT)
- 50% of the swaps are not standard MAT tenors (2, 3, 4, 5, 6, 7, 10, 12, 15, 20, 30)
- None of the trades are flagged with End-User Exception
- So I cannot readily explain roughly 1/3rd of these
SUMMARY
So, if you forgive a portion of the spot and IMM trades that I can’t directly explain, we can readily justify why nearly all Off-SEF trades were not traded on SEF. Generally speaking, everything off-SEF is bespoke!
The question remains that if the Bank of England tells us that liquidity is better on-SEF, and SEF’s have brought down execution costs, should we not further propagate SEF requirements to start mandating SEF execution for the last 1/3rd of swaps?
Heck, I’m running low on time now – but I don’t think that just because something works for naturally liquid products, that it will work for some of the more bespoke products. I’ll leave it there for the time being, and as usual send us your thoughts.