- INR Swaps are large swap markets, similar in size to PLN, KRW and NOK swaps.
- Over $250bn equivalent is cleared in INR swaps in active months, with 2023 already a record year in clearing with more than $2.4Trn equivalent transacted.
- The clearing landscape is split between the CCIL Onshore market accounting for 33% of volumes, and LCH SwapClear representing the Offshore market with 67% of volumes.
- The SEF market is very concentrated across two SEFs – Tradeweb for D2C flow and BGC for dealers.
Where do INR Swaps Rank on the Global Picture?
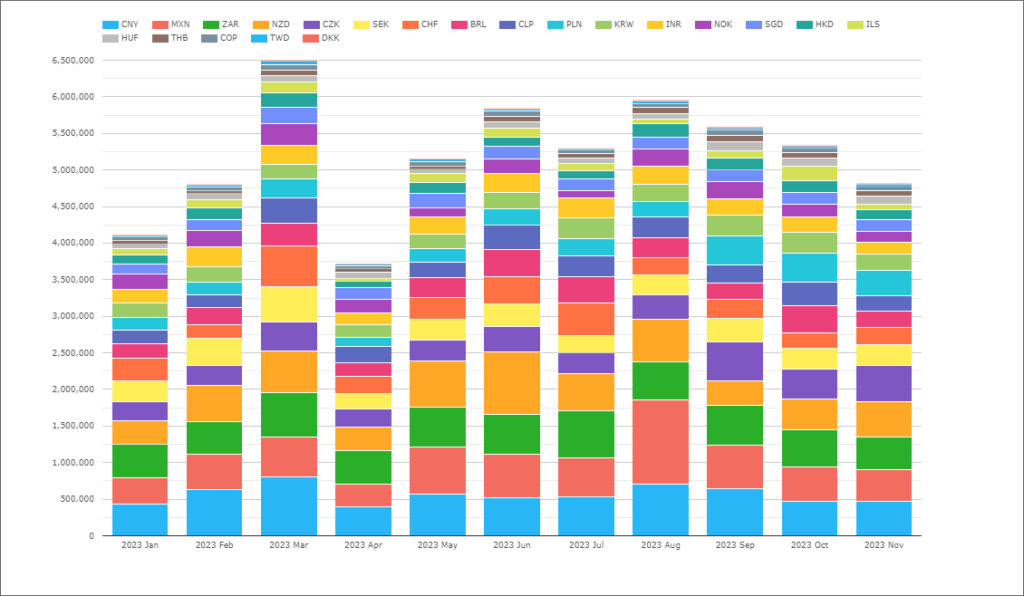
CCPView allows us to compare the relative size of INR swap markets to other currencies. Taking out the “G6” – USD, EUR, GBP, AUD, CAD and JPY – we see the below:
Showing;
- Volumes in Cleared OTC Interest Rate Derivatives from CCPView.
- The chart excludes the top six currencies by volumes (USD, EUR, GBP, JPY, AUD and CAD). These six currencies represented over 95% of total cleared volumes (back in 2019, see Four Trends in Swaps Data).
- There are A LOT of currencies here! I make 21 currencies, or 27 including the largest 6.
- For the currencies shown, the 2023 “ranking” by volume is as follows:
- CNY 10.8%
- MZN 10.7%
- ZAR 10.0%
- NZD 9.7%
- There is then a bit of a gap to CZK at 6.7% of volumes. However, the 21st currency, DKK sees only 0.2% of volumes.
- INR swaps, the subject of today’s blog, sit at number 12 on the list, representing 4.3% of the volumes outside of G6 swaps.
- INR swaps see similar volumes to PLN, KRW and NOK swaps for reference.
Let’s look further into the INR Swaps market.
Two Thirds of Cleared Volumes are at LCH
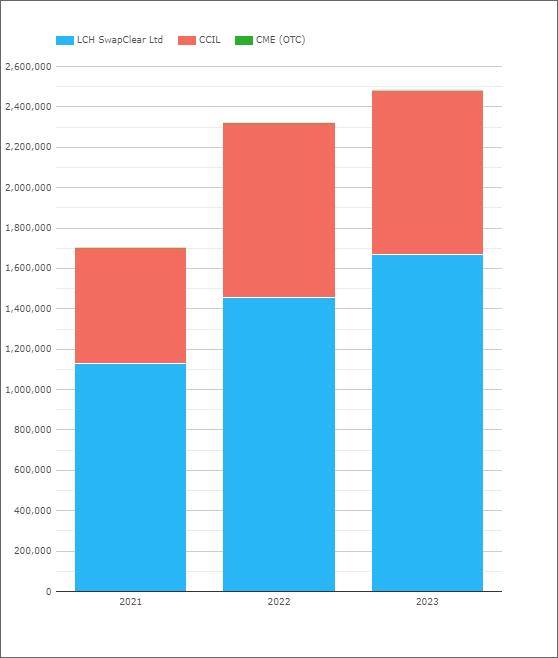
It is an interesting competitive landscape for INR swap clearing, something I wasn’t aware of before looking into the data:
Showing;
- LCH SwapClear with 67% of volumes.
- CCIL has a market share of about 33%.
- CME also offers clearing of INR swaps, but the volumes do not really register.
- Volumes have really increased since 2021, with volumes 46% higher in the past two years and we still have time to go in 2023.
For readers who may not be aware, CCIL is the Clearing Corporation of India.
Clearing in INR Markets
Taking US SDRs data as a representative slice of the market, Clearing is becoming more and more prevalent in the market:
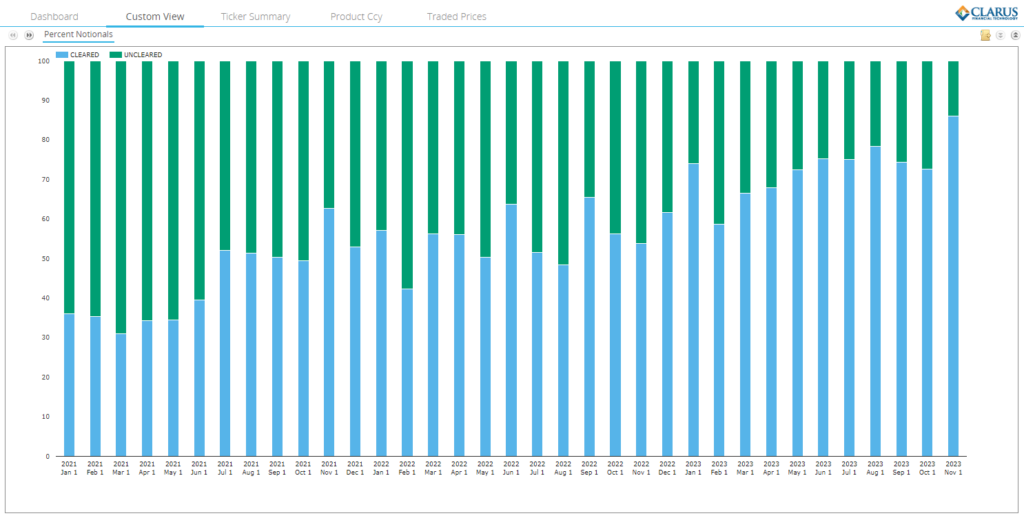
A few things jump out here:
- 86% of INR swap volumes reported to US SDRs have been cleared so far in November 2023 (up until 27th Nov) – a new all time record (what great timing for a blog 🙂 )!
- This has consistently been on the rise since 2021, when under half of the market was cleared.
- Virtually all IRS trades reported are uncleared, with all clearing volumes being in OIS. CCIL does report some daily volumes for their IRS product (see below).
OIS are Much Larger than IRS
Talking about the traded products, there are some volumes versus both IRS and OIS products reported in November 2023:
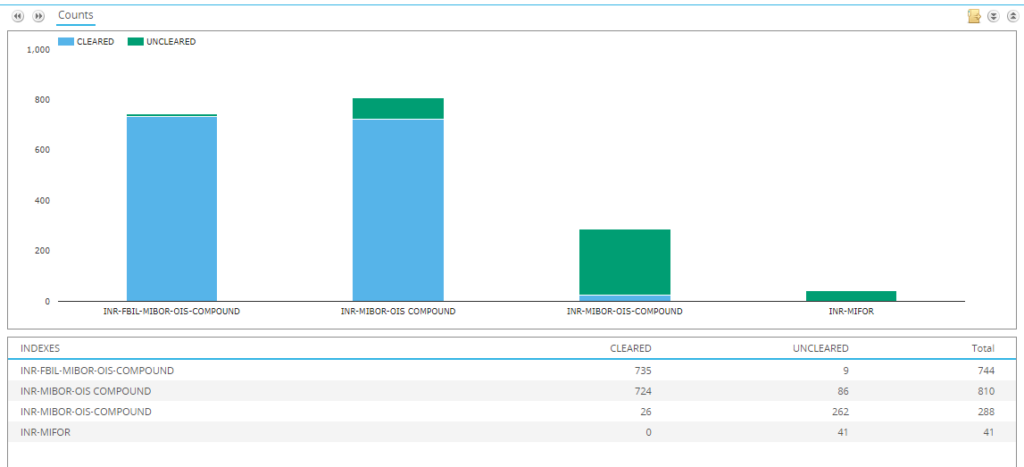
Showing;
- Most IRS are reported vs MIFOR.
- OIS are traded vs MIBOR.
- As well as MIFOR, CCIL reference an index “MMFOR” which also shows volumes:
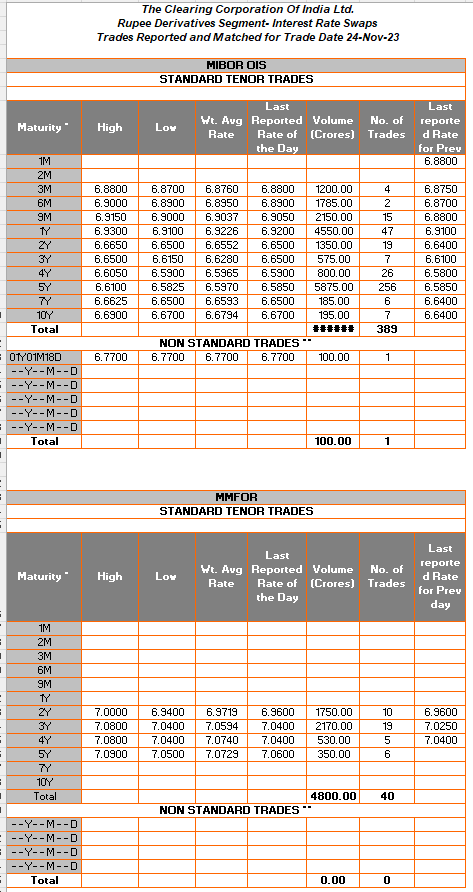
So in theory we have up to four rates to trade in INR swaps. In reality, it feels like liquidity is almost all concentrated in the “MIBOR-OIS” reference index.
Onshore or Offshore
SDR data includes a “Settlement Currency” column. This might seem redundant in a lot of cases (for example, it is typically left blank for a vanilla USD SOFR OIS). But for markets bifurcated into onshore and offshore market places, it is very handy to see when an INR swap is settled in INR or when it is settled in USD.
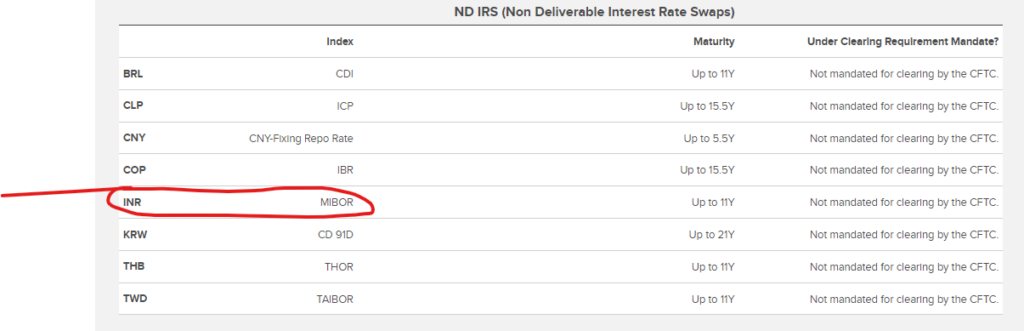
For those unaware, LCH SwapClear offer a Non-Deliverable OIS in INR, referencing MIBOR OIS:
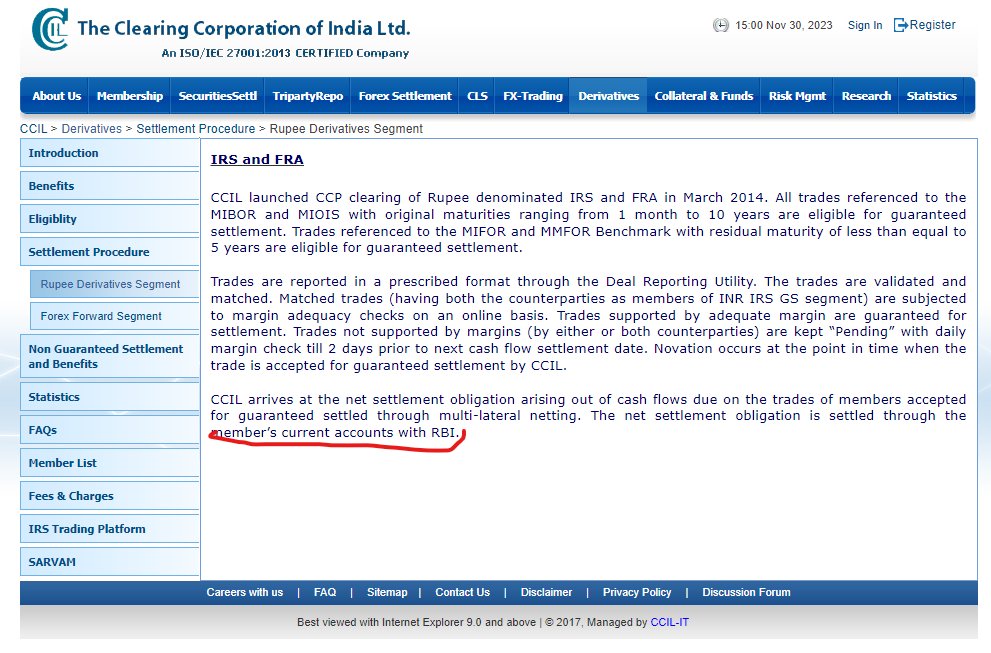
Whilst the CCIL documentation states that the swaps are settled via accounts held at the RBI, therefore inferring they are all subject to local INR settlement:
In a perfect world we would then be able to “scrape” SDR data and tell you for Cleared swaps with Settlement Currency “INR”, that is a swap cleared at CCIL. And for a Cleared swap with Settlement Currency “USD” that is most likely cleared at LCH SwapClear.
The data, however, is far from perfect in this respect, even for SEF-traded swaps (normally the “gold standard”):
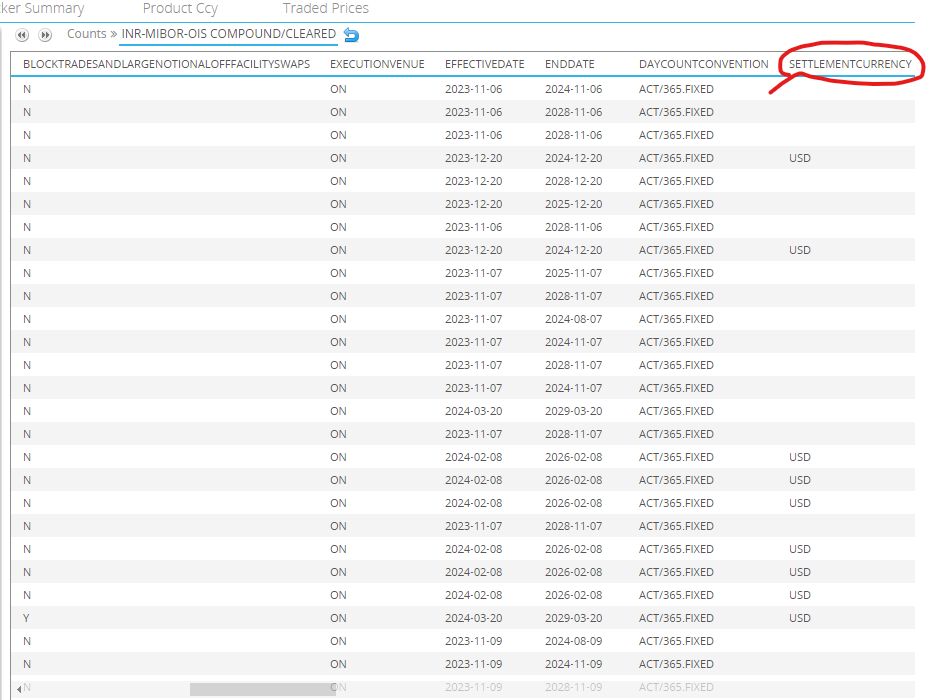
SEFs are reporting these trades as settled in “USD” or blank. Let’s assume that the blank is therefore consistent with how SEFs report “vanilla” trades and they are actually settled in INR (Nearly 100% of INR trades reported on-SEF are Cleared by the way).
It is when you get into the murky world of off-SEF and uncleared swaps that the data is “dirtier”. We see both INR and USD reported as the Settlement Currency:
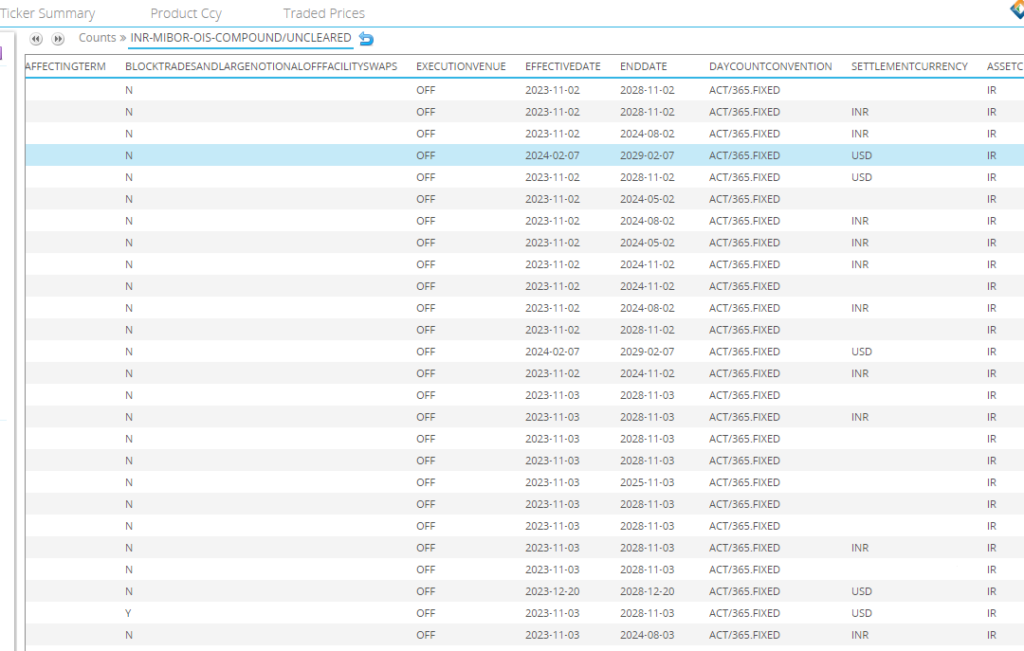
It is likely that there is some normalisation work that we can do here to identify which trades are Onshore INR settled and which are Offshore vs USD – one to look at for our users.
SEF Trading
Finally, we look at how much is traded on-SEF in INR Swaps. From SDRView;
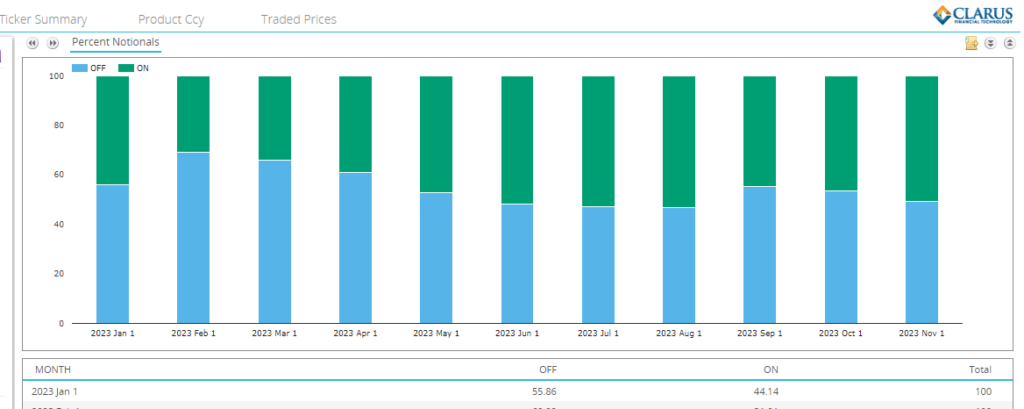
Showing;
- 45% of INR notional was traded on-SEF in 2023 so far (to nearly end of November).
- In most months it is an even split 50/50 on-SEF vs off-SEF.
- This is broadly replicated if we run the numbers by notional or trade count.
- February and March 2023 were the “worst” months for SEF trading with notably lower percentages executed on the trading venues.
Looking at SEFView, we see the following market share for SEFs:

Showing;
- What a small market- only four SEFs are active in INR swaps, and it looks like Bloomberg only recently saw any volume. Let’s say three SEFs in case this is bad data from Bloomberg?
- Tradeweb undisputed number one for D2C SEFs, and has also recorded the largest volumes in INR swaps even compared to D2D SEFs.
- Interestingly, it is not close in D2D space either. BGC have recorded a 74% market share during 2023 of INR swaps executed on D2D SEFs, with TP the remaining 26%.
- I wonder if this is representative of the overall INR market (including off-SEF)? Are there any local brokers? A potentially interesting market to investigate in further blogs – if there is any data out there.
In Summary
- INR swap data sheds more light on another interesting corner of the market.
- Cleared volumes are split between Onshore at CCIL (33% of the total market) vs Offshore at LCH (67%).
- There has been a recent increase in Clearing rate to 86% in November 2023. Will it last?
- Tradeweb and BGC are the market leaders for SEF trading of INR swaps.