- GBP Rates derivatives volumes have recently recovered to nearly 90% of pre-LIBOR cessation levels.
- FRAs and Basis Swap volumes used to make up over 15% of total volumes pre-LIBOR cessation.
- The fact that volumes have reduced by less than the 15% expected is therefore note-worthy.
- Clarus traded volume data suggests that the SONIA market is healthy, despite the challenging market backdrop.
A few weeks ago, I highlighted that the EUR swaps market is now larger in size than the USD swaps market (within a broader blog post on the BRL swaps market):
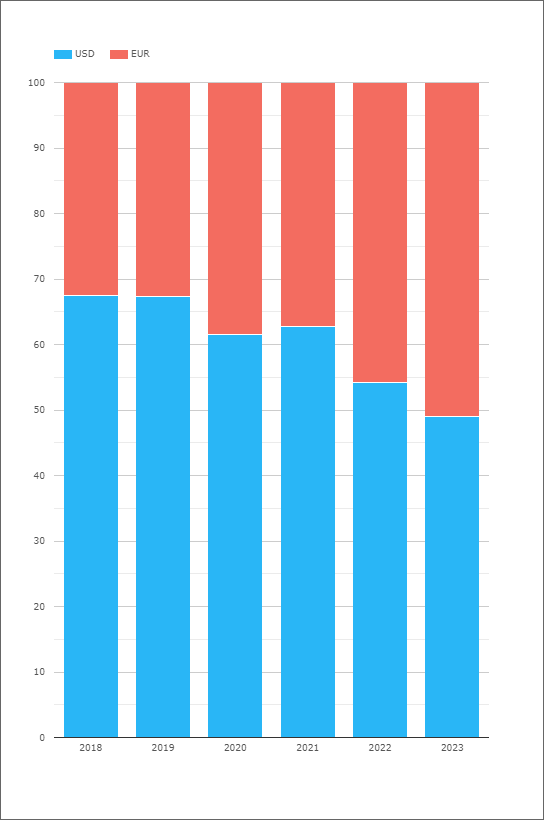
LIBOR cessation is likely the main reason for this change in the relative size of EUR markets. EUR markets trade FRAs and Basis swaps (3s6s, €STR vs ‘Bor) because it is a multiple-rate regime (EURIBOR and €STR). USD markets, post LIBOR-cessation, still have Fed Funds exposure to manage but it is largely a single rate (SOFR) regime now.
This blog takes a look at GBP markets to see how similar changes in product composition are impacting overall volumes.
Sterling markets have not been kind
On the off-chance that any of our readers missed what happened last year (do you not read FTalphaville?):
- 2022 was shaping up to be a really poor year in GBP rates market volumes. I even suggested giving your GBP swaps trader a hug!
- Then the “mini budget” caused a financial market meltdown.
- Which led to the largest increases in margin requirements I think we have ever seen for a single market.
Aware of this background, I think everyone had low expectations for what might be in store for GBP swaps during 2023. Indeed, traders do not sound happy (but do they ever?!) in this recent Risk article:
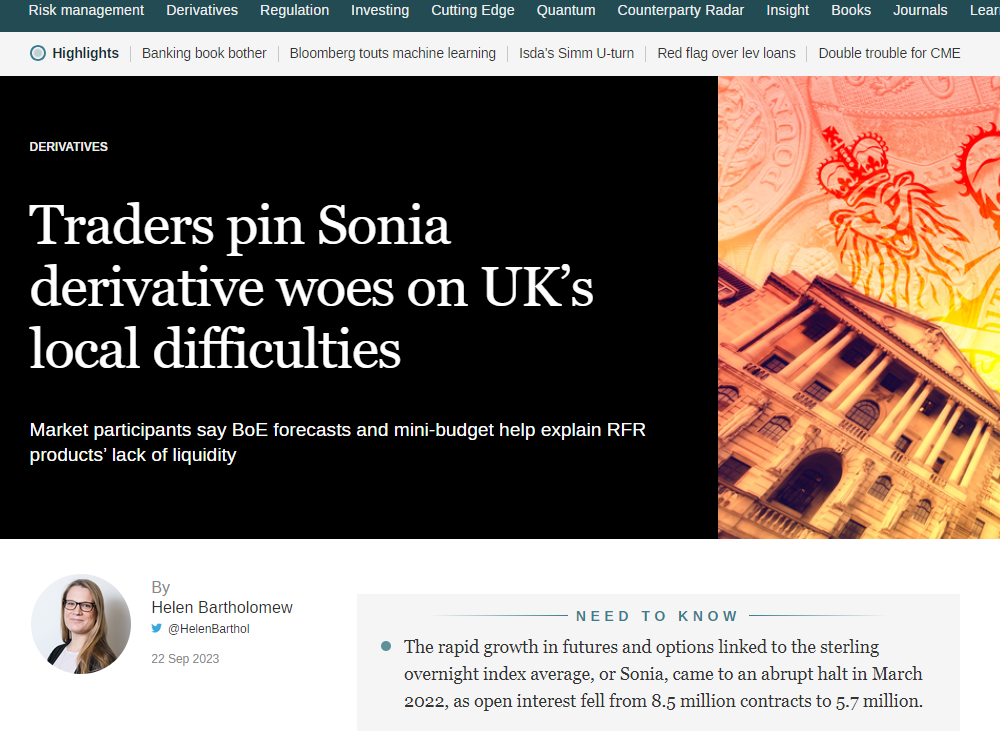
However, our data appears to disagree with trader sentiment. Volumes across GBP Rates derivatives, including GBP SONIA OIS at LCH SwapClear and SONIA Futures at ICE, are healthy this year. We study the volumes below.
A quick health warning first. Anyone who subscribes to the “Matt Levine Effect” (full academic paper here!) should note that the last time I published a “GBP Swaps Review” it took just two weeks before the UK financial markets went absolutely crazy. Sorry in advance….
Overall Sterling Picture
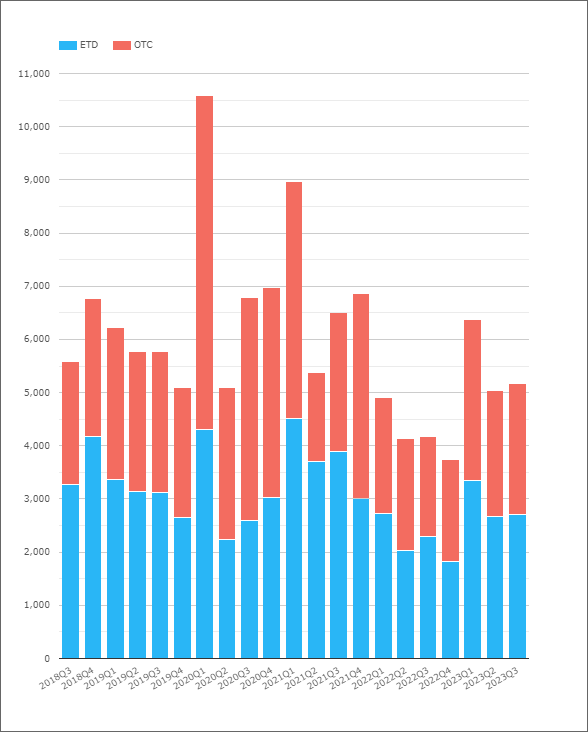
A question that could not be answered before public transparency data (or clearing!): What is the total DV01 that trades in GBP Interest Rate Derivatives? From CCPView:
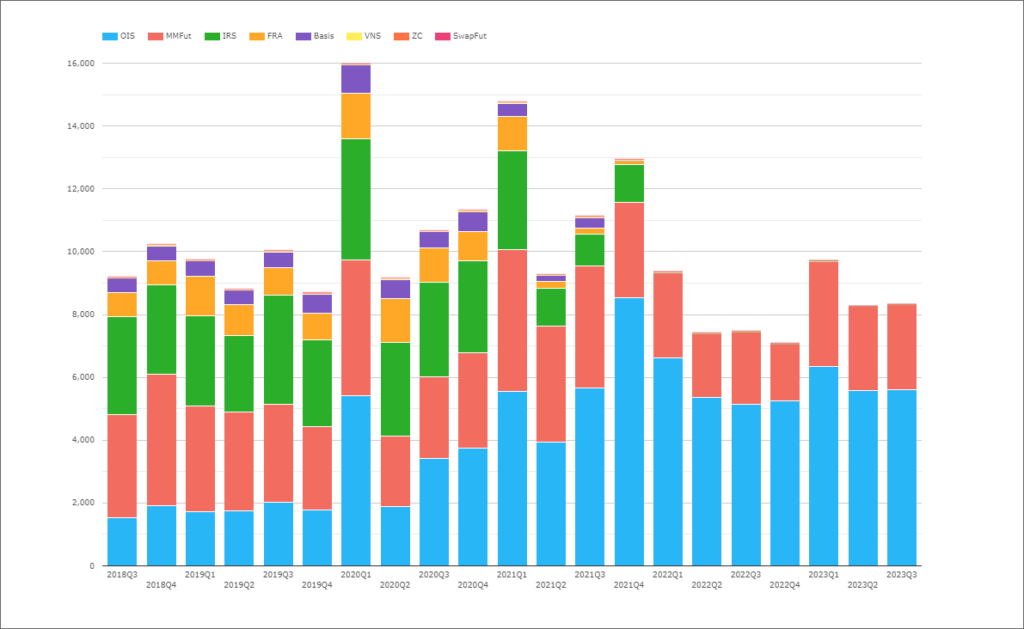
Showing;
- The DV01 traded each quarter of GBP Interest Rate Derivatives across OIS, money market futures (i.e. Short Sterling and SONIA futures), IRS, FRAs, basis swaps (but excluding Gilts and Gilt futures).
- The chart shows our whole history for these products from CCPView, going all the way back to Q3 2018 – 5 years and counting.
- The total amount of GBP risk traded in any quarter is pretty volatile.
- We’ve had some big jumps – notably in Q1 2020 and Q1 2021 (both pre-LIBOR cessation) and in Q4 2021 on the cusp of LIBOR transition (when almost all dealer activity was already versus SONIA).
- Q2 2022 to Q4 2022 stand-out as periods of less risk trading across the whole market. The latter portion of which took place against extreme market volatility.
Swaps and Futures
The chart above highlights certain aspects of GBP markets:
- The amount of risk traded is a volatile metric.
- The whole market (across both OTC and ETD products) saw lower volumes in 2022 compared to any other metric.
- Volumes have recovered in 2023 and are higher than last year.
- These higher volumes come despite higher margins (implying less leverage) and the potential reduction in hedging needs of a whole market segment (LDI, as they “widened their tolerance bands for shifts in bond yields“).
Whilst I am yet to be convinced that “widening tolerance” or re-introducing complex “dirty CSAs” is really the right reaction to underlying market volatility, the GBP derivatives market has done well to bounce-back from what must have felt like an existential shock last year.
Recasting the chart to show the percentage of the overall market traded in either OTC or ETD (Futures) shows that both customised products and standardised products have seen their volumes grow this year:
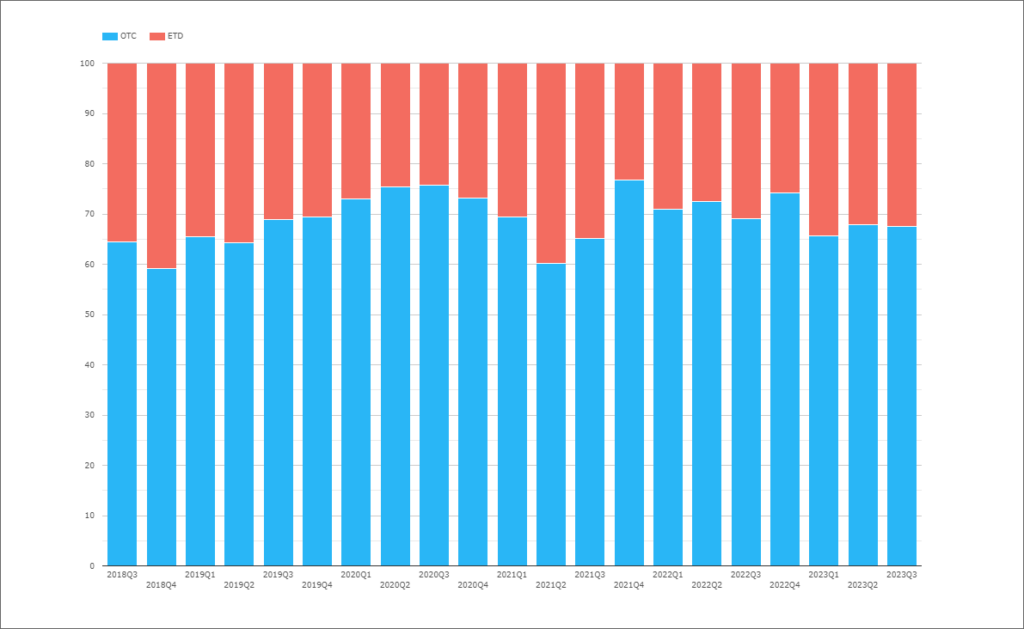
Showing;
- Since 2018, 31% of all GBP risk has been traded as a money market future.
- In 2023, 33% of all GBP risk has been traded as a money market future.
- There hasn’t been any change between the OTC/Futures mix since mid-2019 in GBP markets.
- This shows that the rebound in volumes has been just as healthy in both OTC and ETD markets this year.
2023 Expectations
Recall that comparing volumes pre-LIBOR vs post-LIBOR is not an apples vs apples comparison. There are some very good reasons why the total amount of risk should reduce in an RFR world, and this applies equally across GBP, JPY and CHF markets:
- FRAs do not trade in an RFR world. This implies saying “Goodbye” to at least 10% of all GBP risk (based on the percentage traded as FRAs pre-2020).
- Some FRA activity was facilitated by netting non-IMM dates versus IMM dates, which in turn increased trading in short-sterling. Goodbye convexity trades FRAs vs Futures.
- Basis swaps no longer trade in GBP (no 3s6s, no LIBOR vs OIS). Goodbye to another 5% of GBP gross risk traded.
- GBP swaps used to trade versus 6m LIBOR. This created a particular dynamic in money market futures whereby a single swap fixing led to hedging across two contracts. The second contract tended to be more volatile, but the 3s6s basis would dampen the effect of this volatility. There was therefore a lot of “massaging” of futures contracts past the first contract to hedge this. In an RFR world, this activity has been removed.
These reasons all suggest that the gross amount of GBP risk traded across the market should have decreased by at least 15% as a direct result of LIBOR cessation. What does the data show?
- In 2023, average DV01 traded was $8.77bn per quarter.
- In 2018-2021, average DV01 traded was $10.1-10.7bn per quarter (depending on whether to include the COVID fueled Q1 2020 period or not).
- Trading in 2023 is therefore around 82%-87% of the levels pre-LIBOR cessation.
- A 13-18% reduction in gross risk traded is close to where we expect to be. If anything, the GBP market is larger now in terms of outright risk traded than pre-LIBOR cessation!
Short End vs Long End
Looking at the 4 reasons above for reduced GBP derivatives activity, I expected to see the short-end suffer in terms of volumes more than the long-end. Particularly with FRAs and 3s6s basis disappearing.
In fact, the data shows that the sub 3Y area of the curve during 2023 has transacted volumes equal to 88% of pre-cessation levels:
In Summary
- LIBOR cessation continues to impact swap markets.
- The total amount of GBP rates risk traded is now between 82-87% of pre-cessation levels.
- The disappearance of portfolio maintenance and spread trades (FRAs and basis swaps) should have lead to at least a 15% reduction in traded volumes.
- Volume data in GBP derivatives suggests that there is more outright risk trading now than prior to cessation.