Clearing houses have published their latest CPMI-IOSCO Quantitative Disclosures for Q1 2025.
- Initial margin (IM) for major ETD CCPs was $522 billion – up 2.1 percent QoQ and up 12.5 percent YoY, a new record.
- IM for four major IRS CCPs was $334 billion – up 2.0 percent QoQ and up 6.4 percent YoY, just below the Q1 2023 record of $340 billion.
- IM for cleared CDS was $67 billion – up 9.5 percent QoQ and up 10.9 percent YoY, below the peak of $77 billion in Q2 2022.
- In Q1 2025, several CCP quantitative disclosures show record highs.
- Highlighted are CME, DTCC, ICE, JSCC, LCH, OCC.
- Read our blog for more details.
Background
Under the CPMI-IOSCO Public Quantitative Disclosures, central counterparties (CCPs) publish over 200 quantitative data fields covering margin, default resources, credit risk, collateral, liquidity risk, back-testing, and more.
CCPView has more than 8 years of these quarterly disclosures for 44 clearinghouses, each with multiple Clearing Services, covering the period from 30 September 2015 to 30 September 2024. This disclosure data provides insights into trends over time at one CCP, and comparisons between CCPs.
Let us look at the latest disclosures. I also include charts of cleared open interest (OI) or notional outstanding to compare their dynamic with that of IM.
IM for IRS
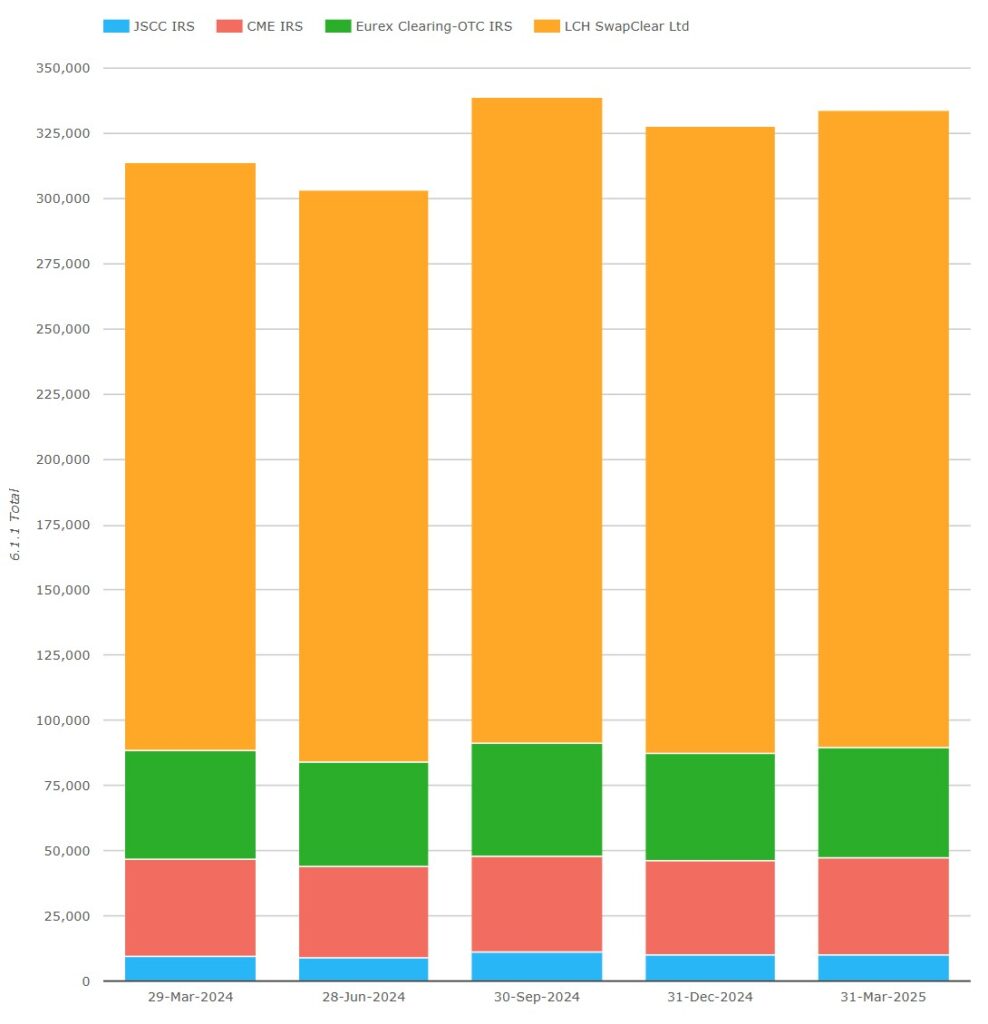
Chart 1a: Quarter-by-quarter IRS IM by CCP ($ millions). Source: CCPView.
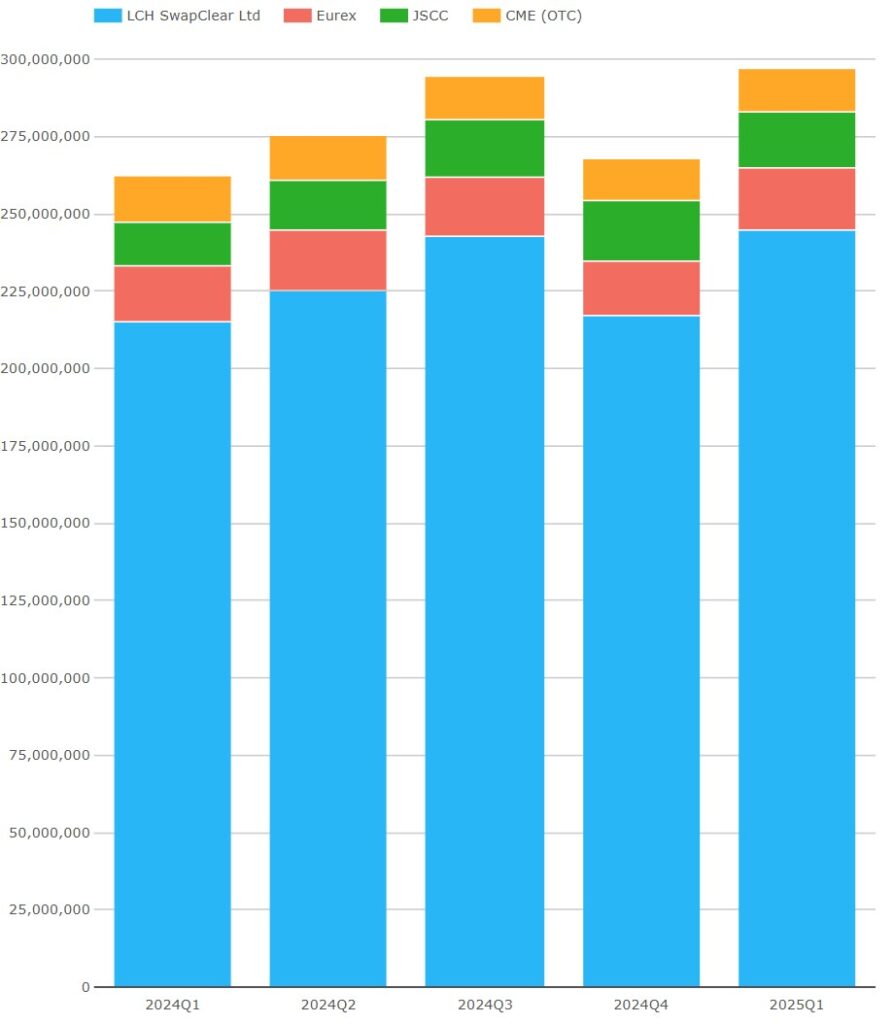
Chart 1b: quarter-by-quarter IRS OI by CCP ($ millions). Source: CCPView
Chart 1a shows that IM at the four major IRS CCPs was $334 billion on 31 March 2025 – up $6.5 billion or 2.0 percent QoQ, and up $20.1 billion or 6.4 percent YoY. This level is $6 billion shy of the previous all-time high of $340 billion on 31 March 2023.
- LCH SwapClear reported $244 billion or £189 billion in GBP terms – down 1.5 percent QoQ from its Q4 2024 peak, and up 5.6 percent YoY.
- Eurex OTC IRS had $42.5 billion or €39.2 billion in EUR terms – down 0.4 percent QoQ, and up 1.4 percent YoY – well below its Q4 2022 high of €59.4 billion.
- CME IRS disclosed $37.2 billion – up 2.8 percent QoQ, and down 0.6 percent YoY, less than 0.5 billion from its Q2 2022 high of $37.6 billion.
- JSCC IRS revealed $9.94 billion or ¥1,485 billion in JPY terms – down 6.2 percent QoQ, and up 4.2 percent YoY in JPY terms, well below its Q3 2023 high of ¥1,941 billion.
Chart 1b shows that notionals outstanding usually moved in synch with IM, except for Q2 2024 when IM decreased despite notionals increasing. This perhaps reflects a decline in long-term rates as central banks became more comfortable with inflation.
IM for CDS
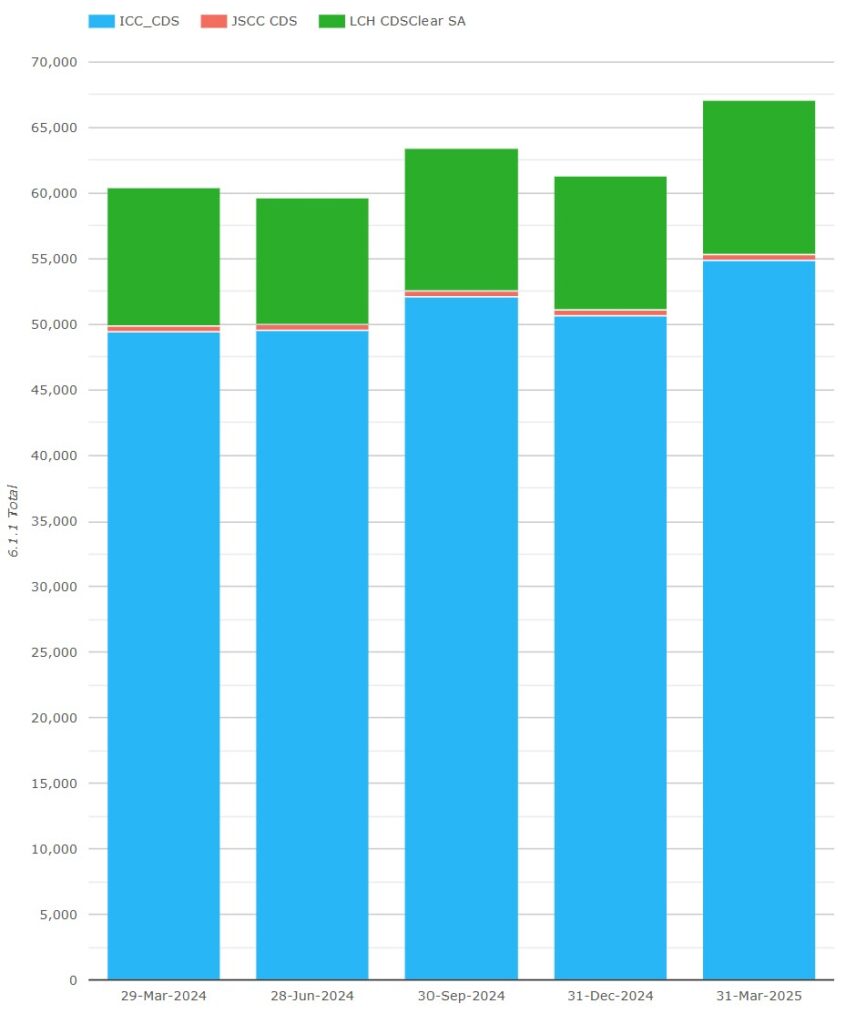
Chart 2a: Quarter-by-quarter CDS IM by CCP ($ millions). Source: CCPView.
Chart 2b: Quarter-by-quarter CDS OI by CCP ($ millions). Source: CCPView.
Chart 2a shows that IM at major CDS CCPs totaled $67 billion on 31 March 2025 – up $5.8 billion or 9.5 percent QoQ and up $6.6 billion or 10.9 percent YoY, but well below the peak just below $77 billion in Q2 2022.
- ICE Credit Clear disclosed $54.9 billion – up 8.3 percent QoQ and up 11.2 percent YoY, but below its $58.8 billion peak in Q2 2022.
- LCH CDSClear reported $11.8 billion or €10.9 billion – up 10.8 percent QoQ and up 10.3 percent YoY. This is a new record – exceeding the prior high of €9.9 billion in Q1 2024.
- JSCC CDS reported $420 million or ¥62.3 billion – up 3.2 percent QoQ and down 12.2 percent YoY, far below its ¥183.9 billion peak in Q1 2020.
Chart 2b shows CDS OI moving largely in synch with CDS IM.
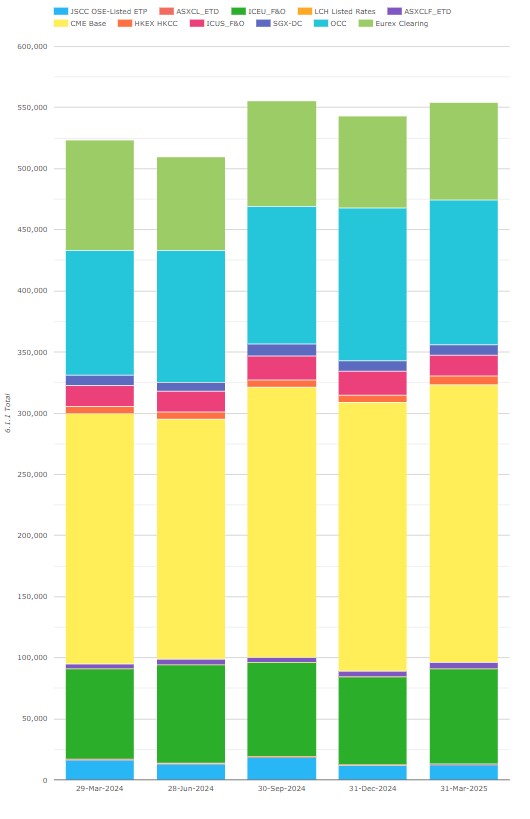
Chart 3: Quarter-by-quarter ETD IM by CCP ($ millions).
IM at our selected ETD CCPs was $510.6 billion on 31 March 2024 – up 1.9 percent QoQ ($9.3 billion), and up 6.2 percent YoY ($29.8 billion) – still comfortably below the peak of $605.4 billion in Q1 2022. (The chart shows higher totals as Eurex includes OTC IRS IM, which I exclude). CME disclosed $226.8 billion- up 3.0 percent QoQ and up 10.7 percent YoY.
- OCC had $118.0 billion – up 5.5 percent QoQ and up 16 percent YoY.
- ICE Europe F&O declared $78.1 billion – up 8.7 percent QoQ and up 5.8 percent YoY.
- Eurex divulged $37.1 billion – up 7.9 percent QoQ and down 23 percent YoY.
- ICE US F&O showed $17.5 billion – down 8.8 percent QoQ and up 3.1 percent YoY.
- JSCC OSE Listed ETP reported $12.4 billion – up 4.4 percent QoQ and down 24 percent YoY.
- SGX-DC had $8.5 billion – down 1.1 percent QoQ and up 0.06 percent YoY.
- HKEX HKCC declared $7.3 billion – up 19 percent QoQ and up 23 percent YoY.
- ASX CLF ETD divulged $4.9 billion – up 15 percent QoQ and up 18 percent YoY.
- LCH Listed Rates reported IM of $4 million – up 33 percent QoQ. We include this to monitor progress with FMX’s new interest rate futures trading, which went live in 2024.
Other disclosures of interest
We can use a CCPView feature to highlight metrics that change significantly more than 10 percent. Let us use this to scan Q1 2025 disclosures for the major clearinghouses.
- CME Base reported kccp (4.2.1) at 66 – up from 27, which was a considerable drop from 177 the quarter before.
- CME reported that qualifying liquid resources (a) cash deposited at central banks in USD (7.1.2) were $108.0 million – up 23.6 percent QoQ and 25.7 percent YoY. Their total cash IM disclosures (6.2.1) suggest that most of this increase came from CME Base, that is, their ETD CCP.
- DTCC GSD (providing UST bond and repo clearing as discussed in my ION Markets Blogs) reported their total IM required (6.1.1) was steady at $62.9 billion – down 4.0 percent QoQ, but up 46 percent YoY. This may reflect a pause on buy-side repo clearing expansion, given the one-year delay in the UST repo clearing mandate go-live to 30 June 2027 announced recently by the SEC.
- DTCC MBSCC (providing mortgage-backed securities clearing) disclosed kccp (4.2.1) at 17 down from 83 the prior quarter.
- DTCC NSCC (providing equities and corporate bond clearing) reported zero excess under amounts exceeded (7.3.3 and 7.3.7) after showing a $7 billion excess in the prior quarter disclosure. Their maximum VM (6.7.1) and IM (6.8.1) on any business day rose to $9.2 billion and $13.9 billion respectively – up 133 percent and 93 percent, while their volumes were up more than 10 percent both QoQ and YoY.
- Eurex total IM (6.1.1) had some large percentage moves for services not covered above: their FX service showed €213 million – down 34 percent QoQ, their fixed income service showed €4,071 million – down 22 percent QoQ, and their “remaining products” showed €1,083 million – up 147 percent QoQ.
- Eurex OTC IRS clearing excesses of marked-to-market exposure above margin coverage (6.5.1.1) were 415 – up from 119 in the prior quarter.
- Eurex group maximum VM (6.7.1) and IM (6.8.1) received on any business day were 15,066 million and 6,773 million respectively – up 143 percent and 34 percent respectively QoQ.
- HKEX SEOCH (providing options clearing) total IM required (6.1.1) was USD 2,898 million – up 79 percent QoQ and 172 percent YoY.
- LCH SwapClear reported its estimated largest aggregate stress loss in excess of IM caused by the default of a single participant (4.4.3) was £2,962 million – up 16 percent QoQ and 80 percent YoY while the same metric when caused by the default of any two participants (4.4.7) was £5,607 million – up 24 percent QoQ and 61 percent YoY.
- LCH ForexClear maximum aggregate IM call on any day in the quarter (6.8.1) fell back to £1,408 down 50 percent QoQ from the peak last quarter and down 16 percent YoY, while total IM (6.1.1) declined 13 percent.
- LCH SA Bonds and Repos EUR gross notional outstanding of novated but not settled cash bond trades (23.2.1) reverted to €87,630 million (near the Q3 2024 level), after having dropped to €1.9 million in the prior quarter. Meanwhile, their average notional of trades EUR trades cleared (23.1.2) was 47,502 million – up 45 percent QoQ and 62 percent YoY.
- LCH CDSClear SA’s maximum total VM received on any business day (6.7.1) was €423 million, up 113 percent QoQ and 265 percent YoY, while the maximum aggregate IM call on any business day (6.8.1) was €682 million – up 87 percent QoQ and 56 percent YoY.
- LCH CDSClear SA’s number of general clearing members (18.1.1.1) and number of foreign participants (18.1.3.2) each increased by 1 to 29 and 20 respectively, while the number of bank participants (18.1.2.3) remained unchanged.
- OCC’s mean over 12 months largest aggregate stress loss (4.4.3) was $6,588 million – up 12.5 percent QoQ and 71 percent YoY, while their maximum aggregate IM call on any day in the period (6.8.1) was $13,423 million – up 80 percent QoQ and 183 percent YoY.
- OCC’s USD options average daily volumes (23.3.1) rose to 58.4 million contracts – up 13.2 percent (6.8 million contracts) QoQ, and up 23.2 percent (11.0 million contracts) YoY.
There are a lot more Clearing Services and Disclosures for non-major clearinghouses, but we will stop there for today and leave those of you with CCPView access to analyze further.
As well as a Web UI, we also offer an API to access this data programmatically.
IOSCO quantitative disclosures
CCPView has disclosures from 44 clearing houses, each with many Clearing Services covering equities, bonds, futures, options, and OTC derivatives – with over 200 quantitative data fields each quarter and quarterly figures from September 2015 to September 2024.
If you are interested in this data, please get in touch.